It could be the best of meteor showers, or it could be the…
Well, we’ll delve into the alternatives here in a bit. For now, we’ll call upon our ever present astronomical optimism and say that one of the best meteor showers of 2014 may potentially be on tap for this weekend.
This is a true wild card event. The meteor shower in question hails from a periodic comet 209P LINEAR discovered in 2004 and radiates from the obscure and tongue-twisting constellation of Camelopardalis.
But whether you call ‘em the “209/P-ids,” the “Camelopardalids,” or simply the “Cams,” this weekend’s meteor shower is definitely one worth watching out for. The excitement surrounding this meteor shower came about when researchers Peter Jenniskens and Esko Lyytinen noticed that the Earth would cross debris streams laid down by the comet in 1803 and 1924. Discovered by the LIncoln Near-Earth Asteroid Research (LINEAR) automated all-sky survey located at White Sands, New Mexico, comet 209P LINEAR orbits the Sun once every 5.1 years. 209P LINEAR passed perihelion at 0.97 AUs from the Sun this month on May 6th.
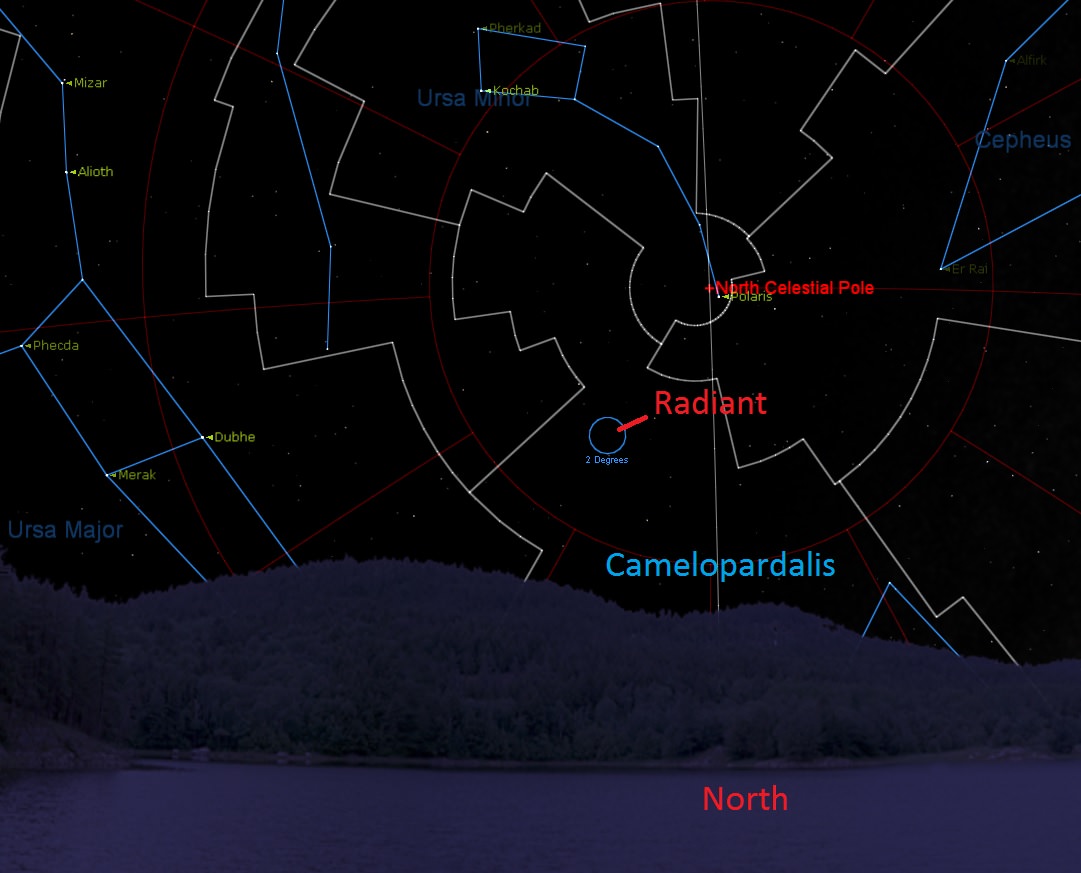
Looking north from latitude +30N at 7:00 UT on the morning of May 24th. Created using Starry Night.
The meteor shower peaks this coming U.S. Memorial Day weekend on Saturday, May 24th. The expected peak is projected for right around 7:00 Universal Time (UT) which is the early morning hours of 3:00 AM EDT, giving North America a possible front row seat to the event. Estimates for the Zenithal Hourly Rate (ZHR) of the Camelopardalids run the gamut from a mild 30 to an outstanding 400 per hour. Keep in mind, this is a shower that hasn’t been witnessed, and it’s tough enough to forecast the timing and activity of known showers. It’s really a question of how much debris the 1803 and 1924 streams laid down on those undocumented passages. One possible strike against a “meteor storm” similar to the 1998 Leonids that we witnessed from Kuwait is the fact that the “Cams” have never been recorded before. Still, you won’t see any if you don’t try!
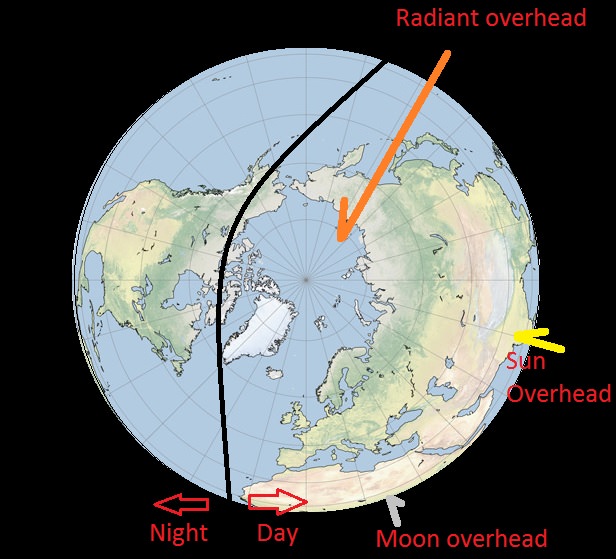
The orientation of the Earth, the day/night terminator, the Sun, Moon and radiant of the meteor shower on May 24th at 7:00 UT. Created by author.
Comet 209P/LINEAR passes 0.055 AUs — about 8.3 million kilometres — from the Earth on May 29th, shining at +11th magnitude and crossing south into the constellation of Leo Minor in late May. Interestingly, it also passes 0.8 degrees from asteroid 2 Pallas on May 26th. Though tiny, comet 209P/LINEAR’s 2014 passage ranks as the 9th closest recorded approach of a comet to the Earth.
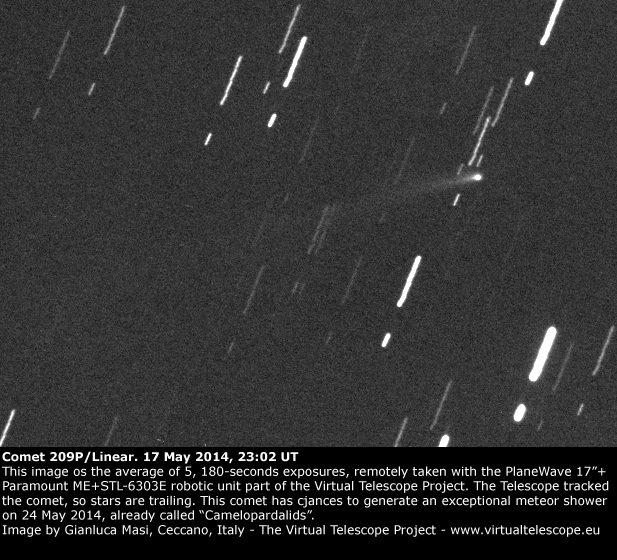
A recent image of comet 209/P LINEAR. credit: The Virtual Telescope Project.
The Moon is also at an ideal phase for meteor watching this coming weekend as it presents a waning crescent phase just 4 days from New and rises at around 4:00 AM local.
The expected radiant for the Cams sits at Right Ascension 8 hours and declination 78 degrees north in the constellation of Camelopardalis, the “camel leopard…” OK, we’ve never seen such a creature, either. (Read “giraffe”). Unfortunately, this puts the radiant just 20 degrees above the northern horizon as seen from +30 degrees north latitude here in Florida at 7:00 UT. Generally speaking, the farther north you are, the higher the radiant will be in the sky and the better your viewing prospects are. Canada and the northern continental United States could potentially be in for a good show. Keep in mind too, the high northern declination of the radiant means that it transits the meridian (crosses upper culmination) a few hours before sunset Friday night at 6 PM local; this means it’ll have an elevation of about 38 degrees above the horizon as seen from 30 degrees north latitude just after sunset. It may well be worth watching for early activity after dusk!
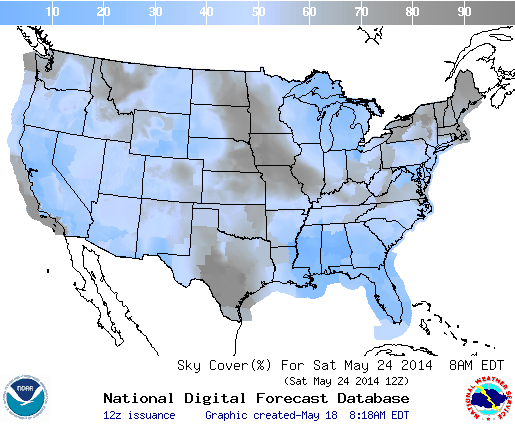
A look ahead at the cloud cover prospects for the morning of May 24th. Credit: NOAA.
Clouded out or live on the wrong side of the planet to watch the Camelopardalids? Slooh will be carrying a live broadcast of the event starting at 3:00 PM PDT/ 6:00 PM EDT/ 22:00 UT. Also, the folks at the Virtual Telescope Project will carry two separate webcasts of the event, one featuring the progenitor comet 209P LINEAR starting at 20:00 UT on May 22nd and another featuring the meteor shower itselfstarting at 5:30 UT on May 24th.
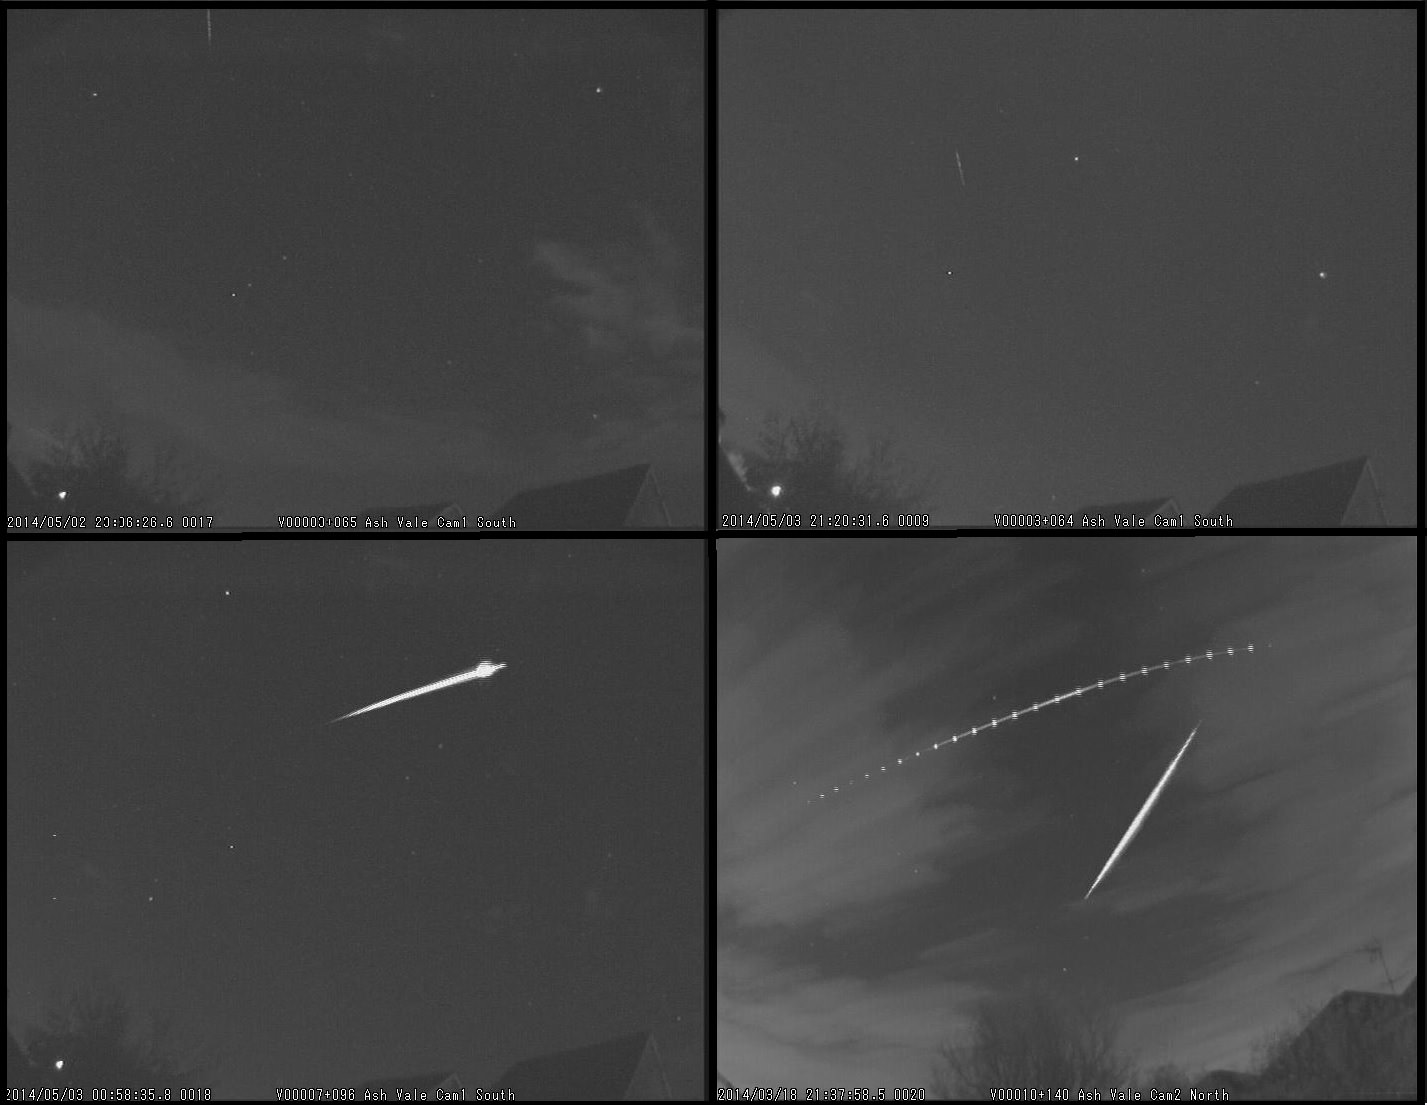
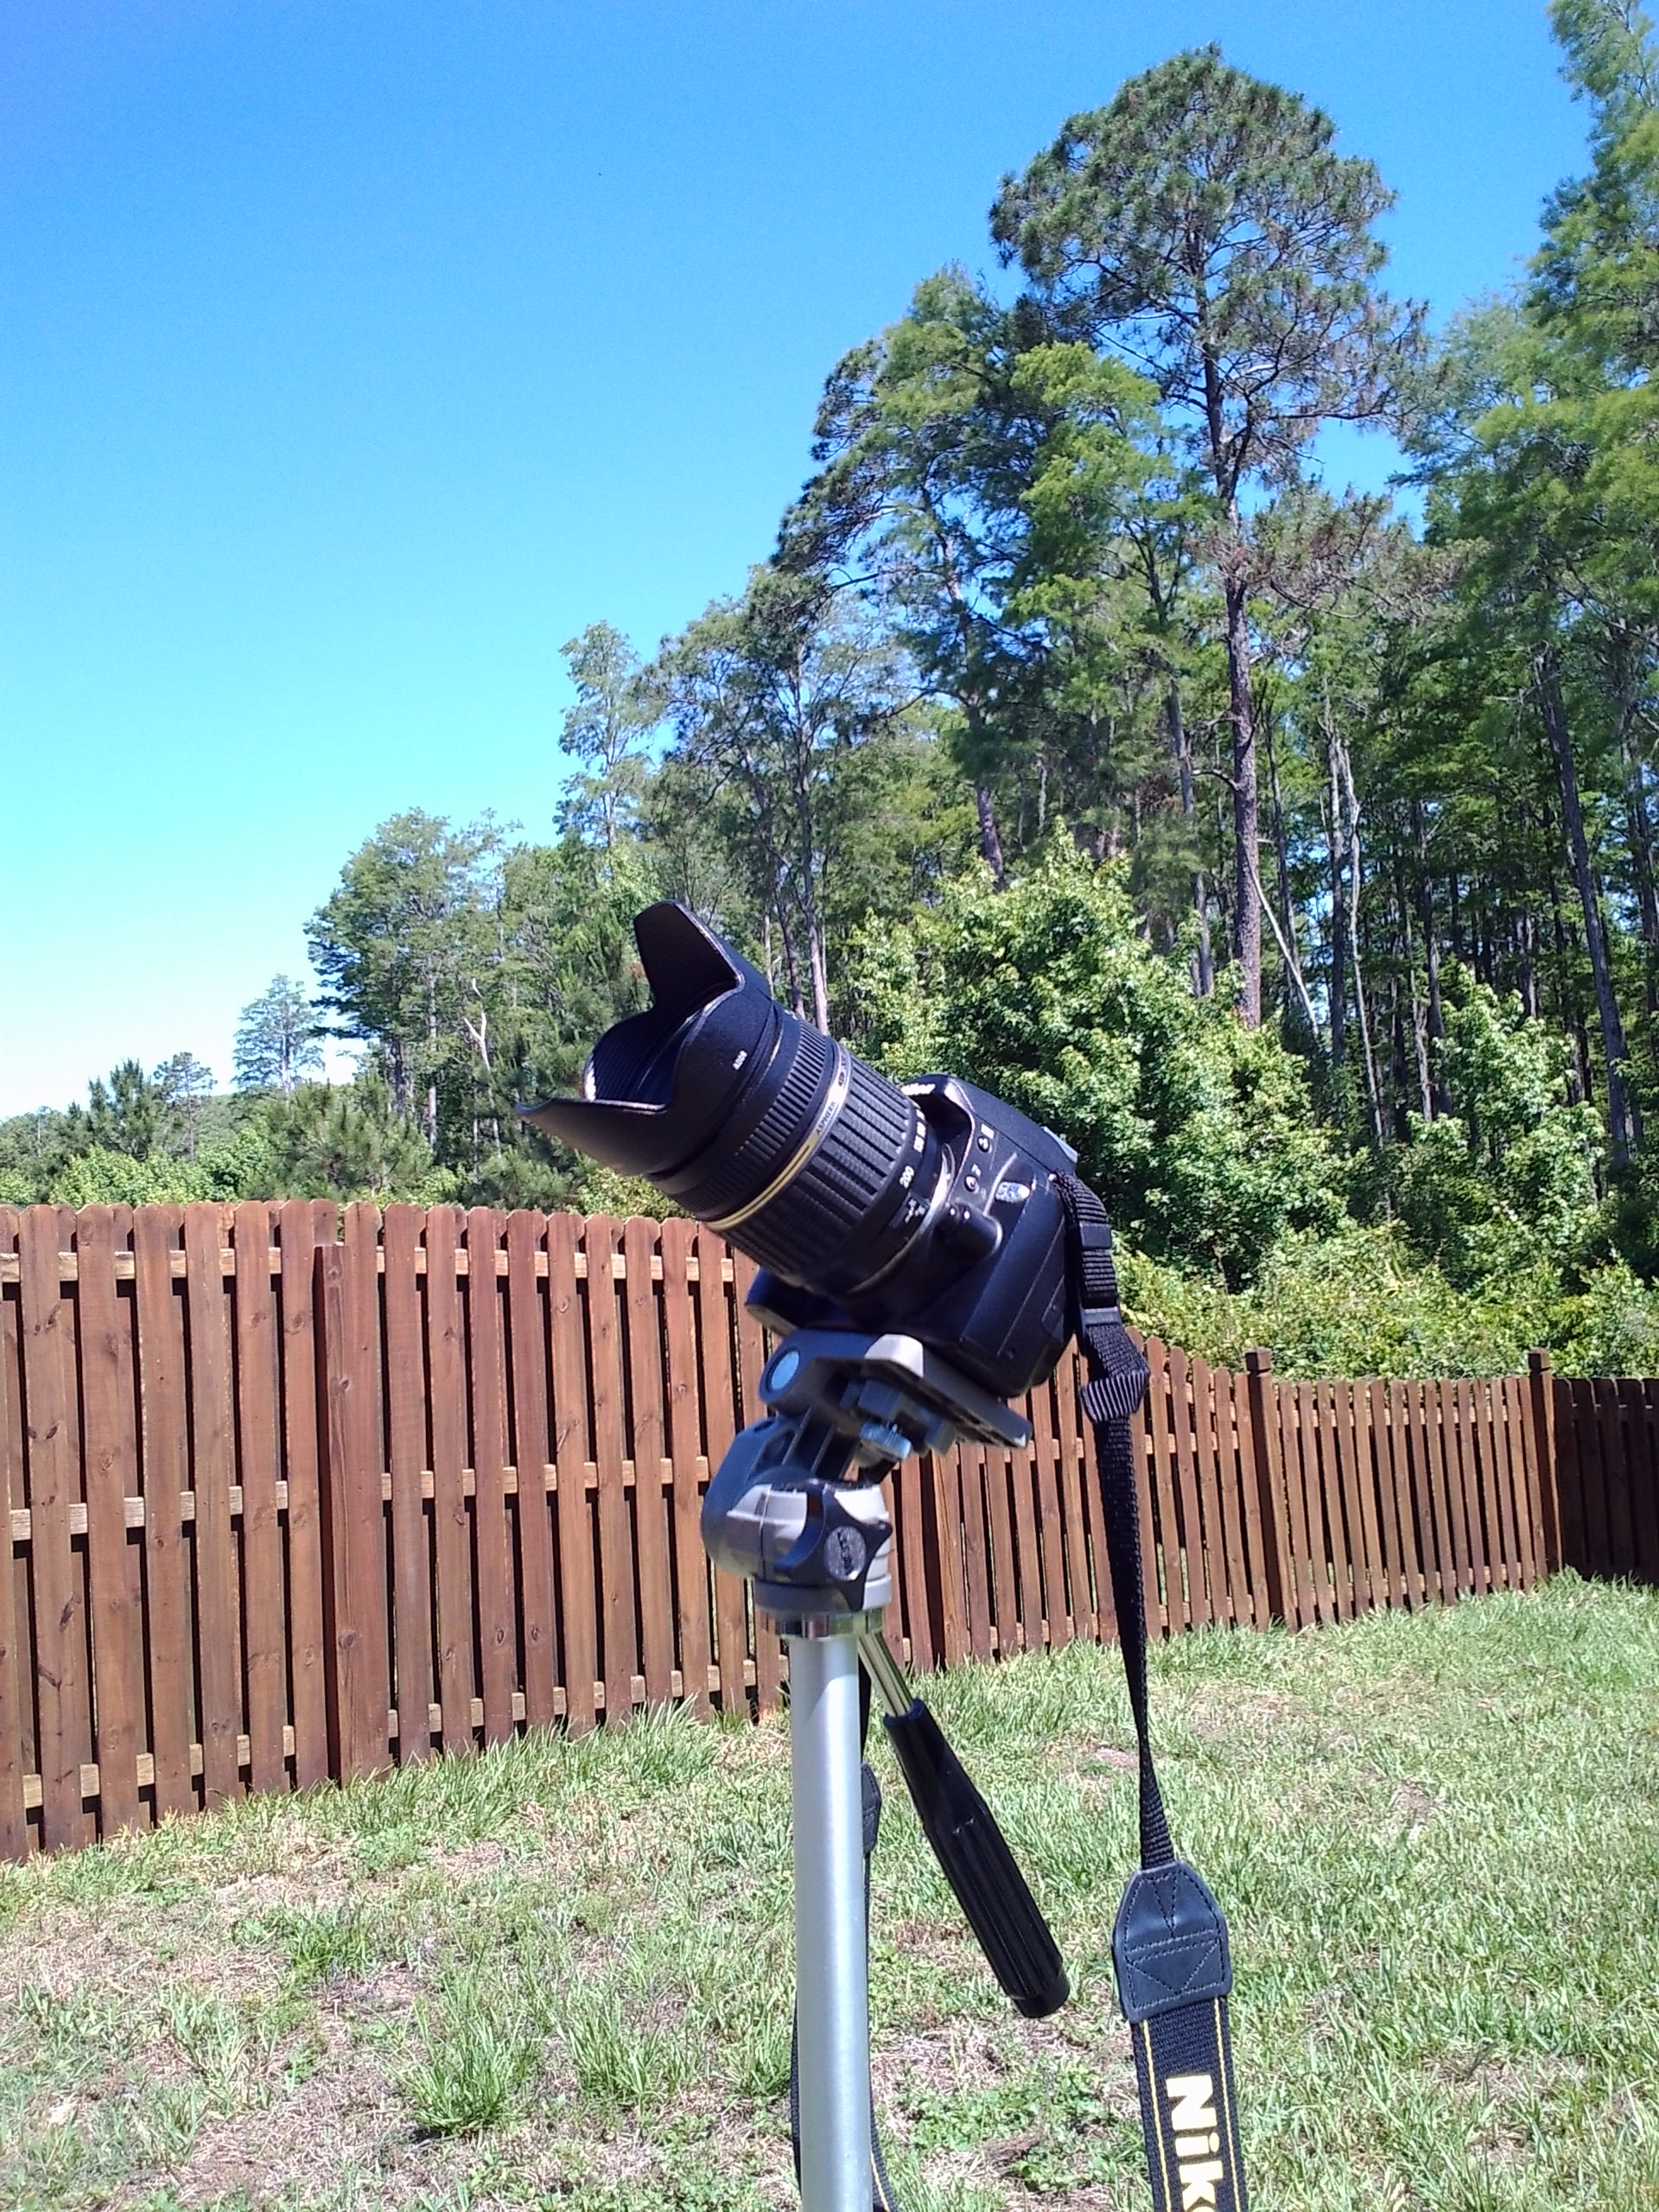
Observing meteors is fun and easy and requires nothing more than a good pair of “mark-1 eyeballs” and patience. And although the radiant may be low to the north, meteors can appear anywhere in the sky. We like to keep a pair of binocs handy to examine any lingering smoke trains left by bright fireballs. Counting the number of meteors you see from your location and submitting this estimate to the International Meteor Organization may help in ongoing efforts to understand this first time meteor shower. And capturing an image of a meteor is as simple as setting a DSLR on a tripod with a wide field of view and taking time exposures of the sky… something you can start practicing tonight.
Our humble meteor observing rig… (Photo by author).
Don’t miss what could well be the astronomical event of the year… I’d love to see a meteor shower named after an obscure constellation such as the #Camelopardalids trending. And we fully expect to start fielding reports of “strange rocks falling from the sky” this week, which the cometary dust that composes a meteor shower isn’t. In fact, Meteorite Man Geoffrey Notkin once noted that no confirmed meteorite fall has ever been linked to a periodic meteor shower.
Don’t miss the celestial show!
-Got pics of the Camelopardalids? Send ‘em to Universe Today. There’s a good chance that we’ll run an after-action photo-round up if the Cams kick it into high gear.
-Read more about the Camelopardalidshere in a recent outstanding post by Bob King on Universe Today.
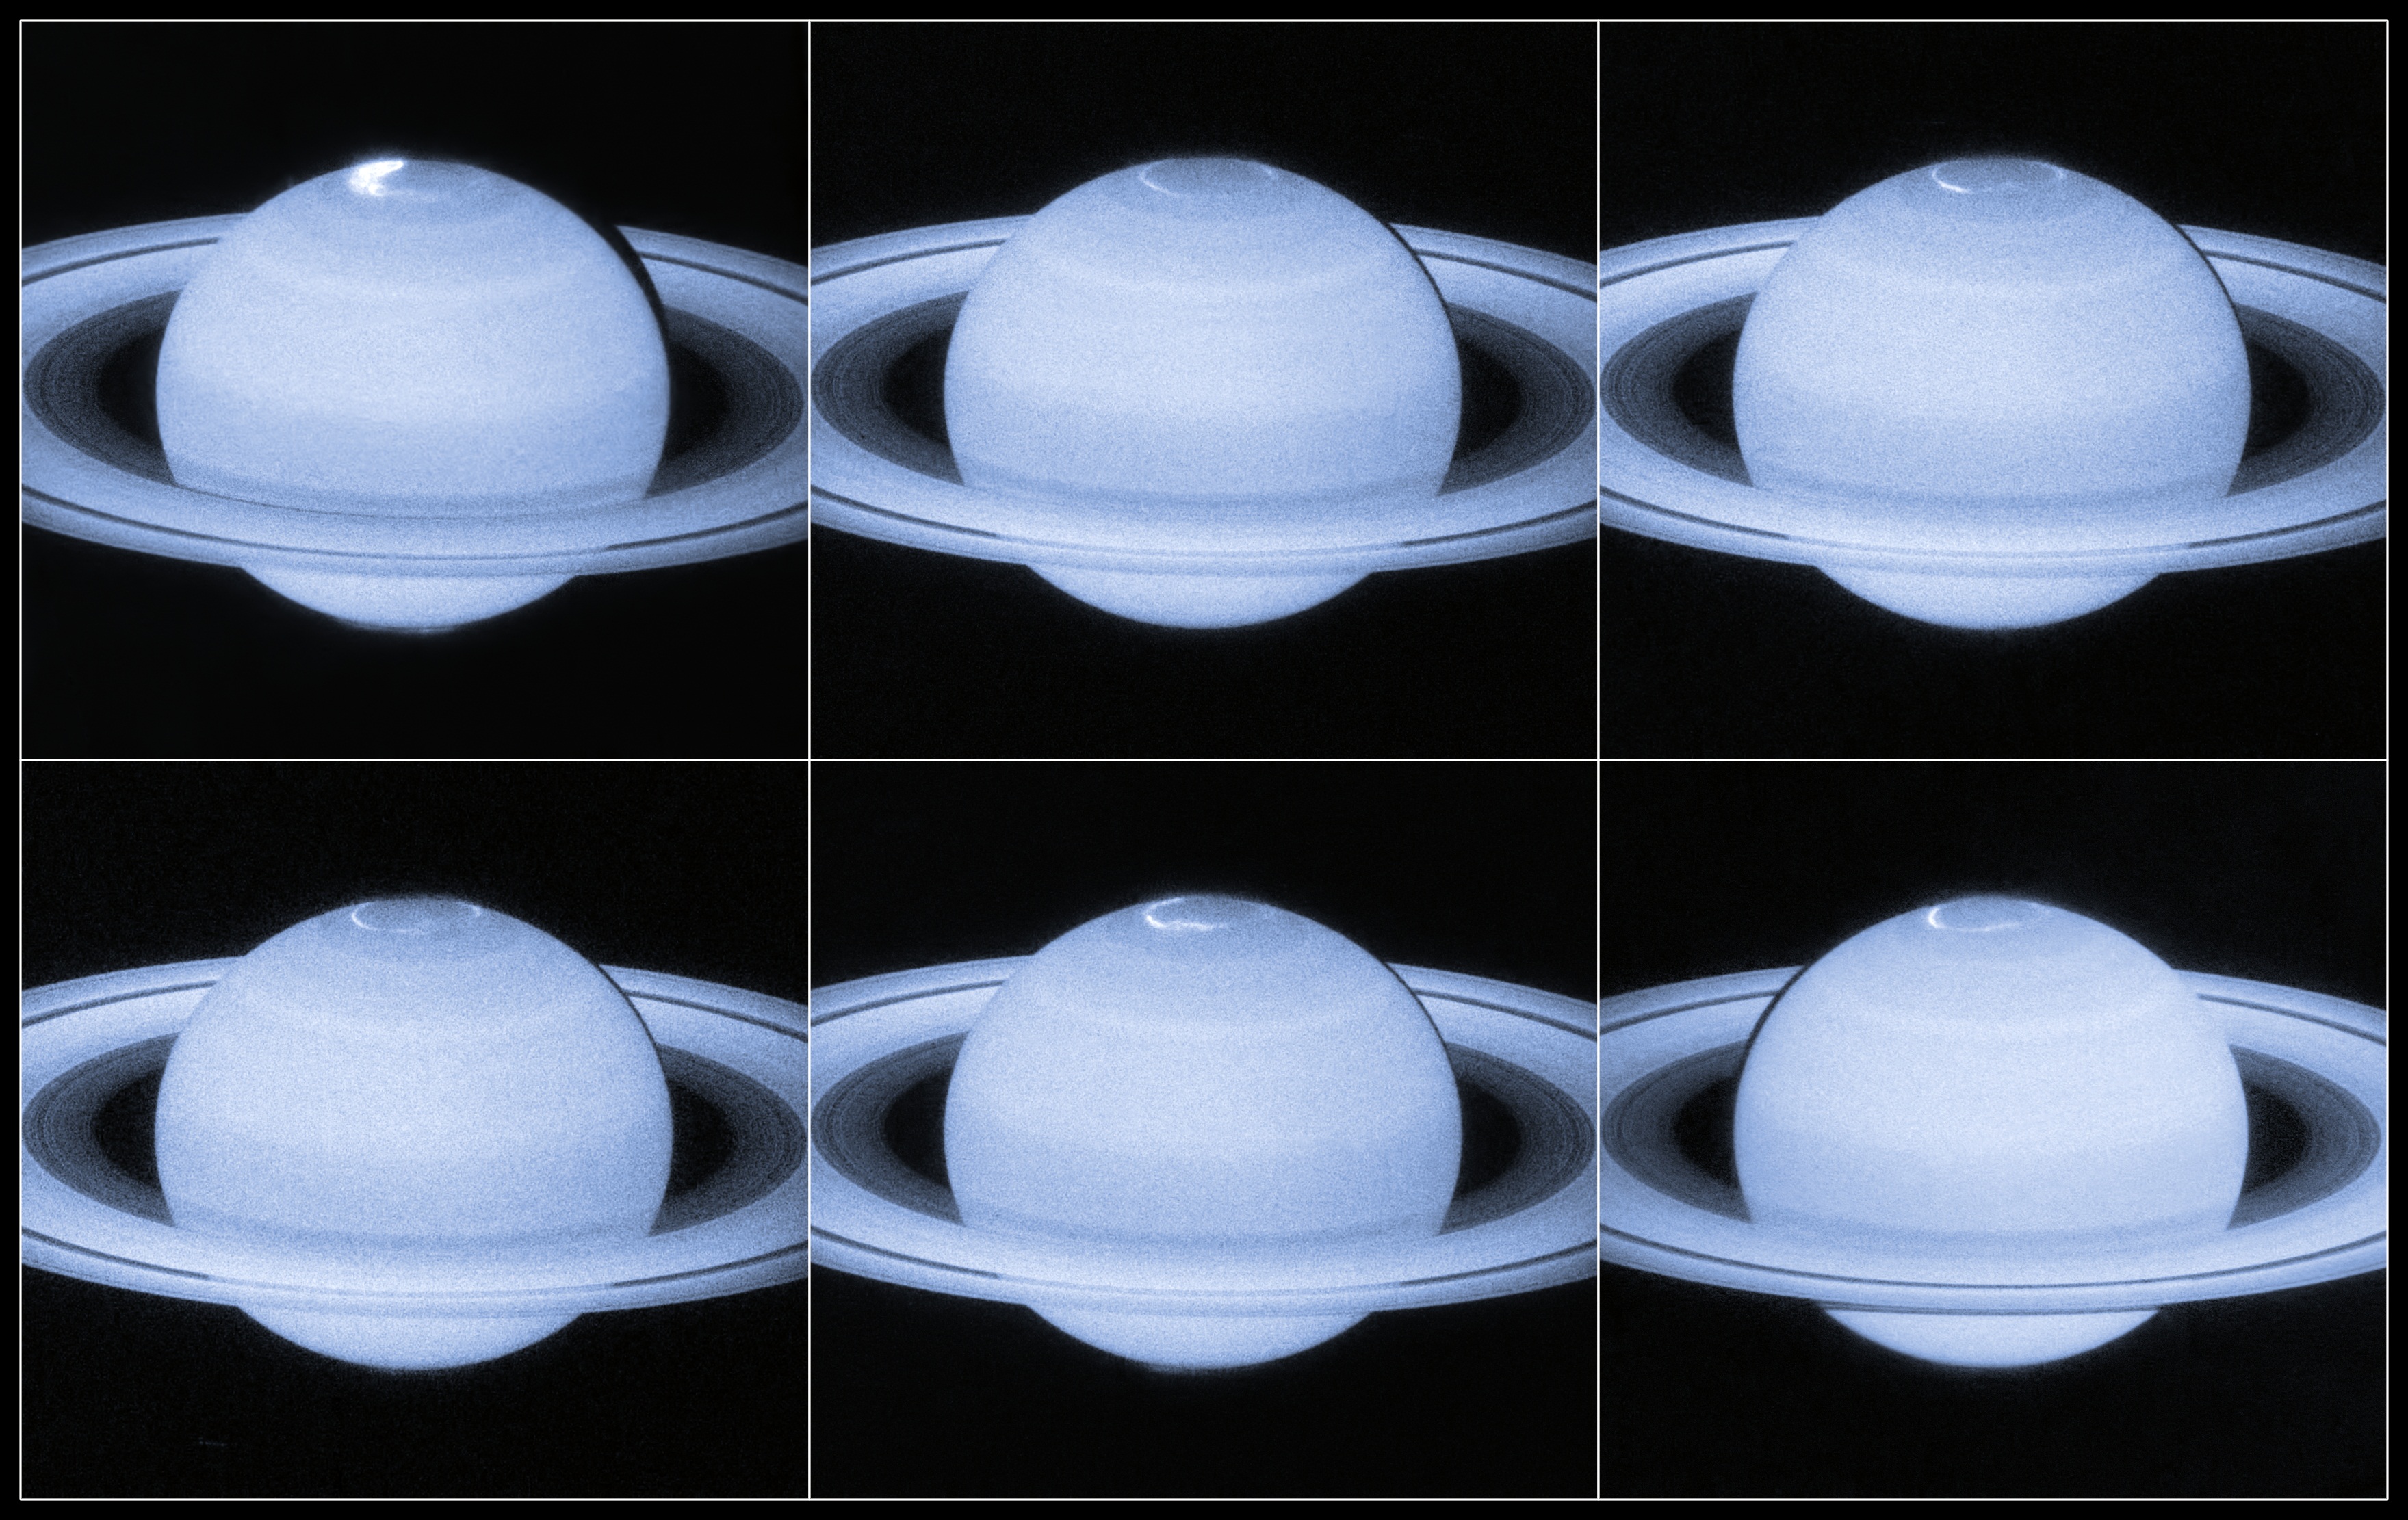
Several images of an aurora on Saturn's north pole taken in April and May 2013 by the Hubble Space Telescope. Credit: NASA/ESA, Acknowledgement: J. Nichols (University of Leicester)
It’s amazing to see what some flashes of light can tell us. New images the Hubble Space Telescope took of Saturn not only reveal auroras dancing in the north pole, but also reveal some interesting things about the giant planet’s magnetic field.
“It appears that when particles from the Sun hit Saturn, the magnetotail collapses and later reconfigures itself, an event that is reflected in the dynamics of its auroras,” the European Space Agency wrote in a description of the image.
“Saturn was caught during a very dynamic light show – some of the bursts of light seen shooting around Saturn’s polar regions traveled more than three times faster than the speed of the gas giant’s roughly 10-hour rotation period.”
And for those readers that remember the music video from Saturn that the Cassini spacecraft took — also of auroras — ESA said this new research complements what the other spacecraft did, too.
The research has been accepted for publication in Geophysical Research Letters.
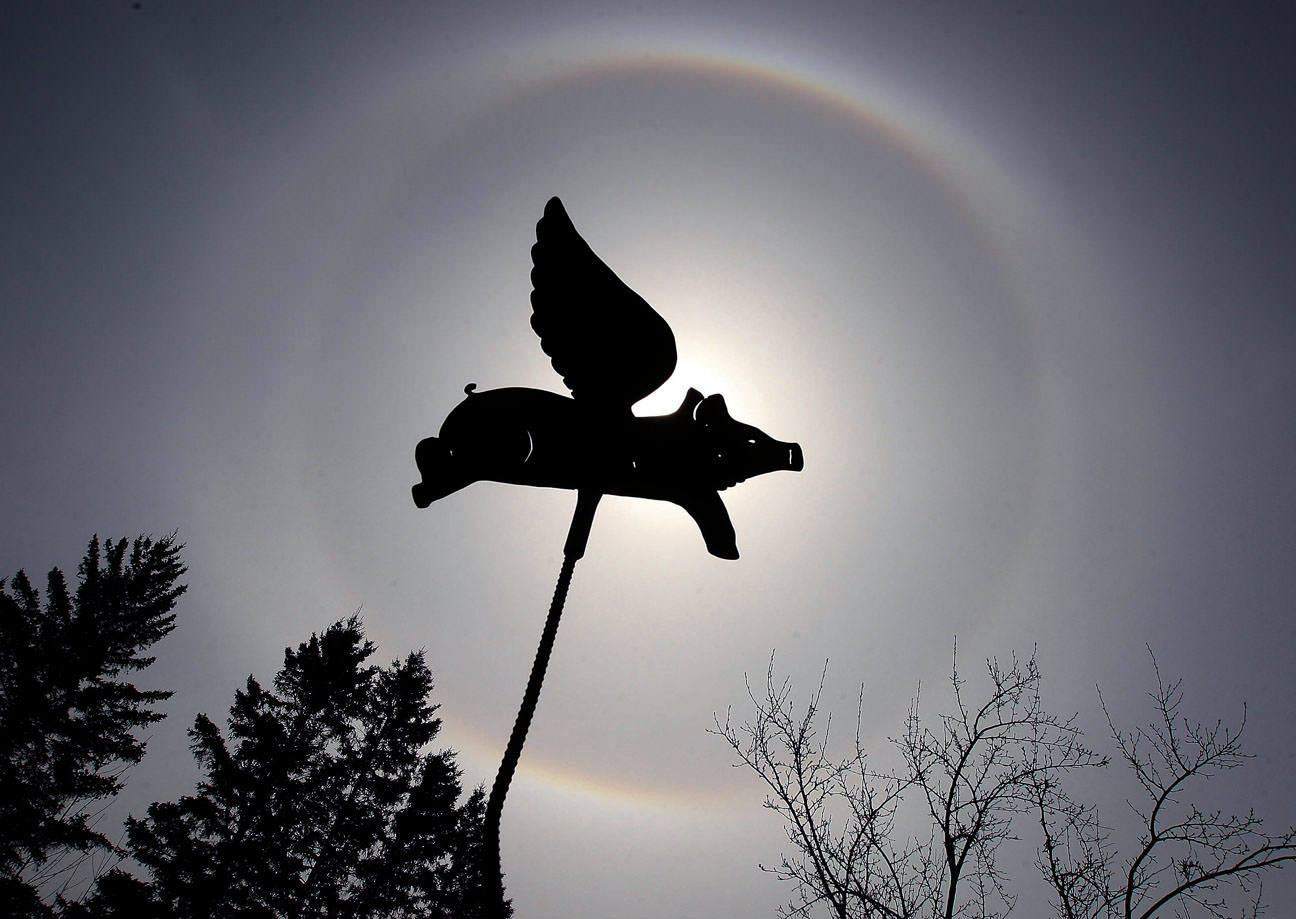
A circumscribed halo encloses the more common 22-degree halo around the sun Saturday morning (May 17. Credit: Bob King
Call it a porcine occultation. It took nearly a year but I finally got help from the ornamental pig in my wife’s flower garden. This weekend it became the preferred method for blocking the sun to better see and photograph a beautiful pair of solar halos. We often associate solar and lunar halos with winter because they require ice crystals for their formation, but they happen during all seasons.
Nature keeps it simple. Light refracting through or reflecting from six-sided plate and column (pencil-shaped) ice crystals in high clouds is responsible for almost all halos and their variations.
Lower clouds, like the puffy cumulus dotting the sky on a summer day, are composed of water droplets. A typical cumulus spans about a kilometer and contains 1.1 million pounds of water. Cirrostratus clouds are much higher (18,000 feet and up) and colder and formed instead of ice crystals. They’re often the first clouds to betray an incoming frontal system.
Cirrostratus are thin and fibrous and give the blue sky a milky look. Most halos and related phenomena originate in countless millions of hexagonal plate and pencil-shaped ice crystals wafting about like diamond dust in these often featureless clouds.
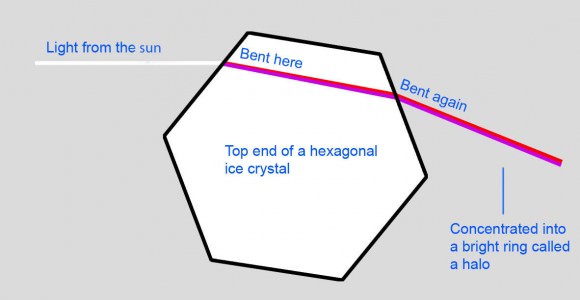
This is the top end of a hexagonal column-shaped ice crystal. Light refracting (bending) through the 60-degree angled faces of millions of these crystals is concentrated into a ring of light 22 degrees from the sun. As light leaves the crystal, the shorter blue and purple wavelengths are refracted slightly more than red, tinting the outer edge of the halo blue and inner edge red. Credit: Donalbein with additions by the author
In winter, the sun is generally low in the sky, making it hard to miss a halo. Come summer, when the sun is much higher up, halo spotters have to be more deliberate and make a point to look up more often. The 22-degree halo is the most common; it’s the inner of the two halos in the photo above. With a radius of 22 degrees, an outstretched hand at arm’s length will comfortably fit between sun and circle.
Light refracted or bent through millions of randomly oriented pencil-shaped crystals exits at angles from 22 degrees up to 50 degrees, however most of the light is concentrated around 22 degrees, resulting in the familiar 22-degree radius halo. No light gets bent and concentrated at angles fewer than 22 degrees, which is why the sky looks darker inside the halo than outside. Finally, a small fraction of the light exits the crystals between 22 and 50 degrees creating a soft outer edge to the circle as well as a large, more diffuse disk of light as far as 50 degrees from the sun.
The sun on Dec. 6, 2013 with a 22-degree halo and two luminous canine companions or sundogs. Similar halos and ‘moondogs’ can be seen around a bright moon. Credit: Bob King
Sundogs, also called mock suns or parhelia, are brilliant and often colorful patches of light that accompany the sun on either side of a halo. Not as frequent as halos, they’re still common enough to spot half a dozen times or more a year. Depending on how extensive the cloud cover is, you might see only one sundog instead of the more typical pair. Sundogs form when light refracts through hexagonal plate-shaped ice crystals with their flat sides parallel to the ground. They appear when the sun is near the horizon and on the same horizontal plane as the ice crystals. As in halos, red light is refracted less than blue, coloring the dog’s ‘head’ red and its hind quarters blue. Mock sun is an apt term as occasionally a sundog will shine with the intensity of a second sun. They’re responsible for some of the daytime ‘UFO’ sightings. Check this one one out on YouTube.
An especially colorful sundog with a ‘tail’. Red light is bent less than blue as it emerges from the ice crystal, tinting the sundog’s inner edge. Blue is bent more and colors the outer half. If you look closely, all colors of the rainbow are seen. Credit: Bob King
Wobbly crystals make for taller sundogs. Like real dogs, ice crystal sundogs can grow tails. These are part of the much larger parhelic circle, a rarely-seen narrow band of light encircling the entire sky at the sun’s altitude formed when millions of both plate and column crystals reflect light from their vertical faces. Short tails extend from each mock sun in the photo above.
About 2 hours after the flying pig image, the sun climbed beyond 50 degrees altitude. The circumscribed halo vanished! Credit: Bob King
There’s almost no end to atmospheric ice antics. Many are rare like the giant 46-degree halo or the 9 and 18-degree halos formed from pyramidal ice crystals. Oftentimes halos are accompanied by arcs or modified arcs as in the flying pig image. When the sun is low, you’ll occasionally see an arc shaped like a bird in flight tangent to the top of the halo and rarely, to its bottom. When the sun reaches an altitude of 29 degrees, these tangent arcs – both upper and lower – change shape and merge into a circumscribed halowrapped around and overlapping the top and bottom of the main halo. At 50 degrees altitude and beyond, the circumscribed halo disappears … for a time. If the clouds persist, you can watch it return when the sun dips below 29 degrees and the two arcs separate again.
Maybe you’re not a halo watcher, but anyone who keeps an eye on the weather and studies the daytime sky in preparation for a night of skywatching can enjoy these icy appetizers.
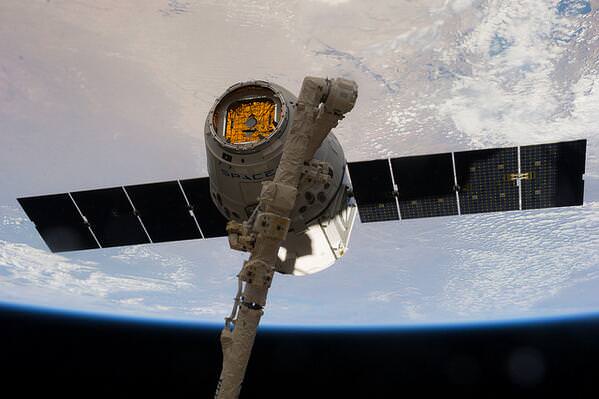
SpaceX-3 Dragon cargo freighter was detached from the ISS at 8 AM ET on May 18, 2014 and released by station crew at 9:26 AM for splashdown in the Pacific Ocean with science samples and cargo. Credit: NASA
SpaceX-3 Dragon commercial cargo freighter was detached from the ISS at 8 AM EDT on May 18, 2014 and released by station crew at 9:26 AM for splashdown in the Pacific Ocean with science samples and cargo. Credit: NASA Story updated[/caption]
The 30 day flight of the SpaceX-3 Dragon commercial cargo freighter loaded with a huge cache of precious NASA science experiments including a freezer packed with research samples ended today with a spectacular departure from the orbiting lab complex soaring some 266 miles (428 km) above Earth.
Update 3:05 PM EDT May 18: SpaceX confirms successful splashdown at 3:05 p.m. EDT today.
“Splashdown is confirmed!! Welcome home, Dragon!”
Robotics officers at Mission Control at NASA’s Johnson Space Center detached Dragon from the Earth-facing port of the Harmony module at 8 a.m. EDT (1300 GMT) this morning, Sunday, May 18, 2014 using the stations Canadian-built robotic arm.
Engineers had earlier unbolted all 16 hooks and latches firmly connecting the vehicle to the station in preparation.
NASA astronaut Steve Swanson then commanded the gum dropped shaped Dragon capsule’s release from Canadarm2 as planned at 9:26 a.m. EDT (1326 GMT) while the pair were flying majestically over southern Australia.
The undocking operation was shown live on NASA TV.
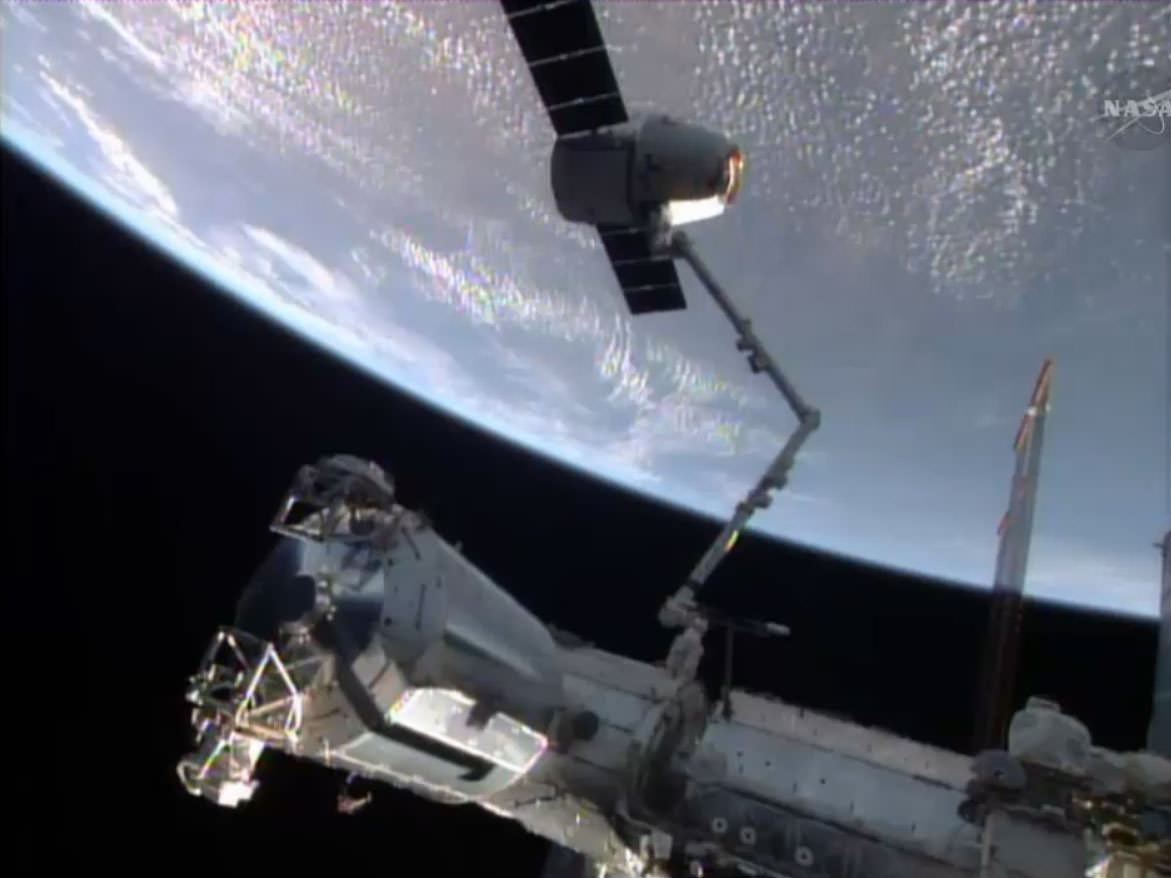
The SpaceX Dragon commercial cargo craft was in the grips of the Canadarm2 before being released for a splashdown in the Pacific Ocean. Credit: NASA
Swanson was assisted by Russian cosmonaut Alexander Skvortsov as the US- Russian team were working together inside the domed Cupola module.
Following the cargo ships release by the 57 foot long arms grappling snares, Swanson carefully maneuvered the arm back and away from Dragon as it moved ever so slowly in free drift mode.
It was already four feet distant within three minutes of release.
Three departure burns by the Dragon’s Draco maneuvering thrusters followed quickly in succession and occurred precisely on time at 9:29, 9:30 and 9:38 a.m. EST.
Dragon exited the 200 meter wide keep out zone – an imaginary bubble around the station with highly restricted access – at the conclusion of the 3rd departure burn.
“The Dragon mission went very well. It was very nice to have a vehicle take science equipment to the station, and maybe some day even humans,” Swanson radioed after the safe and successful departure was completed.
“Thanks to everyone who worked on the Dragon mission.”
The private SpaceX Dragon spent a total of 28 days attached to the ISS.
The six person international crew from Russia, the US and Japan on Expeditions 39 and 40 unloaded some 2.5 tons of supplies aboard and then repacked it for the voyage home.
The SpaceX resupply capsule is carrying back about 3500 pounds of spacewalk equipment, vehicle hardware, science samples from human research, biology and biotechnology studies, physical science investigations and education activities, as well as no longer needed trash.
“The space station is our springboard to deep space and the science samples returned to Earth are critical to improving our knowledge of how space affects humans who live and work there for long durations,” said William Gerstenmaier, associate administrator for human exploration and operations.
“Now that Dragon has returned, scientists can complete their analyses, so we can see how results may impact future human space exploration or provide direct benefits to people on Earth.”
Among the research investigations conducted that returned samples in the cargo hold were an examination of the decreased effectives of antibiotics in space, better growth of plants in space, T-Cell activation in aging and causes of human immune system depression in the microgravity environment.
The 10 minute long deorbit burn took place as scheduled at 2:10 p.m. EDT (1810 GMT) today.
Dragon returned to Earth for a triple parachute assisted splash down today at around 3:02 p.m. EDT (19:02 GMT) in the Pacific Ocean – some 300 miles west of Baja California.
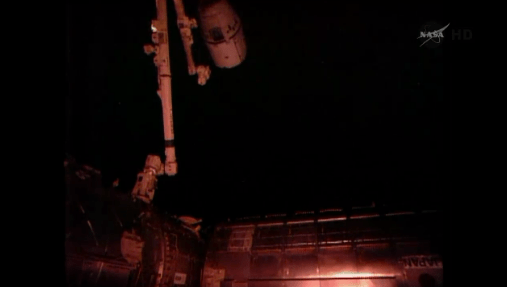
Dragon is free flying after release from ISS at 9:26 a.m. EDT on May 18, 2014. Credit: NASA
It will be retrieved by recovery boats commissioned by SpaceX. The science cargo will be extracted and then delivered to NASA’s Johnson Space Center within 48 hours.
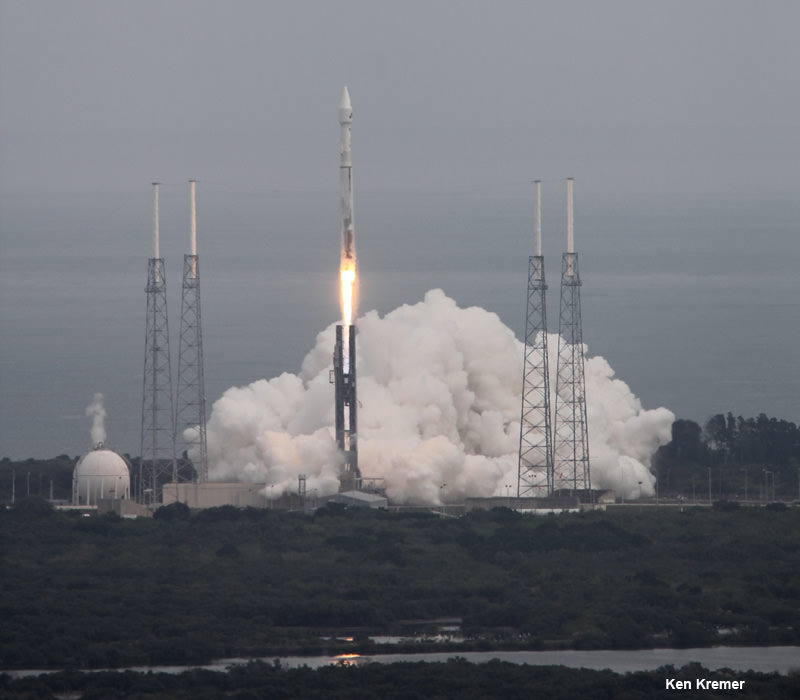
Dragon thundered to orbit atop SpaceX’s powerful new Falcon 9 v1.1 rocket on April 18, from Cape Canaveral, Fla.
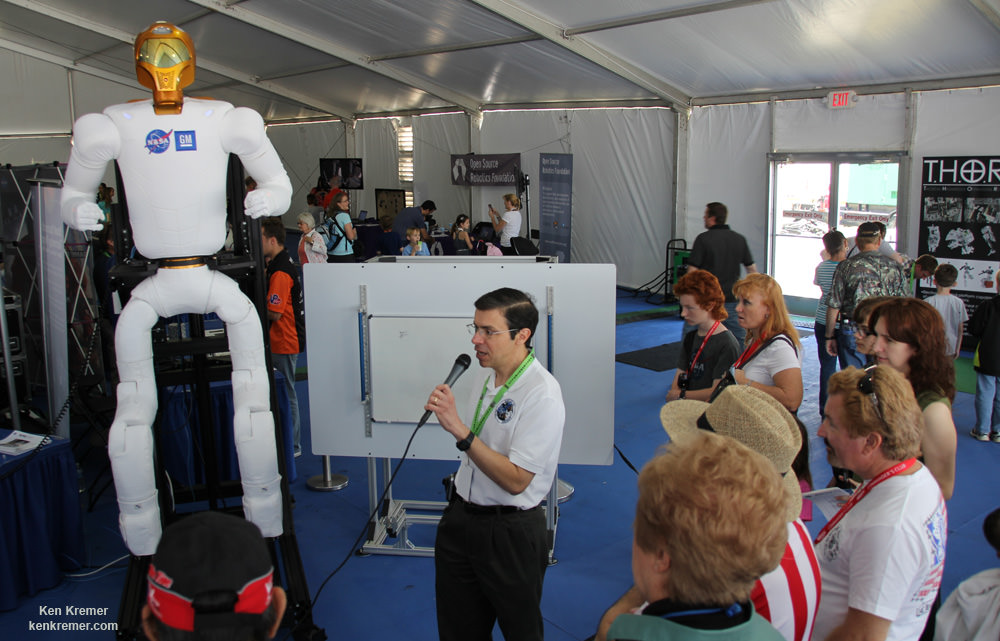
This unmanned Dragon delivered about 4600 pounds of cargo to the ISS including over 150 science experiments, a pair of hi tech legs for Robonaut 2, a high definition Earth observing imaging camera suite (HDEV), the laser optical communications experiment (OPALS), the VEGGIE lettuce growing experiment as well as essential gear, spare parts, crew provisions, food, clothing and supplies to the six person crews living and working aboard in low Earth orbit.
Robonaut 2 engineering model equipped with new legs like those delivered to the ISS on the SpaceX CRS-3 launch were on display at the Kennedy Space Center Visitor Complex on March 15, 2014. Credit: Ken Kremer – kenkremer.com
It reached the ISS on April 20 for berthing.
Dragon is the only unmanned resupply vessel supply that also returns cargo back to Earth.
The SpaceX-3 mission marks the company’s third resupply mission to the ISS under the $1.6 Billion Commercial Resupply Services (CRS) contract with NASA to deliver 20,000 kg (44,000 pounds) of cargo to the ISS during a dozen Dragon cargo spacecraft flights through 2016.
The SpaceX Dragon is among a trio of American vehicles, including the BoeingCST-100 and Sierra Nevada Dream Chaser vying to restore America’s capability to fly humans to Earth orbit and the space station by late 2017, using seed money from NASA’s Commercial Crew Program (CCP) in a public/private partnership. The next round of contracts will be awarded by NASA about late summer 2014.
Another significant milestone was the apparently successful attempt by SpaceX to accomplish a controlled soft landing of the Falcon 9 boosters first stage in the Atlantic Ocean for eventual recovery and reuse. It was a first step in a guided 1st stage soft landing back at the Cape.
The next unmanned US cargo mission to the ISS is set for early morning on June 10 with the launch of the Orbital Sciences Cygnus freighter atop an Antares booster from a launch pad at NASA’s Wallops Flight Facility on the eastern shore of Virginia.
Stay tuned here for Ken’s continuing SpaceX, Orbital Sciences, Boeing, commercial space, Orion, Chang’e-3, LADEE, Curiosity, Mars rover, MAVEN, MOM and more planetary and human spaceflight news.
CORRECTION: This story corrects a previously stated misinterpretation of the NASA Senior Report that the WISE spacecraft itself was denied an extension.
NASA has denied funding to an idea to use NEOWISE image exposures for additional processing for science purposes, according to Amy Mainzer, the deputy project scientist for the Wide-field Infrared Survey Explorer (WISE) at NASA’s Jet Propulsion Laboratory. The project, called MaxWISE, was supposed to run for three years and to use NEOWISE data for other purposes.
“We were hoping it would be possible to combine data from the prime mission, with the NEO mission, to look at
things that vary on different timescales,” Mainzer said in an interview Friday (May 16) with Universe Today.
Its goals would have included measuring the motions and distances for stars and brown dwarfs near the sun, examining variable stars and setting up a “transient detection and alerts program” for certain astronomical phenomena.
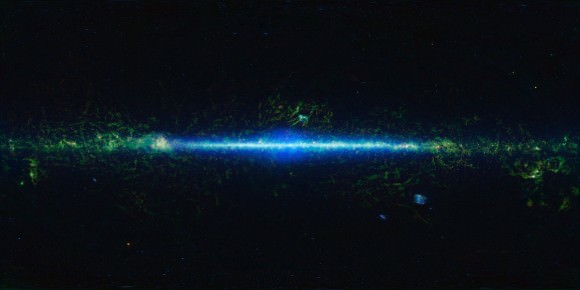
This is a mosaic of the images covering the entire sky as observed by the Wide-field Infrared Survey Explorer (WISE), part of its All-Sky Data Release. Image Credit: NASA/JPL-Caltech/UCLA
In its review, the panel said it was “concerned that the proposed transient detection program would yield little science considering how much it cost”, and approved the program at half of the budgetary levels originally requested. NASA, however, wrote that it would decline the proposal altogether.
“The MaxWISE proposal was recommended for selection by the senior review. However, the only source of funding would be to displace funding from higher rated operating missions in the senior review. Due to constrained budget conditions, the MaxWISE proposal is declined,” NASA wrote in its response.
“It’s tremendously disappointing,” Mainzer said of the decision, adding it is a tough NASA budget environment overall. She is encouraging people to get in touch with their elected representatives if they want to see changes.
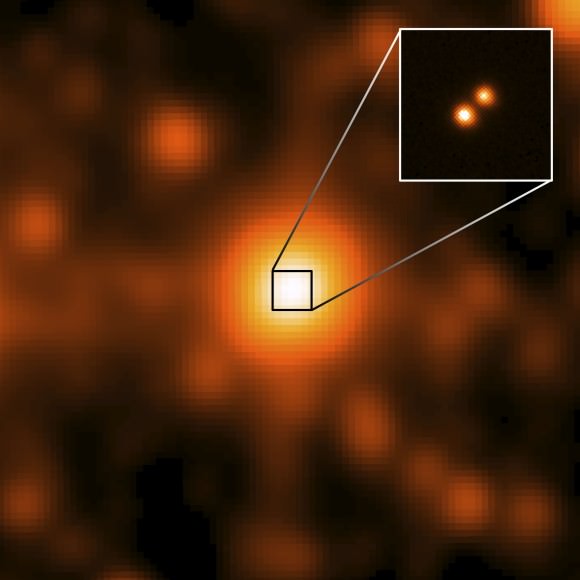
WISE J104915.57-531906 as seen in NASA’s All-WISE survey (centered) and resolved to show its binary nature by the Gemini Observatory (inset). (Credit: NASA/JPL/Gemini Observatory/AURA/NSF).
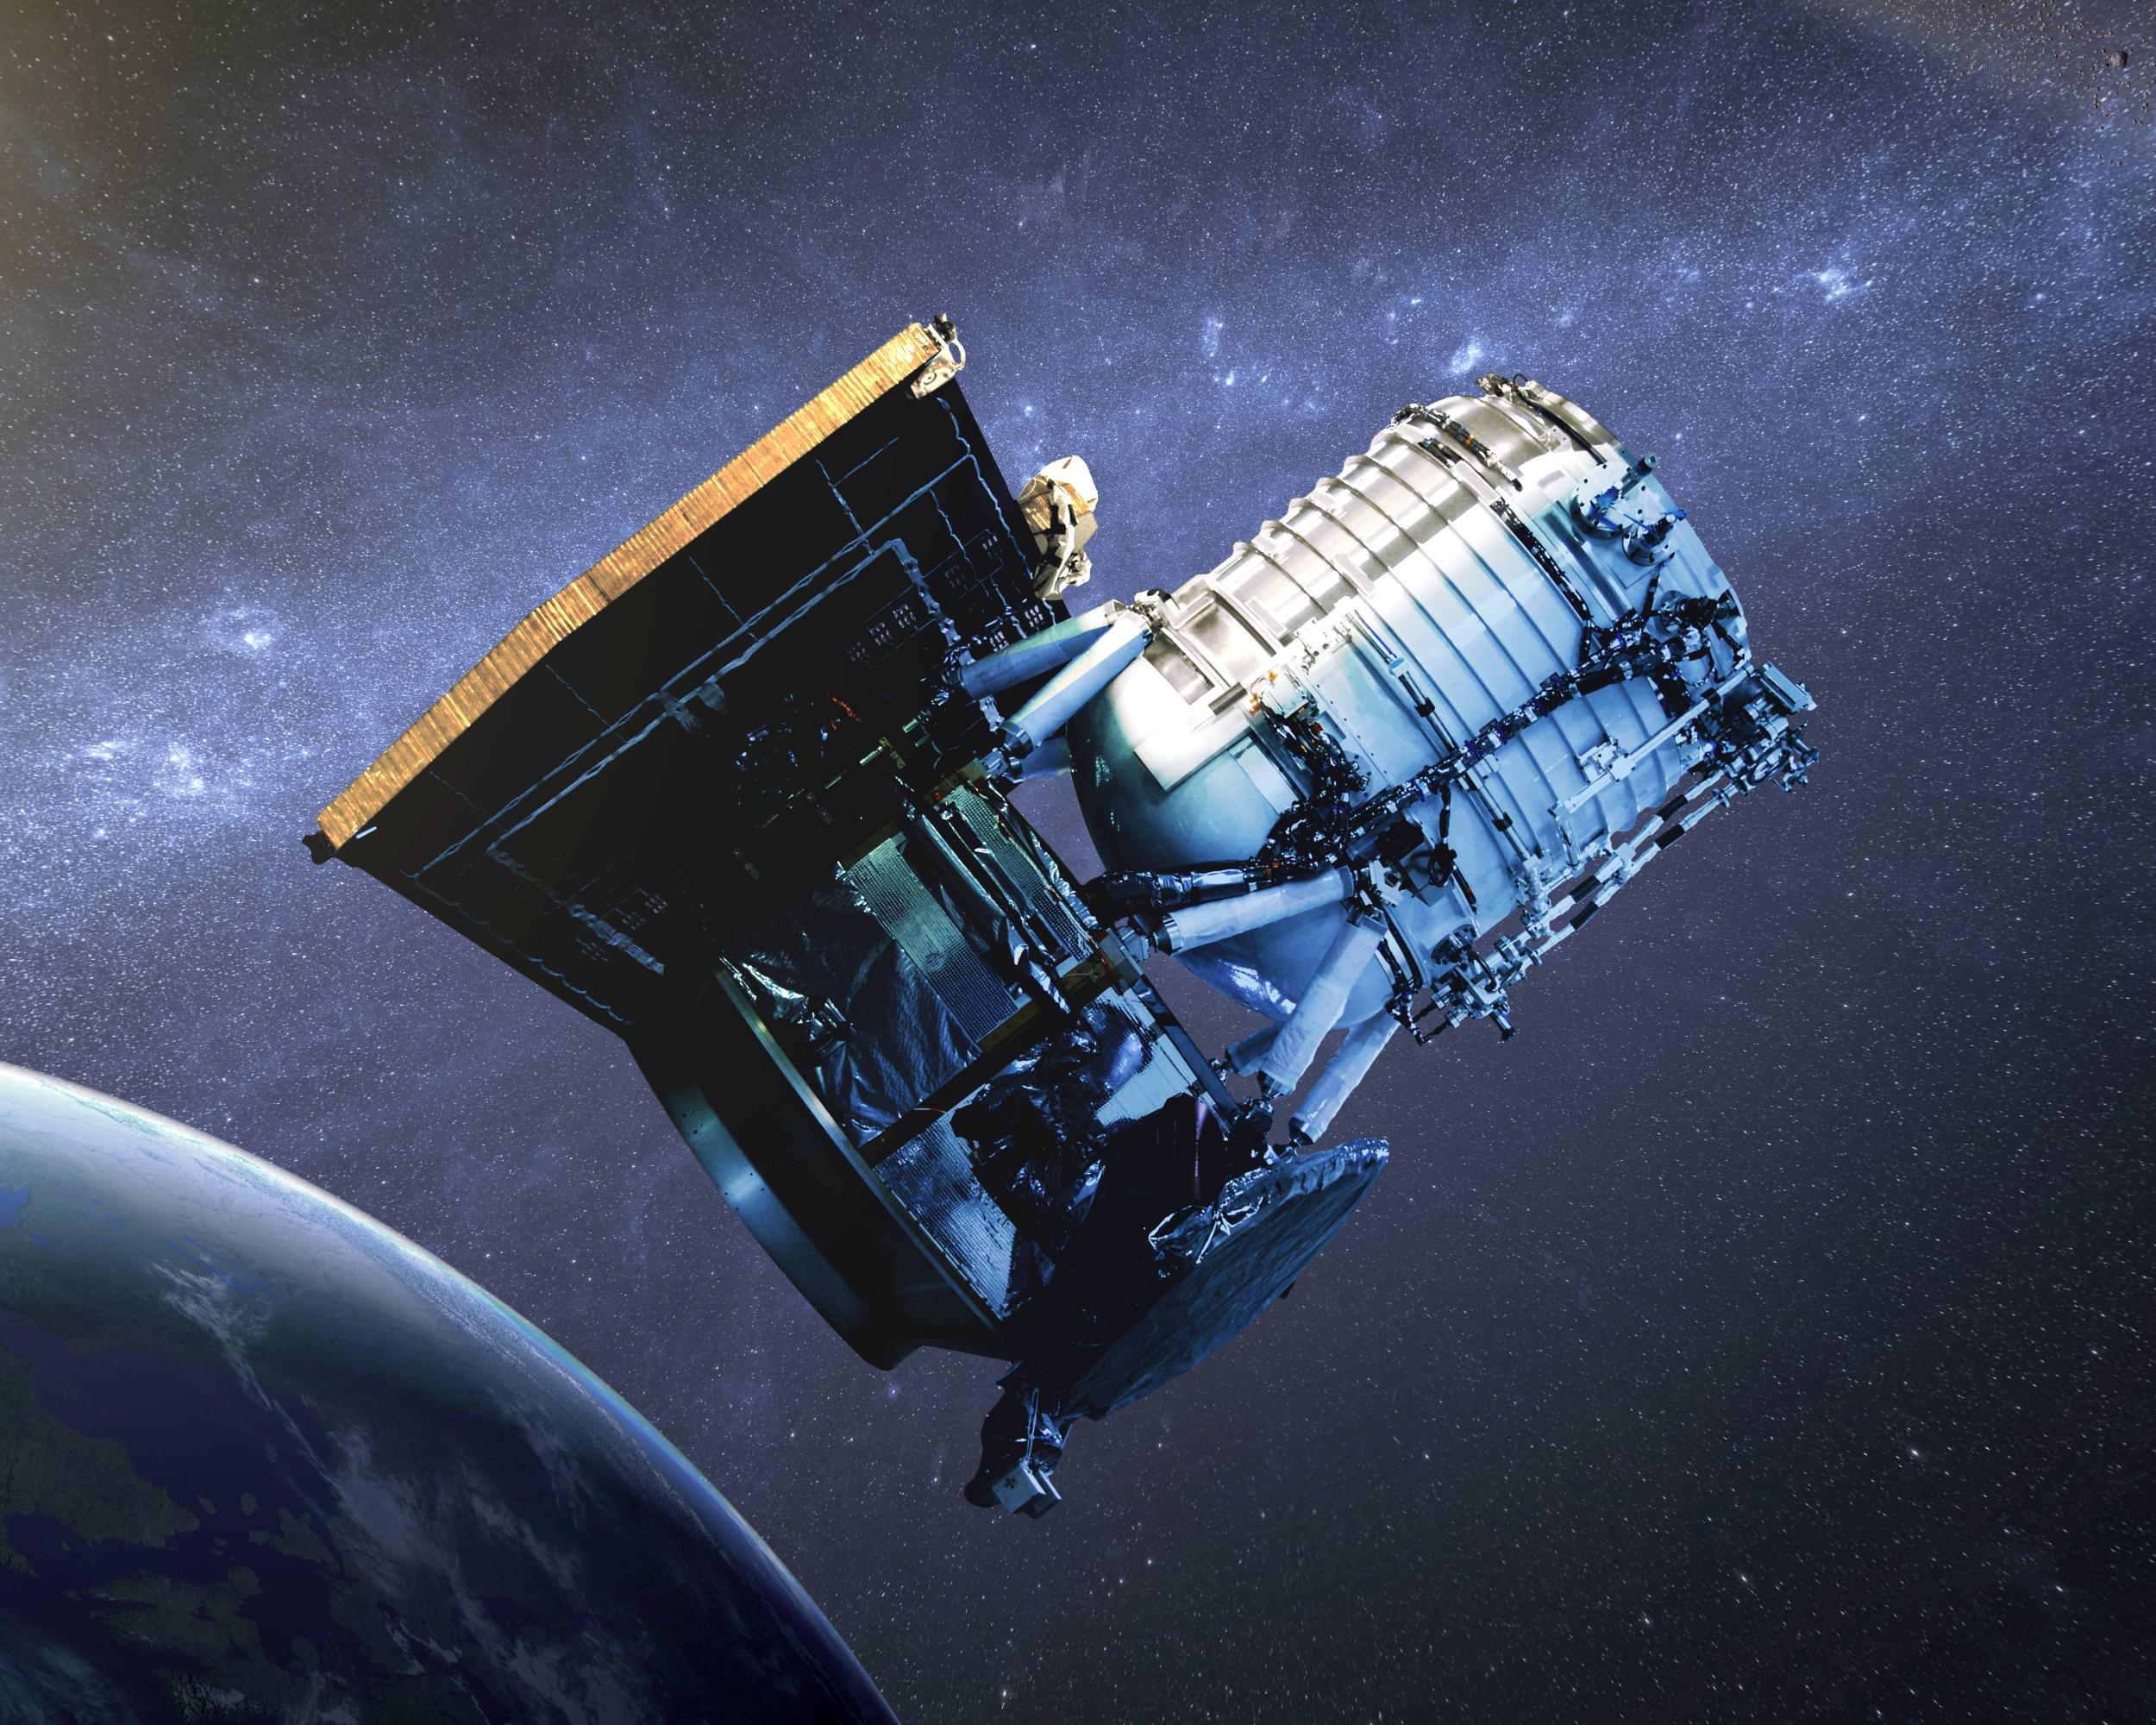
After its launch in 2009 and successful prime mission, WISE was put into hibernation in 2011 before being turned on again last summer to look for asteroids that could pose a threat to Earth, and possibly to participate in NASA’s asteroid mission by looking for a space rock that could be captured and explored.
NEOWISE is expected to run until about 2016 or 2017, depending on how active the Earth’s atmosphere becomes. Since the spacecraft is in a relatively low orbit of 311 miles (500 km), if the sun’s activity increases molecule interactions in the atmosphere and expands it, the spacecraft can be somewhat twisted out of its orbit. Also, more scattering can occur. Both would make it harder for the spacecraft to carry out its mission, Mainzer said.
In the meantime, amateur astronomers can follow along with one of NEOWISE’s recent discoveries: the spacecraft recently found a fairly large near-Earth asteroid, about 1.24 miles to 1.86 miles (2 to 3 km) in size. It’s called 2014 JH 57 and you can get more orbital parameters on it at this page after typing in “2014 JH57” (no quotes) into the search bar.
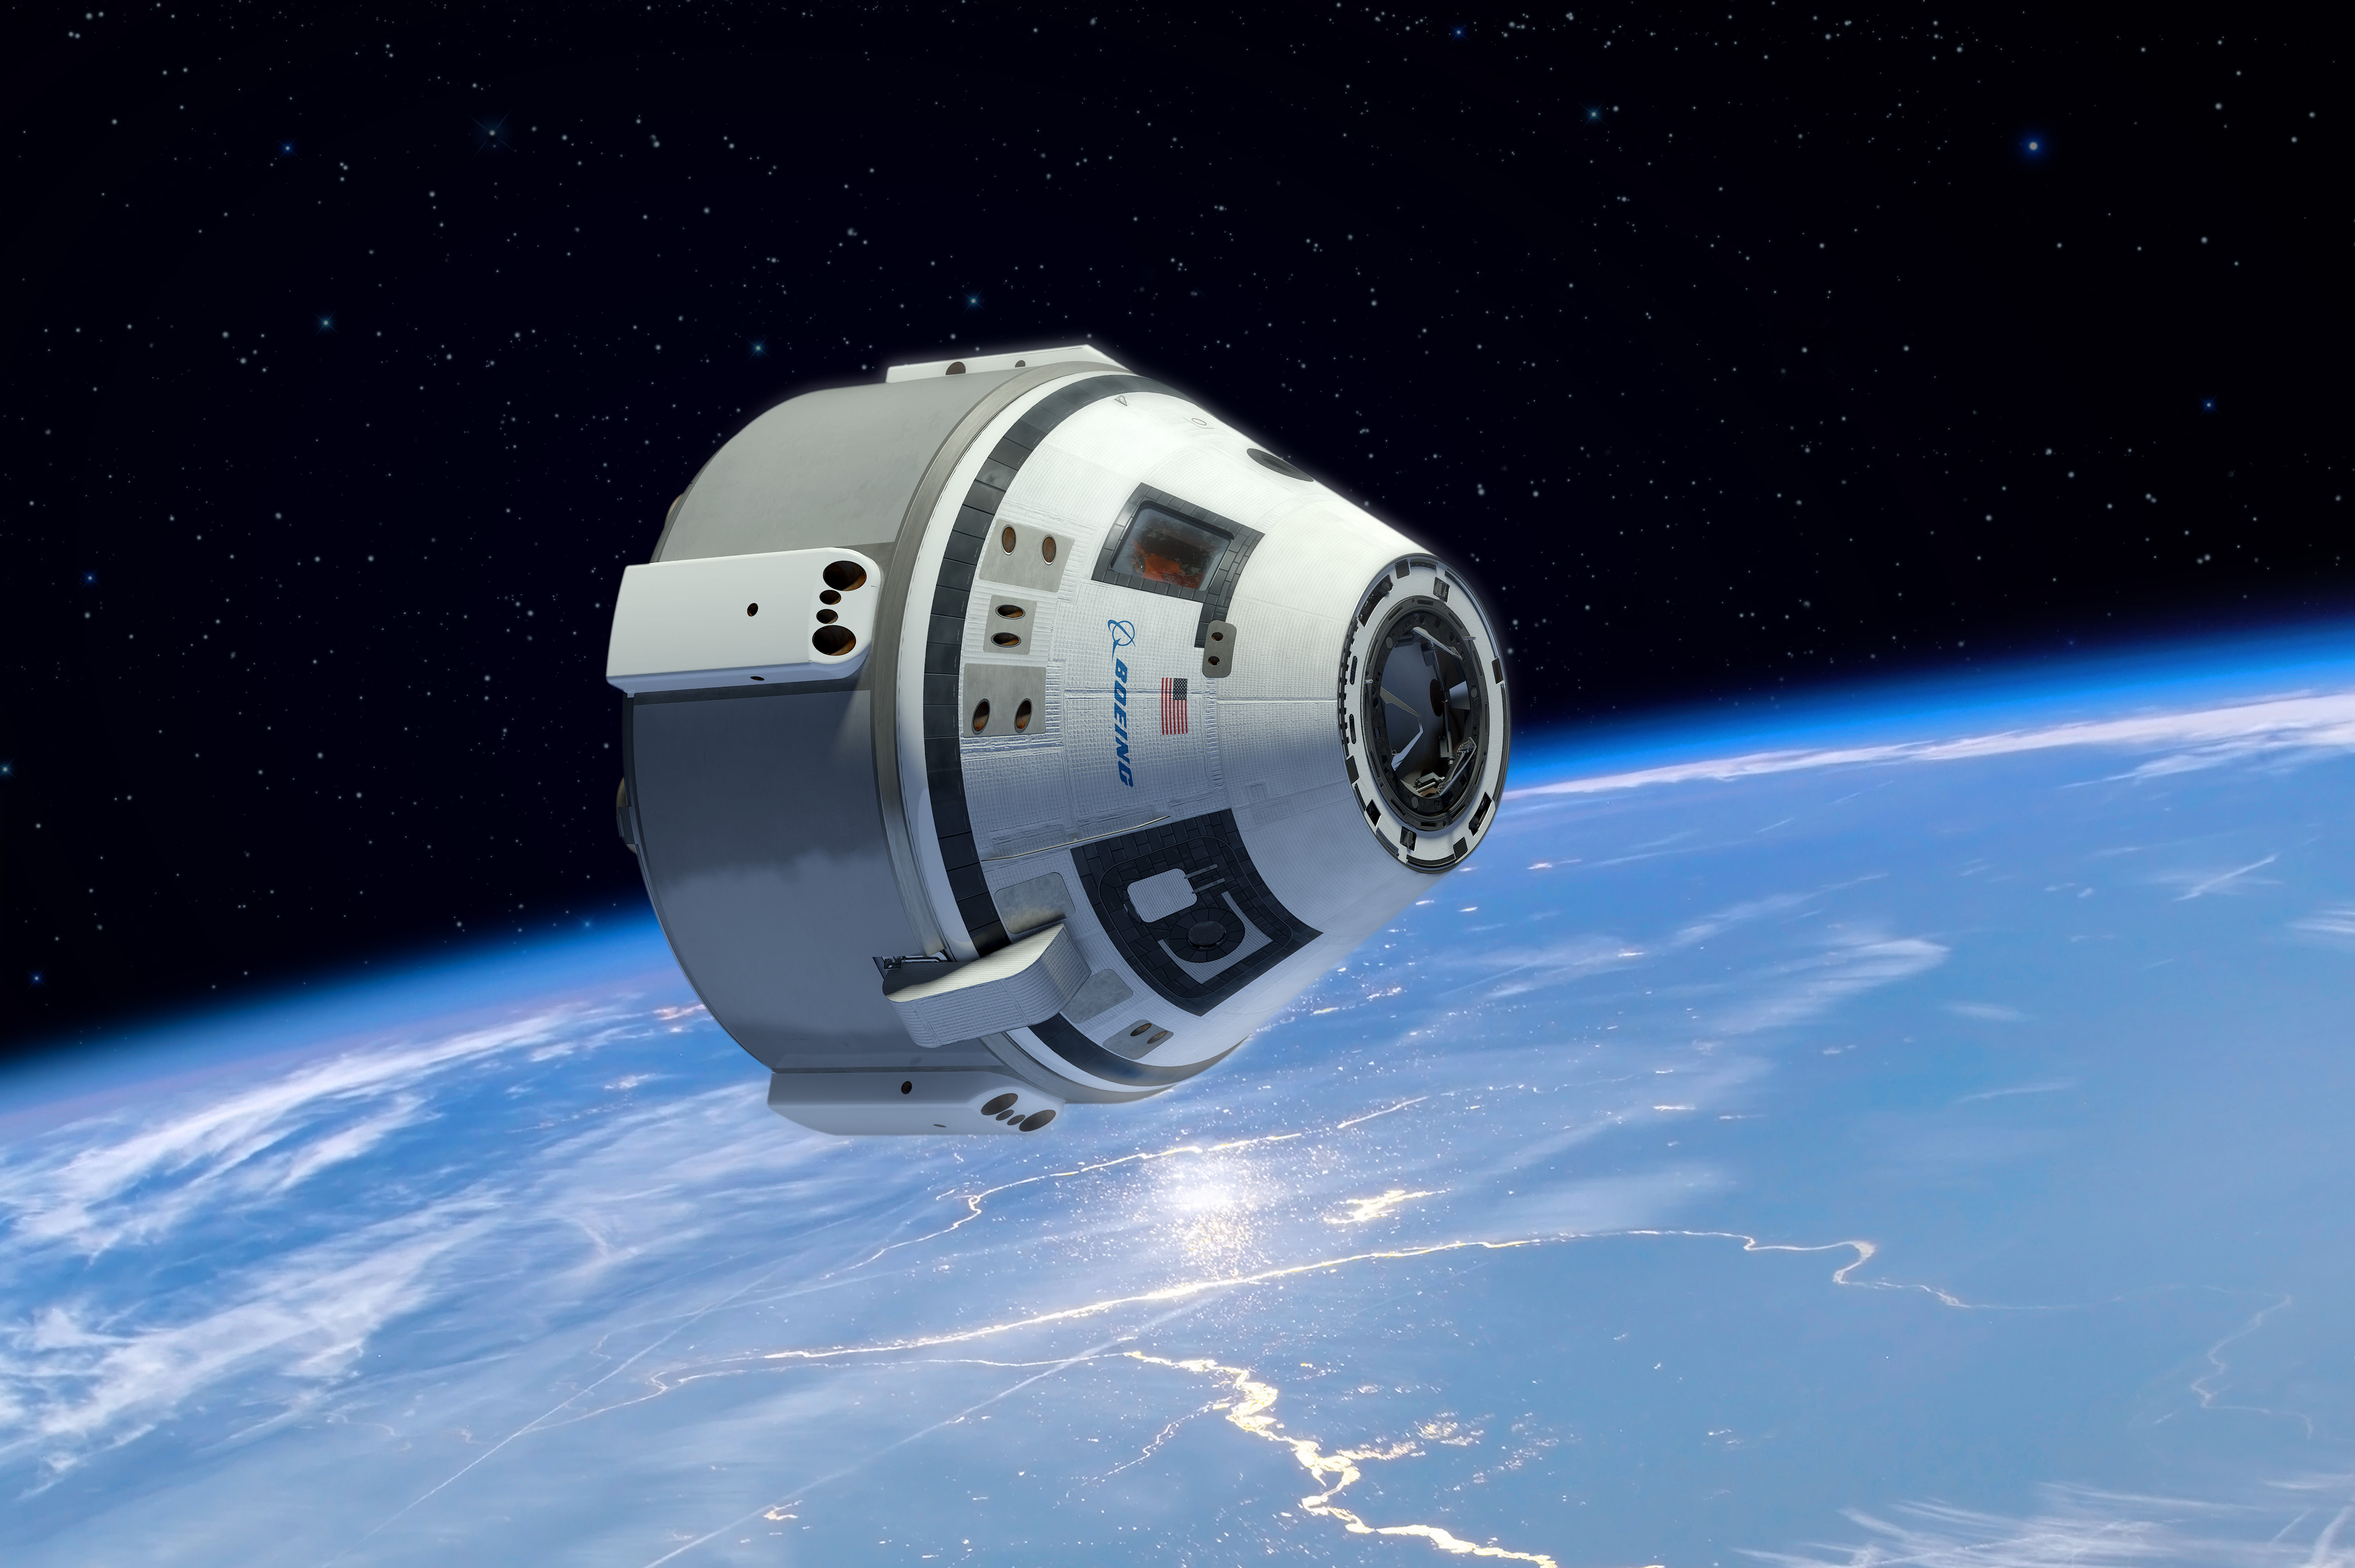
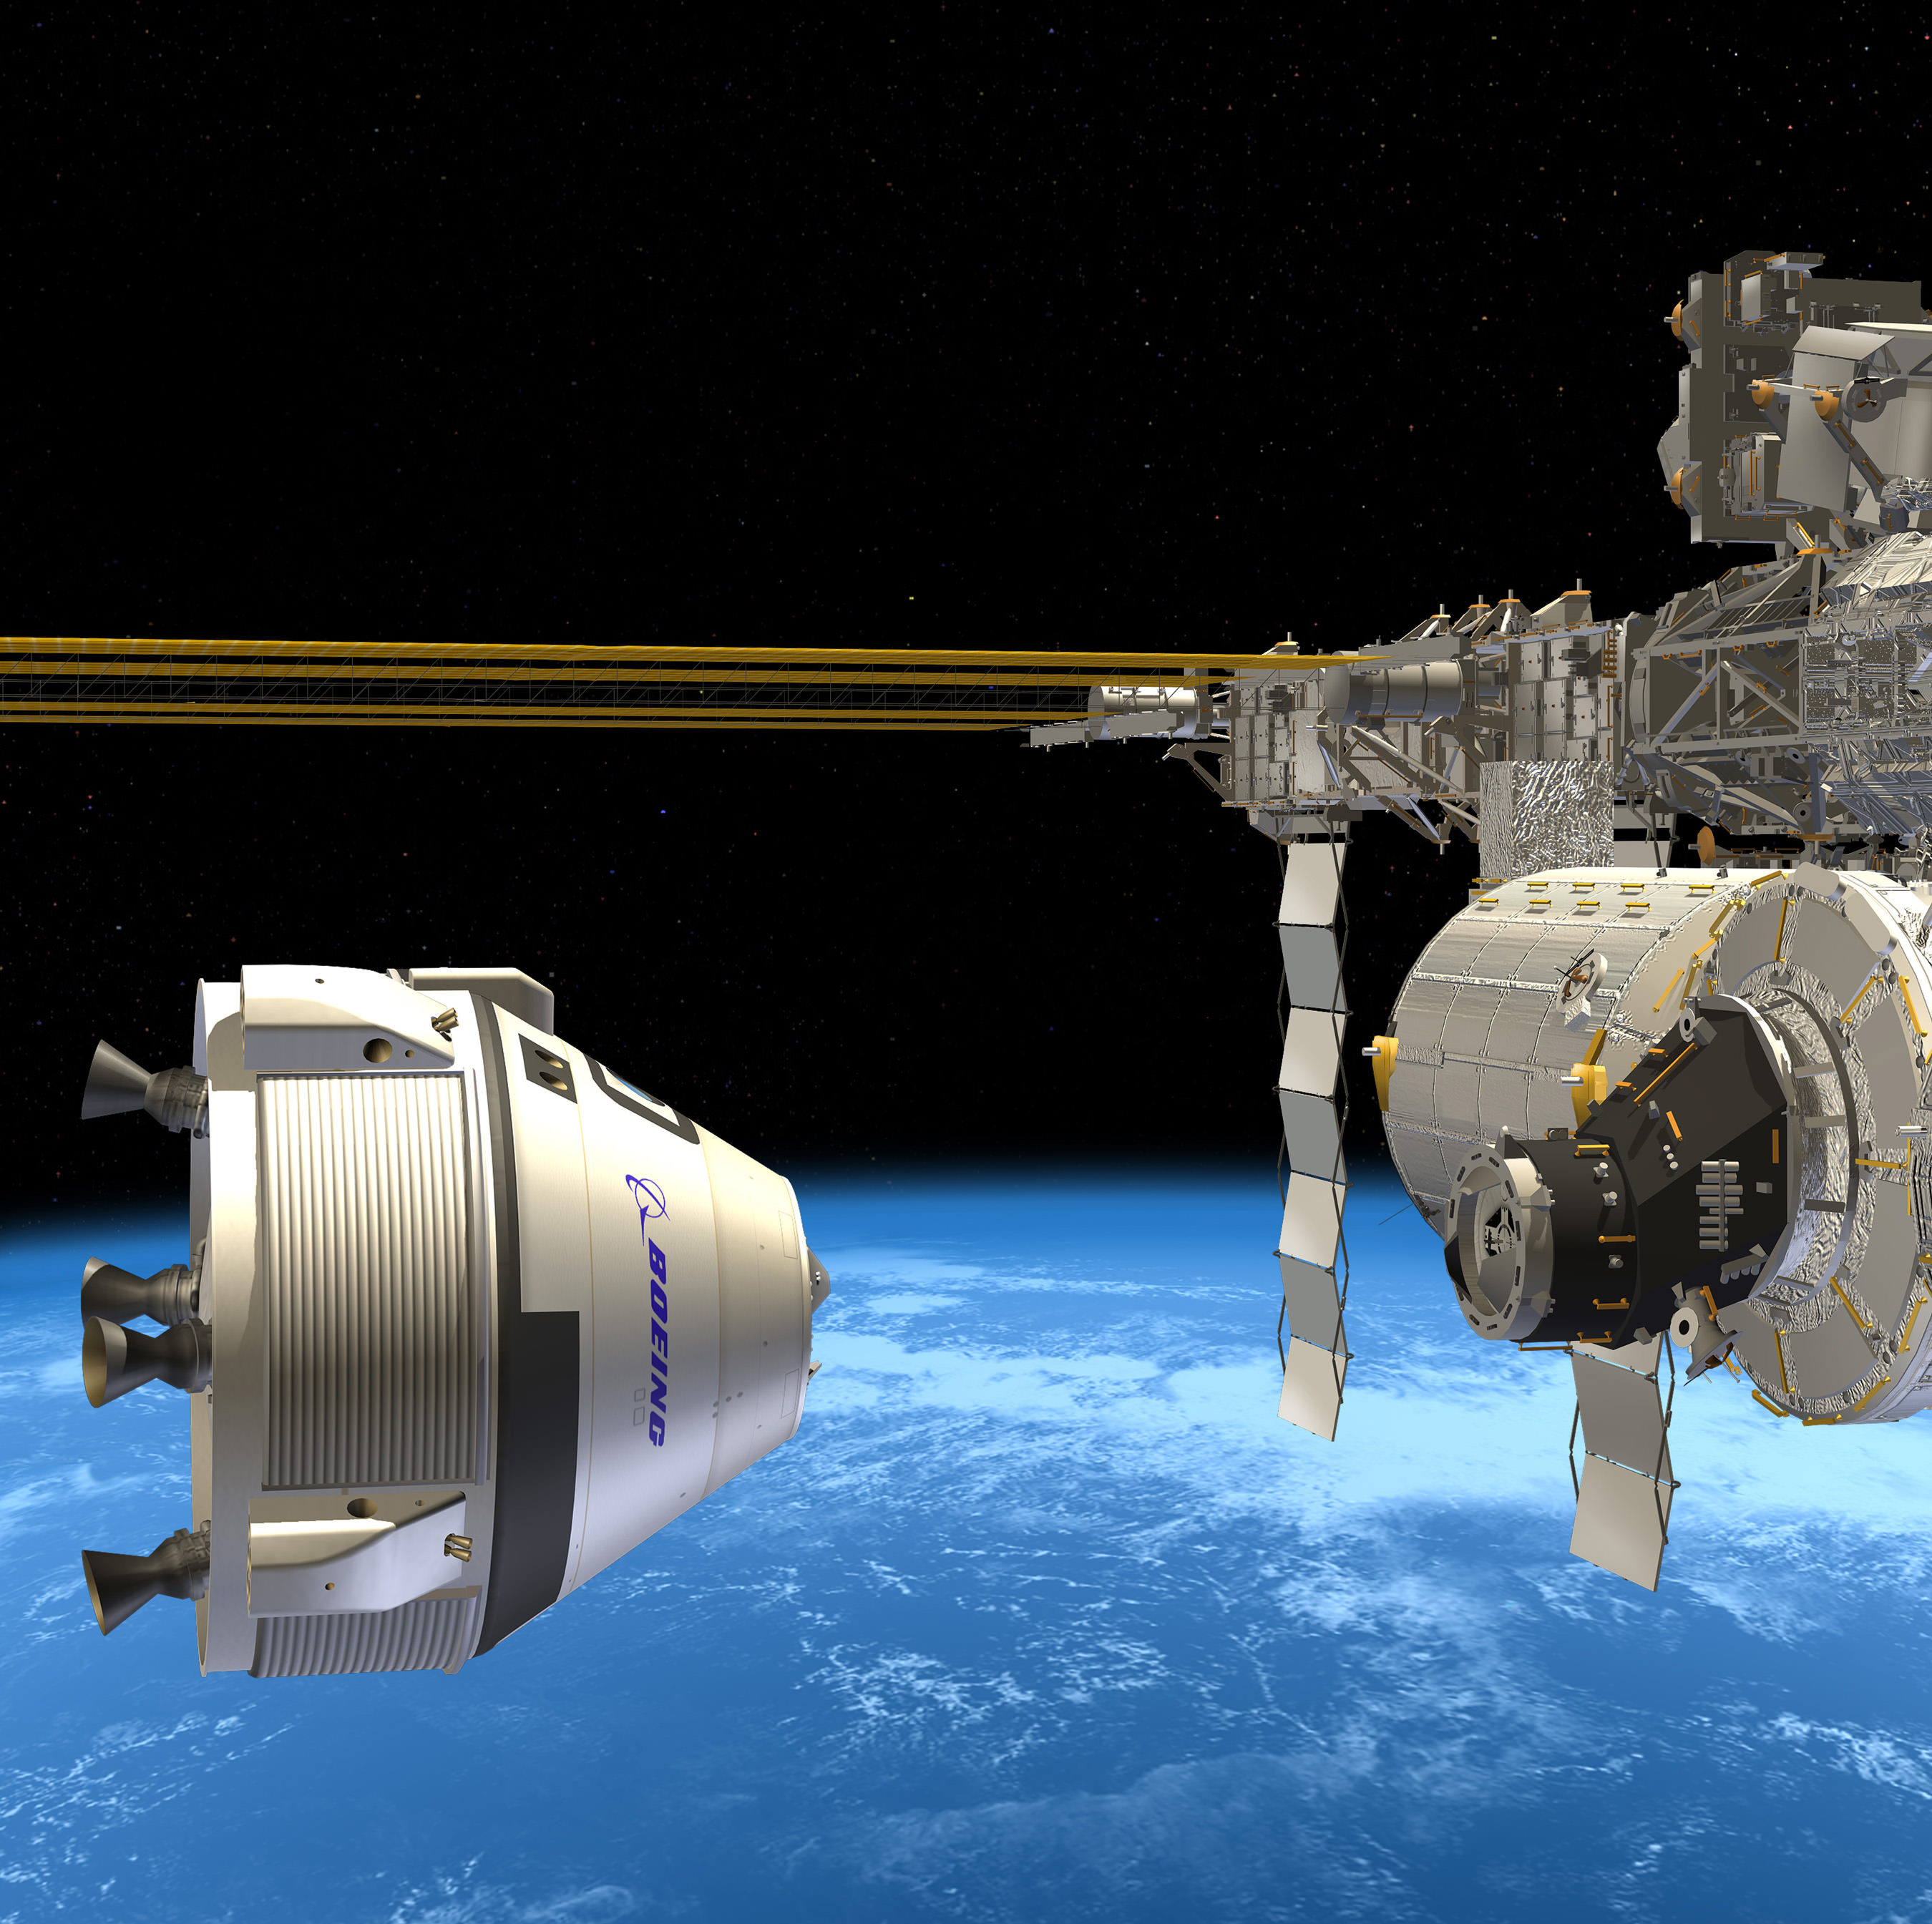
Boeing CST-100 manned space capsule in free flight in low Earth orbit will transport astronaut crews to the International Space Station. Credit: Boeing
Boeing CST-100 manned space capsule in free flight in low Earth orbit will transport astronaut crews to the International Space Station. Credit: Boeing
Story updated[/caption]
KENNEDY SPACE CENTER, FL – Boeing expects to begin “assembly operations of our commercial CST-100 manned capsule soon at the Kennedy Space Center,” Chris Ferguson, commander of NASA’s final shuttle flight and now director of Boeing’s Crew and Mission Operations told Universe Today in an exclusive one-on-one interview about Boeing’s space efforts. In part 1, Ferguson described the maiden orbital test flights to the ISS set for 2017 – here.
In part 2, we focus our discussion on Boeings’ strategy for building and launching the CST-100 ‘space taxi’ as a truly commercial space endeavor.
To begin I asked; Where will Boeing build the CST-100?
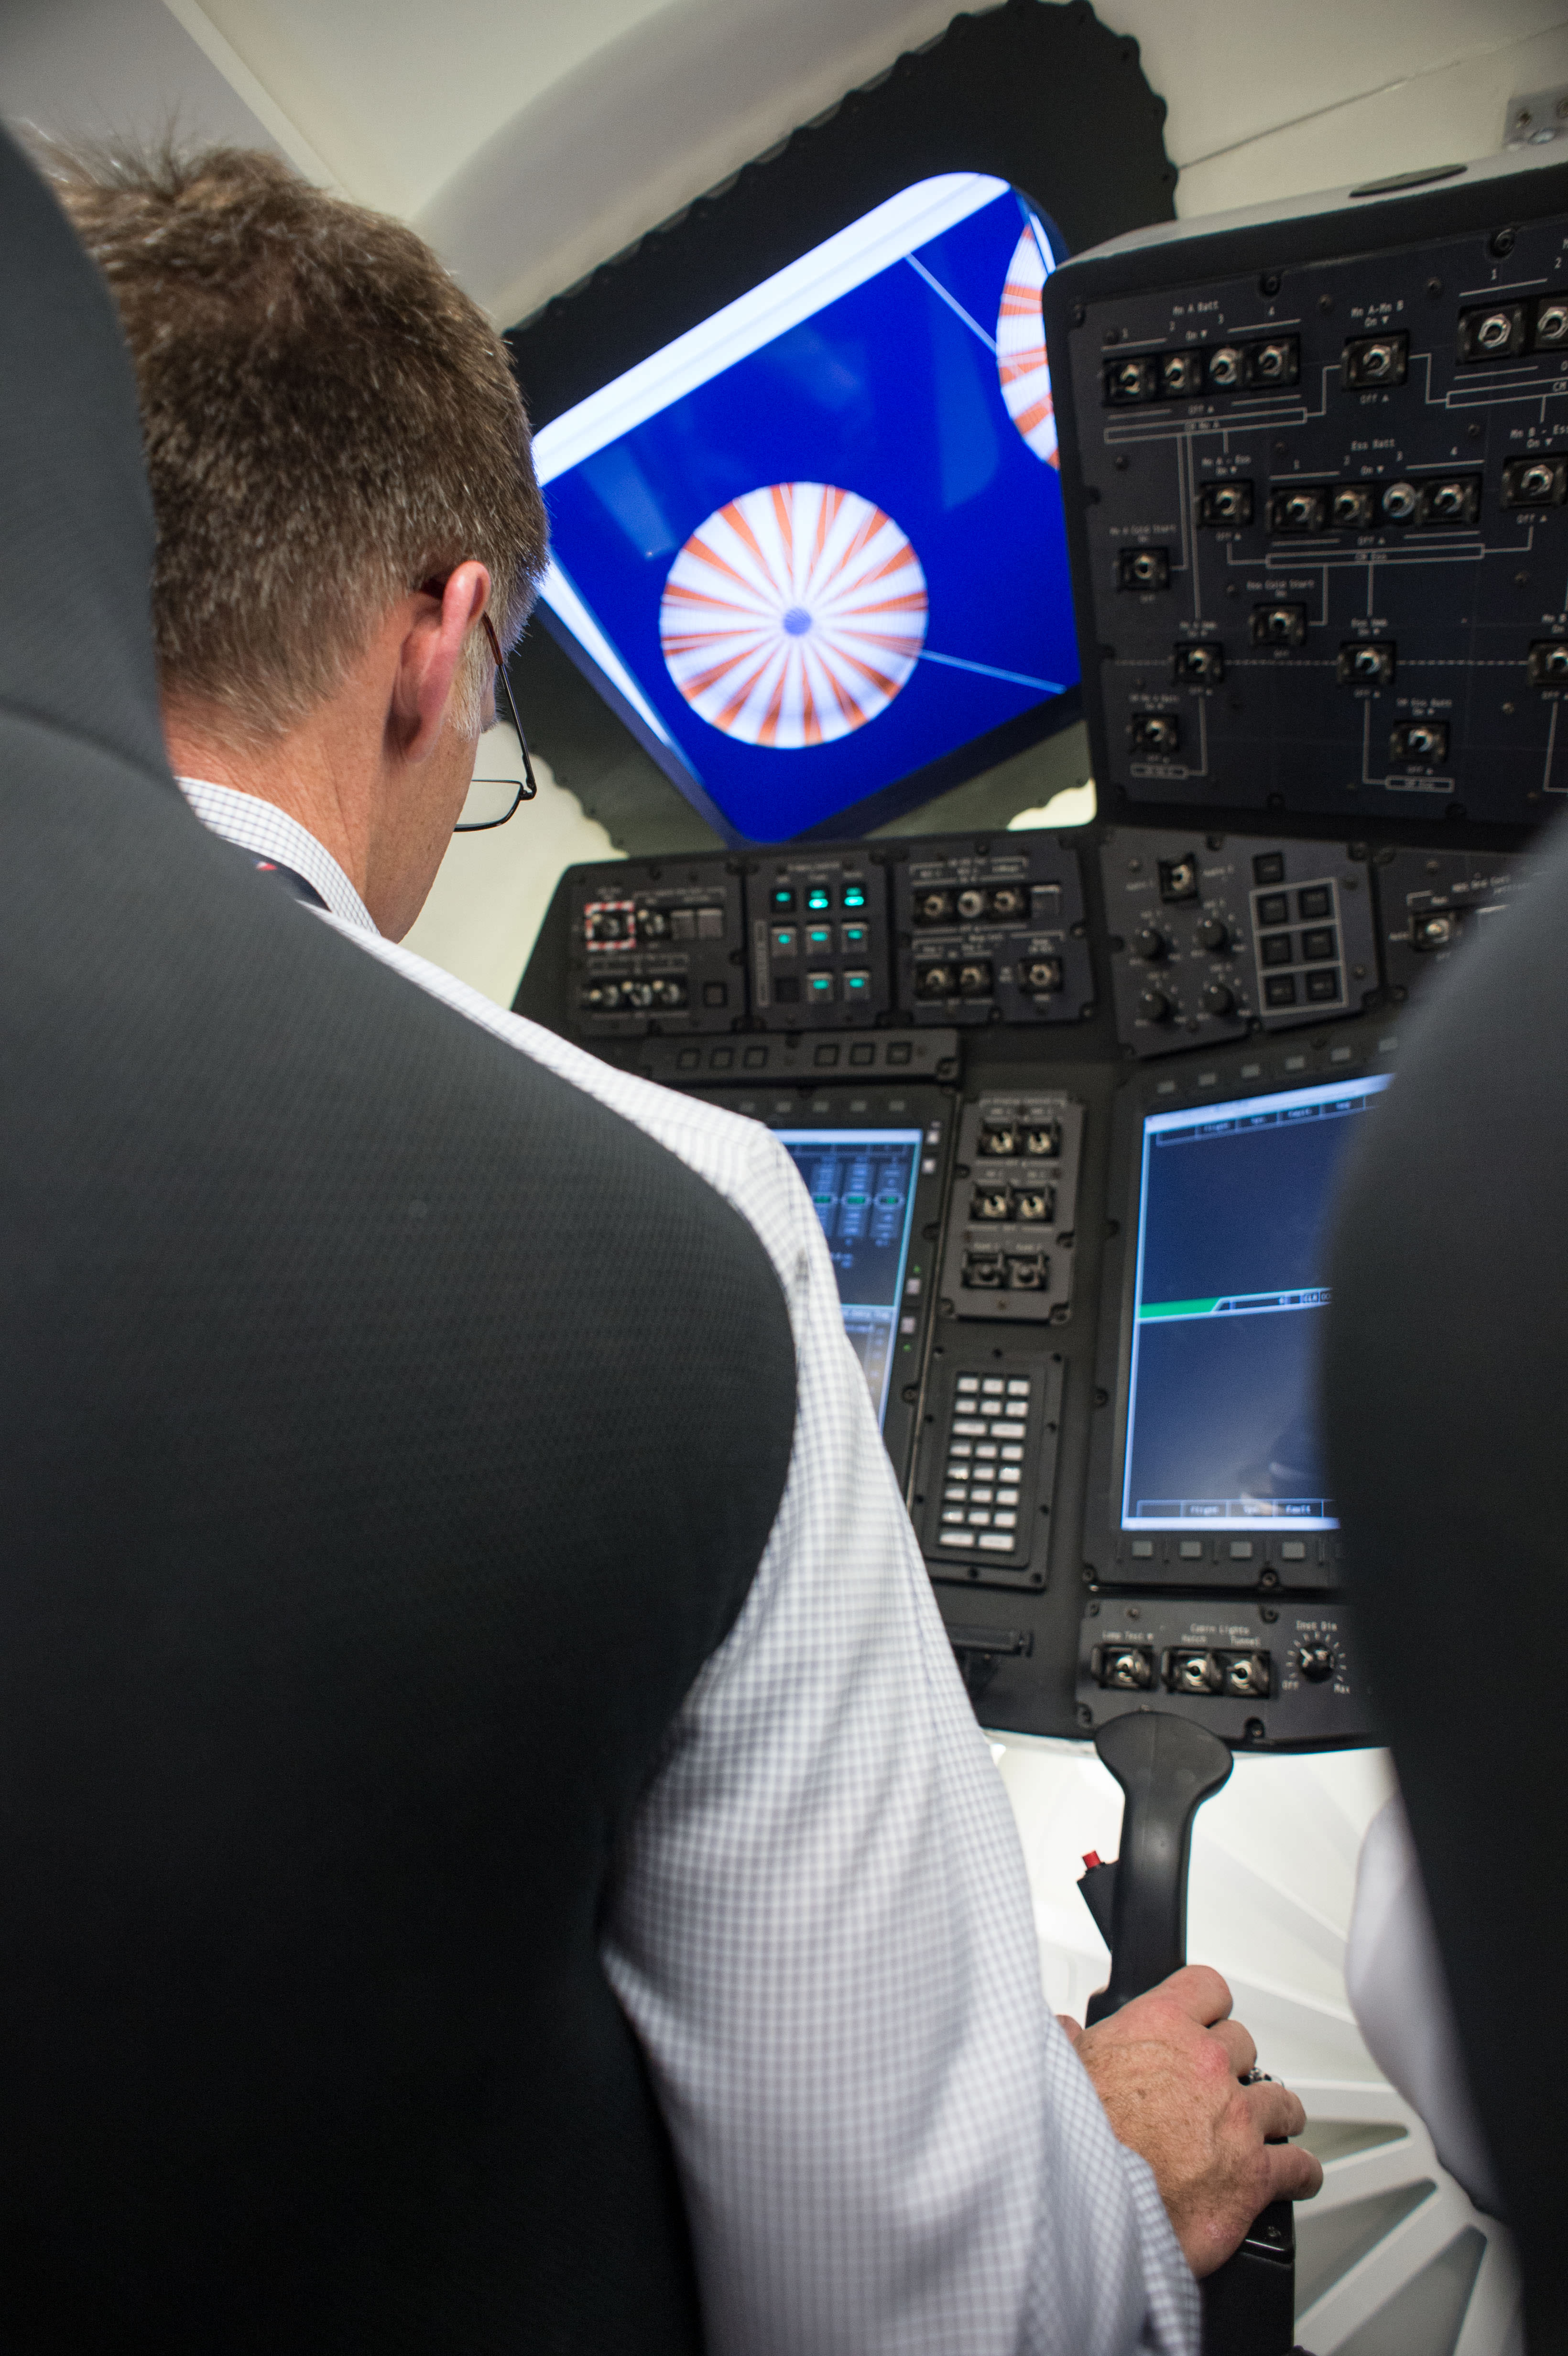
“The CST-100 will be manufactured at the Kennedy Space Center (KSC) in Florida inside a former shuttle hanger known as Orbiter Processing Facility 3, or OPF-3, which is now [transformed into] a Boeing processing facility,” Ferguson told me. “Over 300 people will be employed.” Chris Ferguson, last Space Shuttle Atlantis commander, tests the Boeing CST-100 capsule which may fly US astronauts to the International Space Station in 2017. Ferguson is now Boeing’s director of Crew and Mission Operations for the Commercial Crew Program vying for NASA funding. Credit: NASA/Boeing
During the shuttle era, all three of NASA’s Orbiter Processing Facilities (OPFs) were a constant beehive of activity for thousands of shuttle workers busily refurbishing the majestic orbiters for their next missions to space. But following Ferguson’s final flight on the STS-135 mission to the ISS in 2011, NASA sought new uses for the now dormant facilities.
So Boeing signed a lease for OPF-3 with Space Florida, a state agency that spent some $20 million modernizing the approximately 64,000 square foot hanger for manufacturing by ripping out all the no longer needed shuttle era scaffolding, hardware and equipment previously used to process the orbiters between orbital missions.
Boeing takes over the OPF-3 lease in late June 2014 following an official handover ceremony from Space Florida. Assembly begins soon thereafter.
“The pieces are coming one by one from all over the country,” Ferguson explained. “Parts from our vendors are already starting to show up for our test article.
“Assembly of the test article in Florida starts soon.”
The CST-100 is being designed at Boeing’s Houston Product Support Center in Texas.
It is a reusable capsule comprised of a crew and service module that can carry a mix of cargo and up to seven crew members to the International Space Station (ISS) and must meet stringent safety and reliability standards.
How will the pressure vessel be manufactured? Will it involve friction stir welding as is the case for NASA’s Orion deep space manned capsule?
“There are no welds,” he informed.
“The pressure vessel is coming from Spincraft, an aerospace manufacturing company in Massachusetts.”
Spincraft has extensive space vehicle experience building tanks and assorted critical components for the shuttle and other rockets.
“The capsule is produced by Spincraft using a weld-free process. It’s made as a single piece by a proprietary spun form process and machined out from a big piece of metal.”
The capsule measures approximately 4.56 meters (175 inches) in diameter.
“The service module will be fabricated in Florida.”
The combined crew and service modules are about 5.03 meters (16.5 feet) in length.
“In two years in 2016, our CST-100 will look like the Orion EFT-1 capsule does now at KSC, nearly complete [and ready for the maiden test flight]. Orion is really coming along,” Ferguson beamed while contemplating a bright future for US manned spaceflight.
He is saddened that it’s been over 1000 days since his crew’s landing inside shuttle Atlantis in July 2011.
Early version of Boeing CST-100 pressure vessel mockup inside OPF-3 and surrounded by shuttle era scaffolding at the Kennedy Space Center, FL. Credit: Ken Kremer – kenkremer.com
With Boeing’s long history in aircraft and aerospace manufacturing, the CST-100 is being designed and built as a truly commercial endeavor.
Therefore the spacecraft team is able to reach across Boeing’s different divisions and diverse engineering spectrum and draw on a vast wealth of in-house expertise, potentially giving them a leg up on commercial crew competitors like SpaceX and Sierra Nevada Corp.
Nevertheless, designing and building a completely new manned spaceship is a daunting task for anyone. And no country or company has done it in decades.
How hard has this effort been to create the CST-100? – And do it with very slim funding from NASA and Boeing.
“Well any preconceived notion I had on building a human rated spacecraft has been completely erased. This is really hard work to build a human rated spacecraft!” Ferguson emphasized.
“And the budget is very small – without a lucrative government contract as used in the past to build these kind of spacecraft.”
“Our budget now is an order of magnitude less than to build the shuttle – which was about $35 to $42 Billion in 2011 dollars. The budget is a lot less now.”
Read more about the travails of NASA’s commercial crew funding situation in Part 1.
The team size now is just a fraction of what it was for past US crewed spaceships.
“So to support this we have a pretty small team.”
“The CST-100 team of a couple hundred folks works very hard!”
“For comparison, the space shuttle had 30,000 people working on it at the peak. By early 2011 there were 11,000. We flew on STS-135 with only 4,000 people in July 2011.”
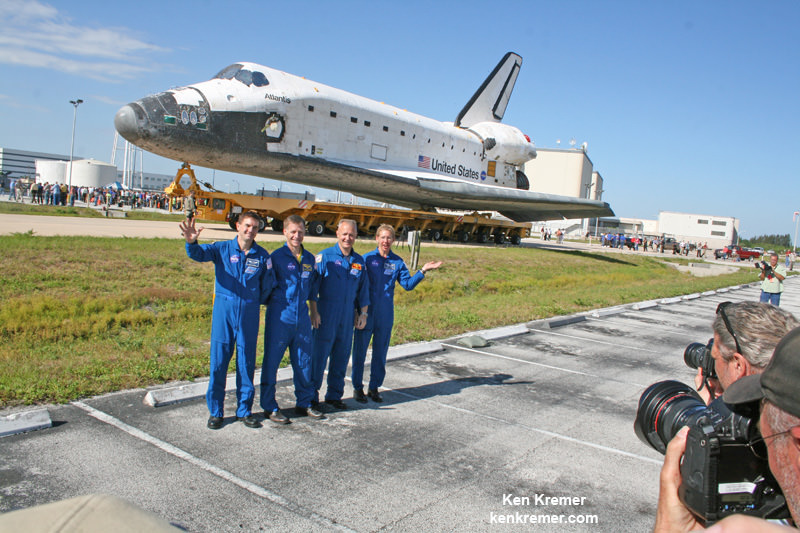
NASA’s final shuttle crew on STS-135 mission greets the media and shuttle workers during Atlantis rollover from the OPF-1 processing hanger to the VAB at KSC during May 2011. From left: Rex Walheim, Shuttle Commander Christopher Ferguson, Douglas Hurley and Sandra Magnus. The all veteran crew delivered the Raffaello multipurpose logistics module (MPLM), science supplies, provisions and space parts to the International Space Station (ISS).
Credit: Ken Kremer – kenkremer.com
Boeing’s design philosophy is straightforward; “It’s a simple ride up to and back from space,” Ferguson emphasized to me.
Next we turned to the venerable Atlas V rocket that will launch Boeing’s proposed space taxi. But before it can launch people it must first be human rated, certified as safe and outfitted with an Emergency Detection System (EDS) to save astronauts lives in a split second in case of a sudden and catastrophic in-flight anomaly.
The CST-100 crew capsule awaits liftoff aboard an Atlas V launch vehicle at Cape Canaveral in this artist’s concept. Credit: Boeing
United Launch Alliance (ULA) builds the two stage Atlas V and is responsible for human rating the vehicle which has a virtually unblemished launch record of boosting a wide array of advanced US military satellites and NASA’s precious one-of-a-kind robotic science explorers like Curiosity, JUNO, MAVEN and MMS on far flung interplanetary voyages of discovery.
What modifications are required to man rate the Atlas V to launch humans on Boeing’s CST-100?
“We will launch on an Atlas V that’s being retrofitted to meet NASA’s NPR human rating standards for redundancy and the required levels of fault tolerance,” Ferguson explained.
“So the rocket will have all the safety NASA wants when it flies humans.”
“Now with the CST-100 you can do all that in a smaller package [compared to shuttle].”
“The Atlas V will also be modified by ULA to include an Emergency Detection System (EDS). It’s a system not unlike what Apollo and Gemini had, which was much more rudimentary but quite evolved for its day.”
“Their EDS would monitor critical parameters like pitch, roll, yaw rates, critical engine parameters. It measures the time to criticality. You know the time to criticality for certain failures is so short that they didn’t think humans could react to it in time. So it was essentially automated.”
“So if it [EDS] sensed large pitch or yaw excursions, it would self jettison. And the escape system would kick in automatically.”
The Atlas V is already highly reliable. The EDS is one of the few systems that had to be added for human flights?
“Yes.”
“We also wanted a better abort system performance to go with the two engine Centaur upper stage we elected to use instead of the single engine Centaur.”
The purpose is to shut down the Centaur engine firing [in an emergency].”
“The two engine Centaur has flown many times. But it has never flown on an Atlas V. So there is a little bit of recertification and qualification to be done by ULA to go along with that also.”
Does that require a lot of work?
“ULA doesn’t seem to think the work to be done is all that significant. There is some work to be done.”
So it’s not a showstopper. Can ULA meet your 2017 launch schedule?
“Yes.”
“Before an engine fails it vibrates. So when you talk about automated ‘Red Lines’ you have to be careful that first you “Do No Harm” – and not make the situation even worse.”
“So we’ll see how ULA does building this,” Ferguson stated.
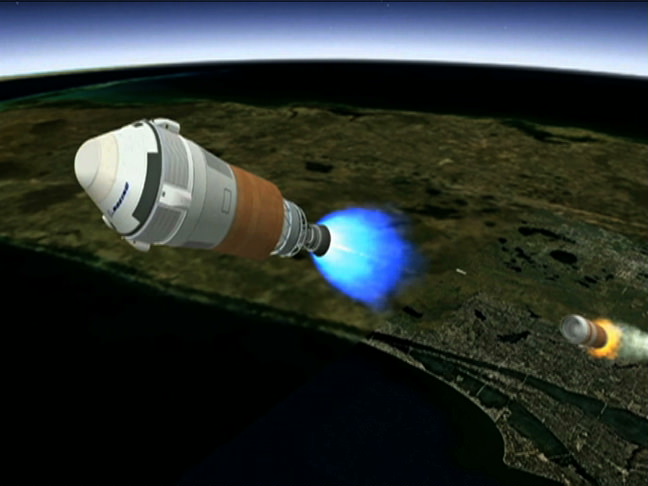
Artist’s concept shows Boeing’s CST-100 spacecraft separating from the first stage of its launch vehicle, a United Launch Alliance Atlas V rocket, following liftoff from Cape Canaveral Air Force Station in Florida. Credit: Boeing
The future of the CST-100 project hinges on whether NASA awards Boeing a contract to continue development and assembly work in the next round of funding (dubbed CCtCAP) from the agency’s Commercial Crew Program (CCP). The CCP seed money fosters development of a safe, reliable and new US commercial human spaceship to low Earth orbit as a public/private partnership.
NASA’s announcement of the CCP contract winners is expected around late summer 2014.
Based on my discussions with NASA officials, it seems likely that the agency could select at least two winners to move on – to spur competition and thereby innovation – from among the trio of American aerospace firms competing.
Besides Boeing’s CST-100, the SpaceXDragon and Sierra Nevada Dream Chaser vehicles are also in the running for the contract to restore America’s capability to fly humans to Earth orbit and the International Space Station (ISS) by 2017.
In Part 3 we’ll discuss with Chris Ferguson the requirements for how many and who will fly aboard the CST-100 and much more. Be sure to read Part 1 here.
Early version of Boeing CST-100 capsule mock-up, interior view. Credit: Ken Kremer – kenkremer.com
Stay tuned here for Ken’s continuing Boeing, SpaceX, Orbital Sciences, commercial space, Orion, Curiosity, Mars rover, MAVEN, MOM and more planetary and human spaceflight news.
Ken’s upcoming presentation: Mercy College, NY, May 19: “Curiosity and the Search for Life on Mars” and “NASA’s Future Crewed Spaceships.”
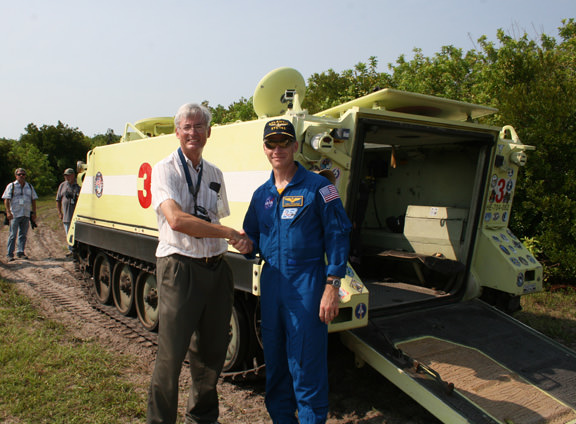
Boeing CST-100 space taxi launch atop Atlas V booster will resemble this photo of NASA’s Mars bound MAVEN spacecraft launched by Atlas V from Space Launch Complex 41 at Cape Canaveral Air Force Station on Nov. 18, 2013. Image taken from the roof of the Vehicle Assembly Building (VAB) at NASA’s Kennedy Space Center. Credit: Ken Kremer/kenkremer.comBoeing CST-100 crew vehicle docks at the ISS. Credit: BoeingSTS-135 Shuttle Commander Chris Ferguson (right) and Ken Kremer (Universe Today) meet at emergency M-113 Tank Practice during crew pre-launch events at the Kennedy Space Center in the weeks before Atlantis July 8, 2011 liftoff. Credit: Ken Kremer- kenkremer.com
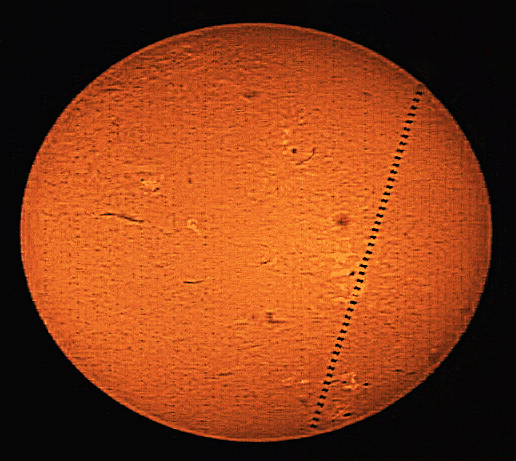
A mosaic of 46 images showing the transit of the ISS across the sun visible from southwest London on May 16, 2014 at 06:23 UT. Credit and copyright: Roger Hutchinson.
“I’ve been wanting to get one of these for ages!” said astrophotographer Roger Hutchinson from London, England. This awesome image of the International Space Station transiting across the Sun earlier today — which creates a “zipper”-like effect on the Sun’s surface – is a composite of 46 images, taken from Southwest SW London on May 16, 2014 at 06:23 UT. Roger used a Lunt LS60 Ha telescope and a Skyris 274C camera.
Amazing.
Want to get your astrophoto featured on Universe Today? Join our Flickr group or send us your images by email (this means you’re giving us permission to post them). Please explain what’s in the picture, when you took it, the equipment you used, etc.
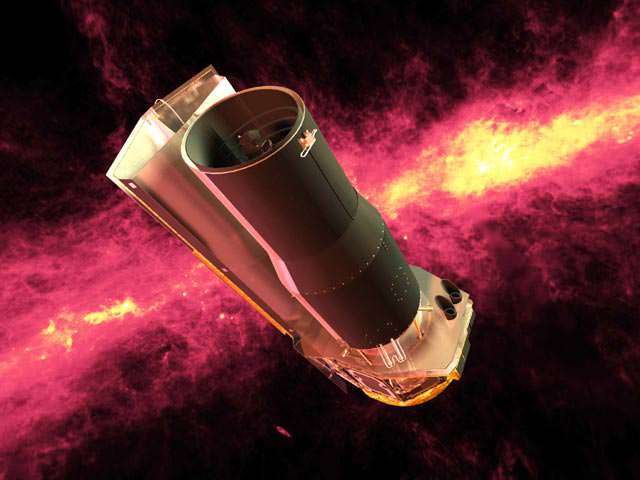
Artist's impression of the Spitzer Space Telescope. Credit: NASA
“Constrained budget conditions” have prompted NASA to not approve a funding extension for the 11-year-old Spitzer Space Telescope after fiscal 2015, but Spitzer officials emphasized that doesn’t necessarily mean the mission is terminated.
“To be clear: Spitzer has not been canceled. Funding not yet identified, but NASA has asked us for a revised budget,” the Spitzer Twitter account wrote to several individuals after news broke that the telescope was not approved in agency’s Senior Review, a process to see how well ongoing missions are performing to expectations.
What this means is that the telescope is expected to go with the “baseline” plan to finish operations after the end of fiscal 2014 and terminate the mission by the end of fiscal 2015, a process that was already outlined in the NASA budget request for 2015. But there’s a chance, officials said, that this would not happen.
“The Spitzer project is invited to respond with a request for a budget augmentation to conduct continued operations with reduced operations costs,” read the NASA response to the 2014 senior review.
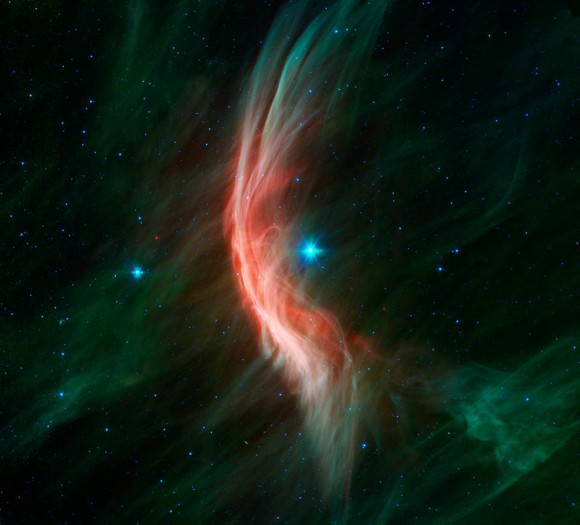
The bow shock of Zeta Ophiuchi, another runaway star observed by Spitzer (NASA/JPL-Caltech)
This “will be considered during the FY 2016 budget formulation process,” NASA added. “If the administration proposes additional funding for Spitzer in the FY16 Budget, the project will be able to seamlessly continue operations in FY15, while awaiting final appropriations from the Congress for FY16.”
The mission was being reviewed in association with several other astrophysics missions, such as the Kepler space telescope — an exoplanet-hunting probe that was sidelined by a mechanical issue, but was approved in the same review for a new mission.
Spitzer drew concern in the senior review for its “significant current cost”, which is reportedly the most expensive among the missions being considered this time around. The cost also concerned the reviewers because Spitzer’s “observational capabilities are significantly reduced” since the telescope ran out of coolant in 2009.
That said, the so-called “warm” Spitzer mission — which allows it to view different parts of the infrared despite operating at a higher temperature — did impress reviewers with its ability to measure light, especially since it has been able to conduct wide-field surveys that “will not be approached” until the James Webb Space Telescope goes to orbit in 2018.
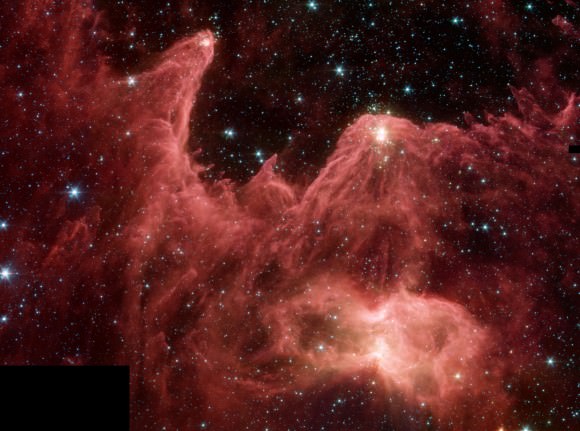
The ‘Mountains of Creation’ in the W5 region near Perseus, taken by the Spitzer Space Telescope. Credit: NASA / JPL-Caltech / CfA
“The cost is particularly difficult in the context of an observatory with greatly reduced capabilities with respect to its prime mission,” the review read. “The mission also did not present substantial plans to reduce operations costs with such reduced capabilities. Given the budget climate, the SRP cannot recommend funding of Spitzer at the levels requested.”
While criticizing the cost, the senior review also noted Spitzer has been doing a lot of “unexpected science” such as looking at the atmosphere of exoplanets and brown dwarfs, and identifying the galaxies that are speeding away from Earth the fastest (also known as “high-redshift galaxies.”)
– Seeing light from a planet outside of the solar system, which was not in the design plans;
– Surveying stars in formation in clouds that are relatively close to Earth;
– Creating a better map of the Milky Way’s spiral arms.
NASA also regularly does image releases with wavelengths from all three of its “Great Observatories”: Spitzer, the Hubble Space Telescope and the Chandra X-Ray Observatory. Funding extension for both Chandra and Hubble were approved in the review. You can read more about the review at this website.
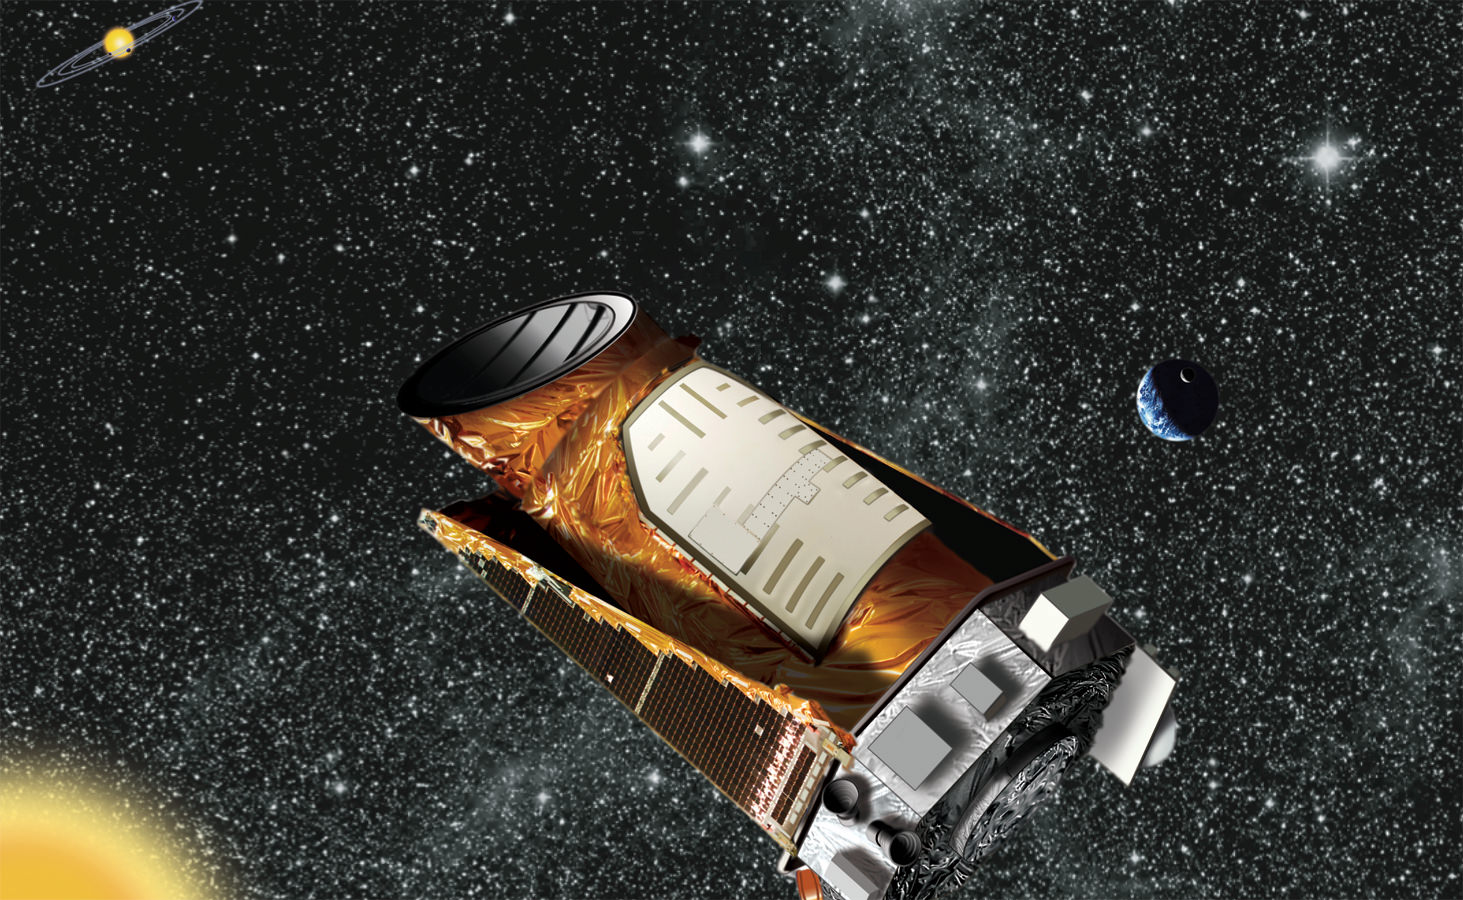
Artist's conception of the Kepler Space Telescope. Credit: NASA/JPL-Caltech
After several months with their telescope on the sidelines, the Kepler space telescope team has happy news to report: the exoplanet hunter is going to do a new mission that will compensate for the failure that stopped its original work.
Kepler’s exoplanet days were halted last year when the second of its four reaction wheels (pointing devices) failed, which meant the telescope could not gaze at its “field” of stars in the Cygnus constellation for signs of exoplanets transiting their stars.
Results of a NASA Senior Review today, however, showed that the telescope will receive the funding for the K2 mission, which allows for some exoplanet hunting, among other tasks. The telescope will essentially change positions several times a year to do its new mission, which is funded through 2016.
“The approval provides two years of funding for the K2 mission to continue exoplanet discovery, and introduces new scientific observation opportunities to observe notable star clusters, young and old stars, active galaxies and supernovae,” wrote Charlie Sobeck, the mission manager for Kepler, in a mission update today (May 16).
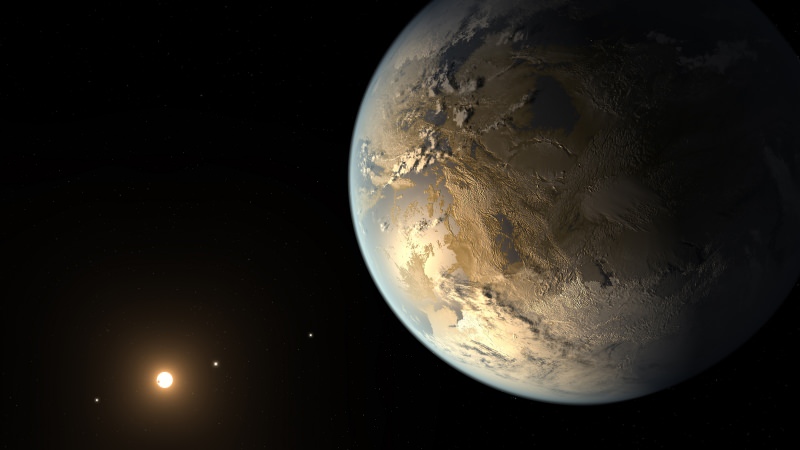
Artist’s rendering of the Earth-sized Kepler-186f (Credit: NASA Ames/SETI Institute/Caltech)
“The team is currently finishing up an end-to-end shakedown of this approach with a full-length campaign (Campaign 0), and is preparing for Campaign 1, the first K2 science observation run, scheduled to begin May 30.”
While Kepler itself was not being used for planet hunting, scientific discoveries continue because the telescope has a legacy of observations stretching between 2009 and 2013. One notable find: 715 exoplanets were announced in one swoop earlier this year using a new technique called “verification by multiplicity”, which is useful in multiple-planet systems.
Kepler also spotted the first known Earth-sized planet in a habitable zone outside of our solar system, which achieves the mission’s stated goal of finding extrasolar Earths.