In our Solar System, astronomers often divide the planets into two groups — the inner planets and the outer planets. The inner planets are closer to the Sun and are smaller and rockier. The outer planets are further away, larger and made up mostly of gas.
The inner planets (in order of distance from the sun, closest to furthest) are Mercury, Venus, Earth and Mars. After an asteroid belt comes the outer planets, Jupiter, Saturn, Uranus and Neptune. The interesting thing is, in some other planetary systems discovered, the gas giants are actually quite close to the sun.
This makes predicting how our Solar System formed an interesting exercise for astronomers. Conventional wisdom is that the young Sun blew the gases into the outer fringes of the Solar System and that is why there are such large gas giants there. However, some extrasolar systems have “hot Jupiters” that orbit close to their Sun.
The Inner Planets:
The four inner planets are called terrestrial planets because their surfaces are solid (and, as the name implies, somewhat similar to Earth — although the term can be misleading because each of the four has vastly different environments). They’re made up mostly of heavy metals such as iron and nickel, and have either no moons or few moons. Below are brief descriptions of each of these planets based on this information from NASA.
Mercury: Mercury is the smallest planet in our Solar System and also the closest. It rotates slowly (59 Earth days) relative to the time it takes to rotate around the sun (88 days). The planet has no moons, but has a tenuous atmosphere (exosphere) containing oxygen, sodium, hydrogen, helium and potassium. The NASA MESSENGER (MErcury Surface, Space ENvironment, GEochemistry, and Ranging) spacecraft is currently orbiting the planet.
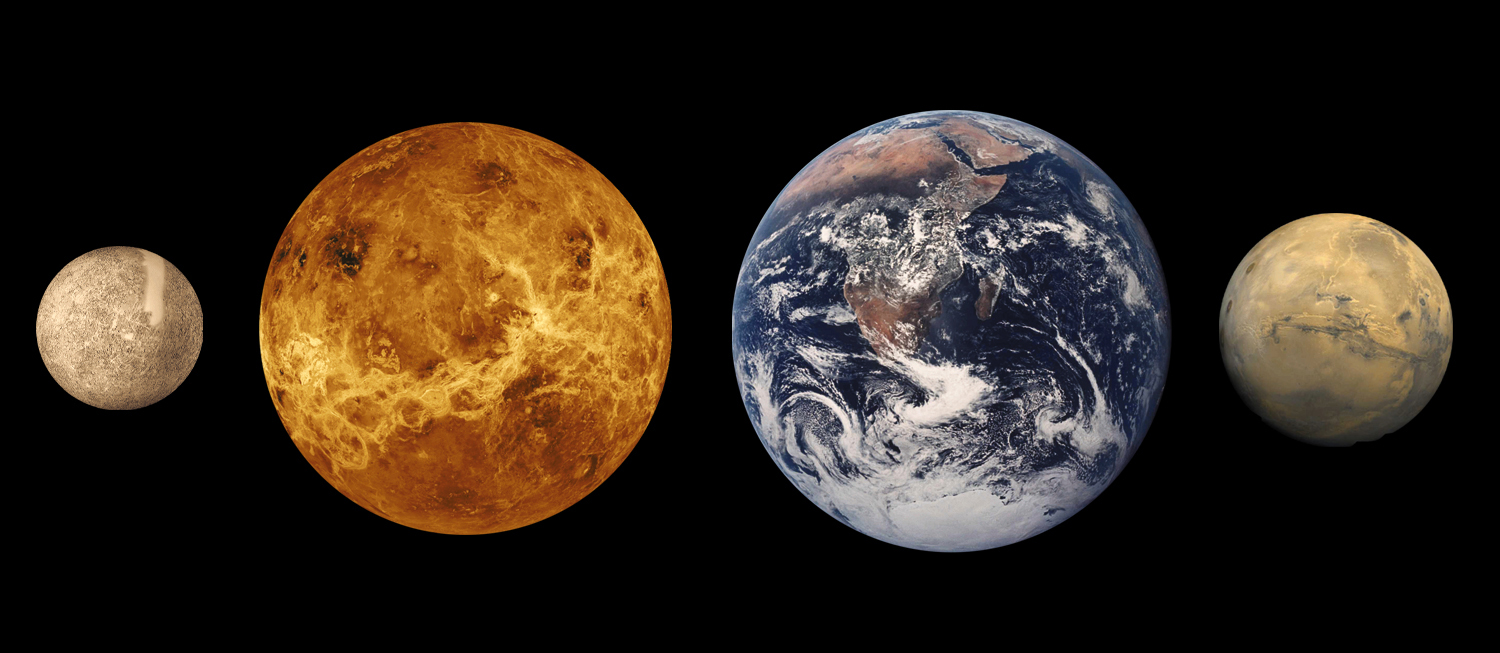
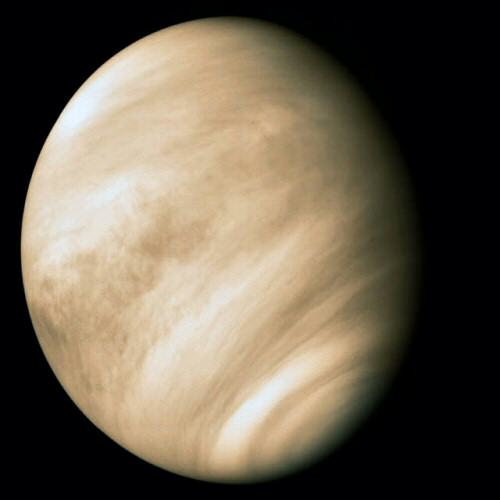
Venus: Venus was once considered a twin planet to Earth, until astronomers discovered its surface is at a lead-melting temperature of 900 degrees Fahrenheit (480 degrees Celsius). The planet is also a slow rotator, with a 243-day long Venusian day and an orbit around the sun at 225 days. Its atmosphere is thick and contains carbon dioxide and nitrogen. The planet has no rings or moons and is currently being visited by the European Space Agency’s Venus Express spacecraft.
Earth: Earth is the only planet with life as we know it, but astronomers have found some nearly Earth-sized planets outside of our solar system in what could be habitable regions of their respective stars. It contains an atmosphere of nitrogen and oxygen, and has one moon and no rings. Many spacecraft circle our planet to provide telecommunications, weather information and other services.
Mars: Mars is a planet under intense study because it shows signs of liquid water flowing on its surface in the ancient past. Today, however, its atmosphere is a wispy mix of carbon dioxide, nitrogen and argon. It has two tiny moons (Phobos and Deimos) and no rings. A Mars day is slightly longer than 24 Earth hours and it takes the planet about 687 Earth days to circle the Sun. There’s a small fleet of orbiters and rovers at Mars right now, including the large NASA Curiosity rover that landed in 2012.

The Outer Planets:
The outer planets (sometimes called Jovian planets or gas giants) are huge planets swaddled in gas. They all have rings and all of plenty of moons each. Despite their size, only two of them are visible without telescopes: Jupiter and Saturn. Uranus and Neptune were the first planets discovered since antiquity, and showed astronomers the solar system was bigger than previously thought. Below are brief descriptions of each of these planets based on this information from NASA.
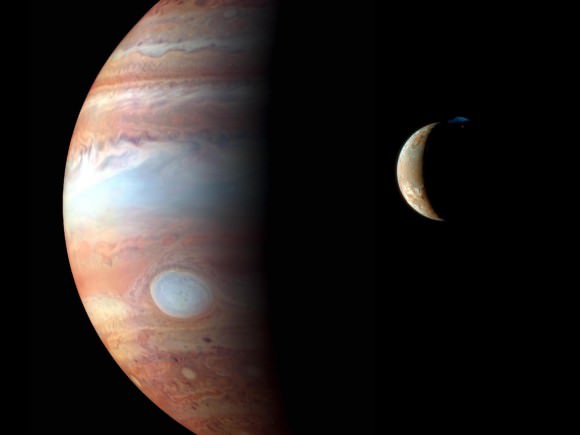
Jupiter: Jupiter is the largest planet in our Solar System and spins very rapidly (10 Earth hours) relative to its orbit of the sun (12 Earth years). Its thick atmosphere is mostly made up of hydrogen and helium, perhaps surrounding a terrestrial core that is about Earth’s size. The planet has dozens of moons, some faint rings and a Great Red Spot — a raging storm happening for the past 400 years at least (since we were able to view it through telescopes). NASA’s Juno spacecraft is en route and will visit there in 2016.
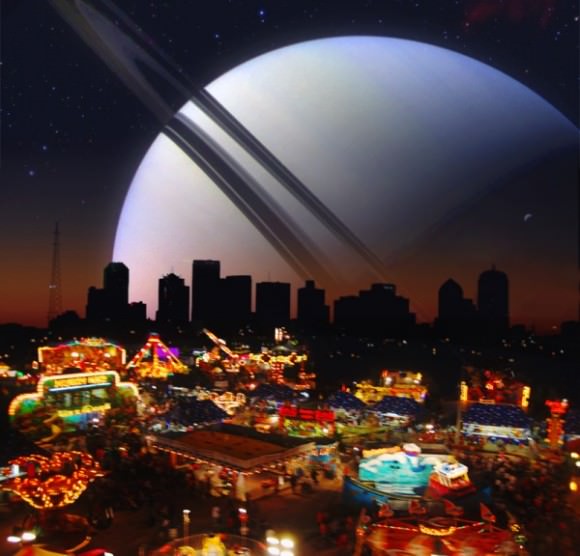
Saturn: Saturn is best known for its prominent ring system — seven known rings with well-defined divisions and gaps between them. How the rings got there is one subject under investigation. It also has dozens of moons. Its atmosphere is mostly hydrogen and helium, and it also rotates quickly (10.7 Earth hours) relative to its time to circle the Sun (29 Earth years). Saturn is currently being visited by the Cassini spacecraft, which will fly closer to the planet’s rings in the coming years.
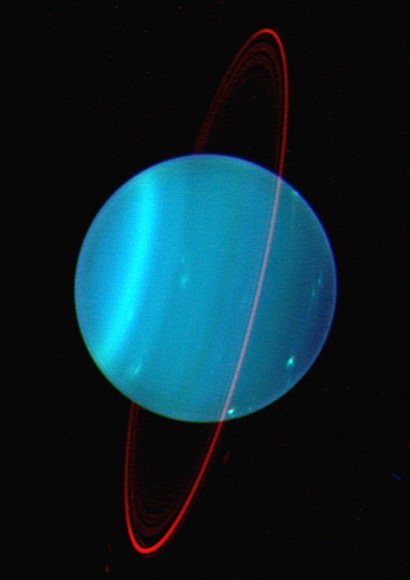
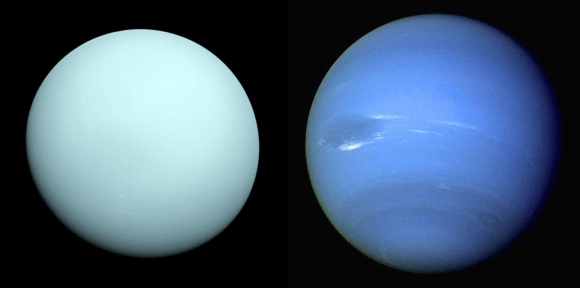
Uranus: Uranus was first discovered by William Herschel in 1781. The planet’s day takes about 17 Earth hours and one orbit around the Sun takes 84 Earth years. Its mass contains water, methane, ammonia, hydrogen and helium surrounding a rocky core. It has dozens of moons and a faint ring system. There are no spacecraft slated to visit Uranus right now; the last visitor was Voyager 2 in 1986.
Neptune: Neptune is a distant planet that contains water, ammmonia, methane, hydrogen and helium and a possible Earth-sized core. It has more than a dozen moons and six rings. The only spacecraft to ever visit it was NASA’s Voyager 2 in 1989.
To learn more about the planets and missions, check out these links:
Solar System Exploration: Planets (NASA)
NASA Photojournal (NASA)
Missions (NASA)
Space Science (European Space Agency)
USGS Astrogeology (U.S. Geological Survey)
The Solar System And Its Planets (European Space Agency)