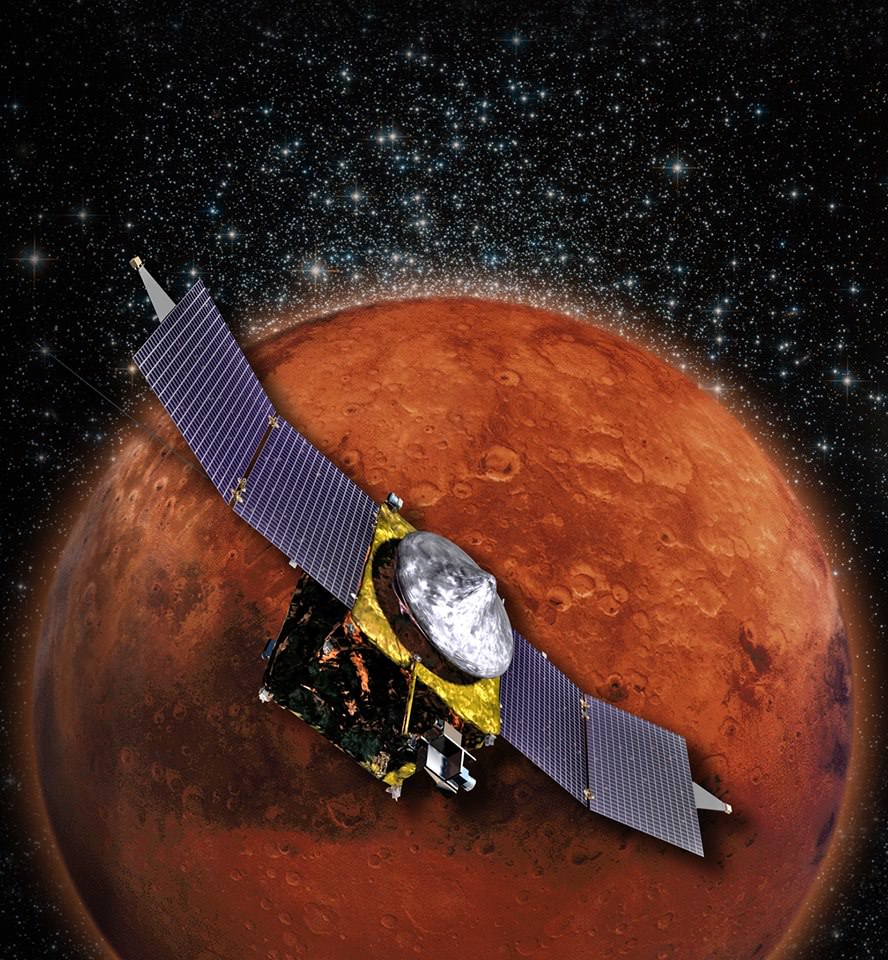
MAVEN is NASA’s next Mars Orbiter and will investigate how the planet lost most of its atmosphere and water over time. Credit: NASA
NASA’s newest Mars orbiter, the Mars Atmosphere and Volatile Evolution (MAVEN) probe passed a significant interplanetary milestone with the announcement that all of the craft’s science instruments were activated and passed their initial checkout.
“I’m delighted that we’re operating in space so well,” Bruce Jakosky, MAVEN’s Principal Investigator told Universe Today.
“We’re on our way!”
Earth is now clearly in the rear view mirror and fading with each passing day.
The $671 Million MAVEN spacecraft’s goal is to study Mars upper atmosphere to explore how the Red Planet may have lost its atmosphere and water over billions of years.
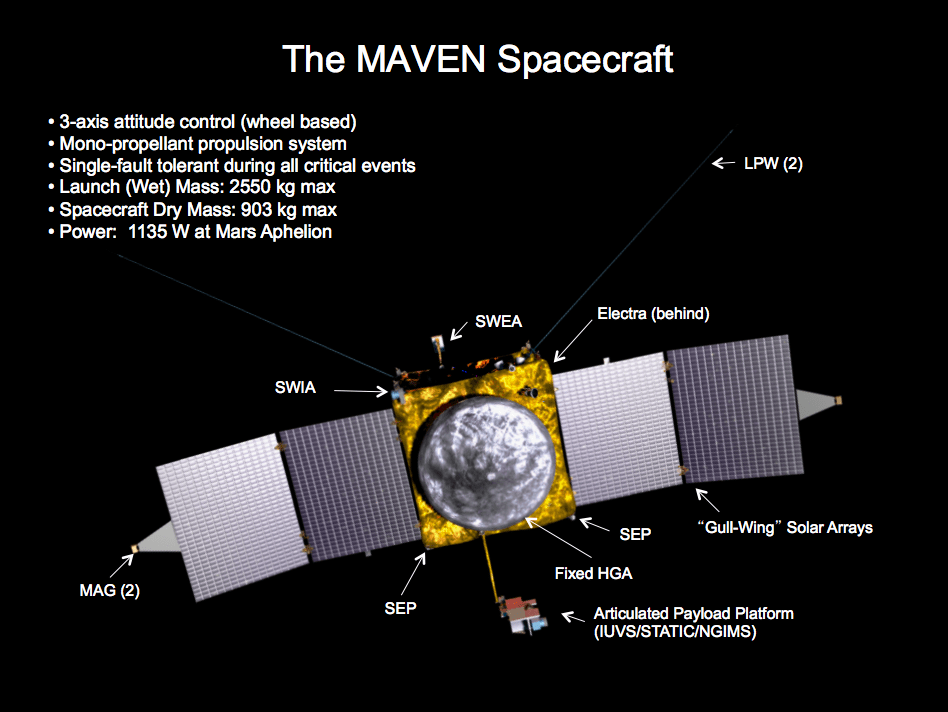
The MAVEN probe carries nine sensors in three instrument suites to study why and exactly when did Mars undergo the radical climatic transformation.
“I’m really looking forward to getting to Mars and starting our science!” Jakosky told me.
MAVEN aims to discover the history of water and habitability stretching back over billions of years on Mars.
It will measure current rates of atmospheric loss to determine how and when Mars lost its atmosphere and water.
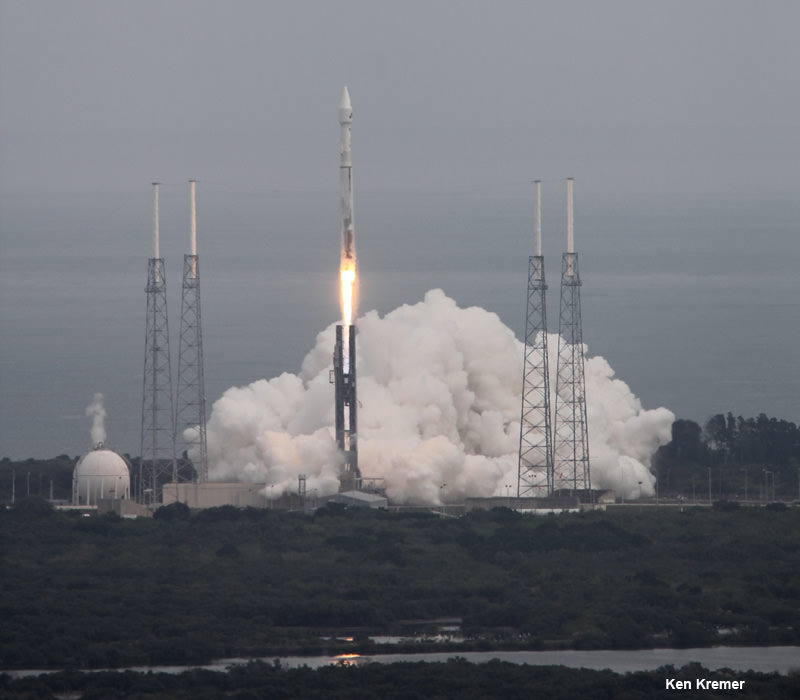
MAVEN thundered to space nearly three months ago on Nov. 18, 2013 following a flawless blastoff from Cape Canaveral Air Force Station’s Space Launch Complex 41 atop a powerful Atlas V rocket and thus began a 10 month interplanetary voyage from Earth to the Red Planet.
NASA’s Mars bound MAVEN spacecraft launches atop Atlas V booster at 1:28 p.m. EST from Space Launch Complex 41 at Cape Canaveral Air Force Station on Nov. 18, 2013. Image taken from the roof of the Vehicle Assembly Building (VAB) at NASA’s Kennedy Space Center. Credit: Ken Kremer/kenkremer.com
“I can’t tell you how exciting this is to be now only seven and a half months from getting to Mars,” Jakosky gushed.
Further instrument checkouts are planned as the orbiter streaks closer to Mars including tesating to the Electra communications package that will serve as a critical relay for NASA’s surface rovers including Curiosity, Opportunity and the planned 2020 rover.
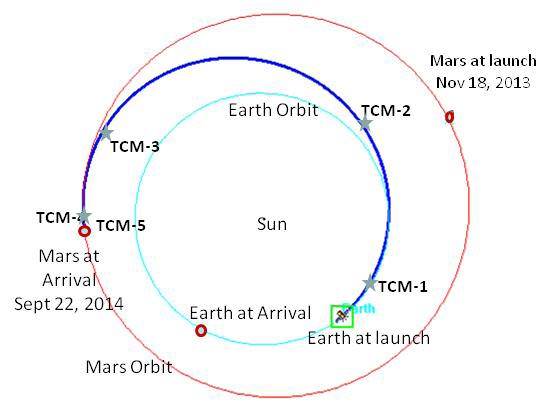
“The second Trajectory Correction Maneuver (TCM-2) is scheduled for Feb. 26,” said Jakosky.
MAVEN’s trajectory from Earth to Mars. MAVEN arrives at Mars on Sept. 22, 2014 some ten months after launch on Nov. 18, 2013. Credit: NASA
TCM thruster firings insure that the spacecraft is exactly on course for the do or die orbital insertion maneuver when MAVEN arrives on September 22, 2014.
To date MAVEN has flown over 137 million miles (221 million km) of its total 442 million miles (712 million km) path to Mars. It is speeding around the sun at 69,480 mph or 31.06 kps.
“The performance of the spacecraft and instruments to date bears out all the hard work the team put into testing the system while it was on the ground,” said David Mitchell, MAVEN project manager at NASA’s Goddard Space Flight Center in Greenbelt, Md, in a statement.
“The way that the operations team has performed while flying the system has been nothing short of outstanding. We have big events ahead of us before we can claim success but I am very pleased with how things have gone thus far.”
MAVEN is not alone in the frigid vacuum of space. She is joined by India’s Mars Orbiter Mission (MOM) orbiter in pursuit of Mars to fortify Earth’s invasion fleet.
MOM will reach Mars vicinity on Sept. 24, just two days after the arrival MAVEN on Sept. 22, 2014.
Stay tuned here for Ken’s continuing MAVEN, Curiosity, Opportunity, Chang’e-3, SpaceX, Orbital Sciences, LADEE, MOM, Mars and more planetary and human spaceflight news.
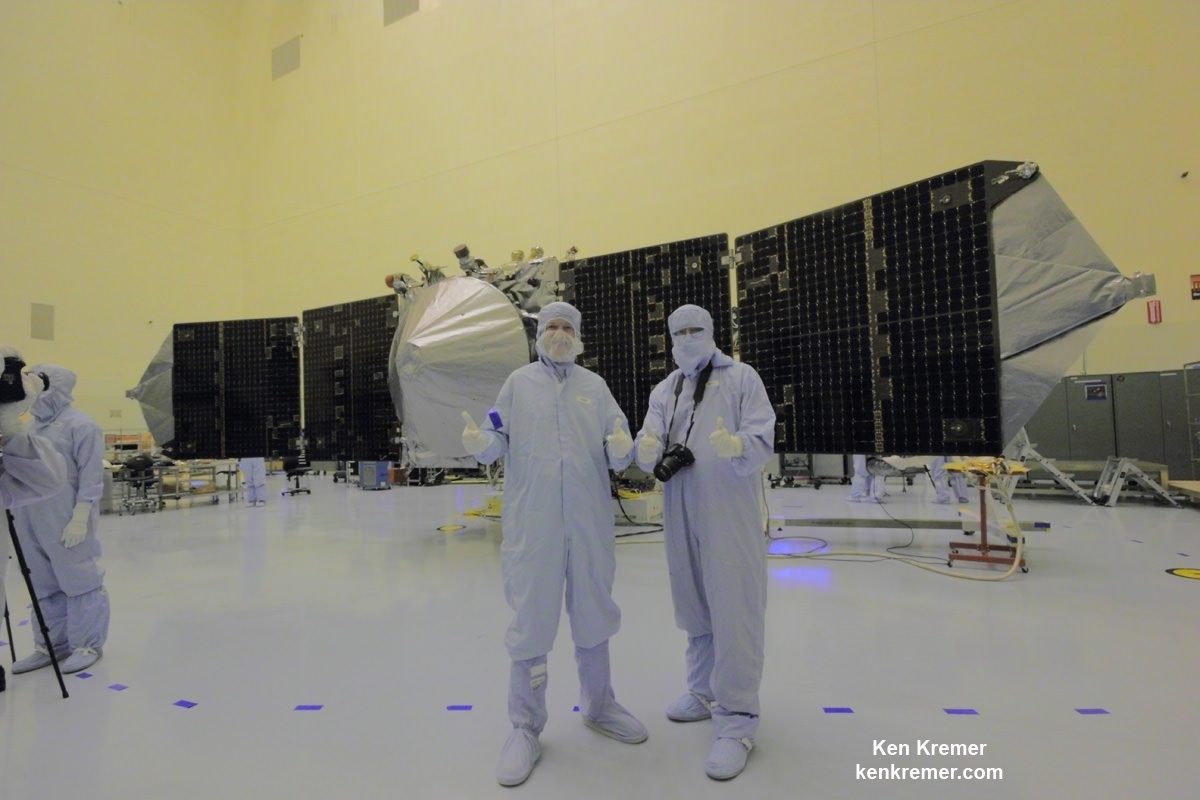
Ken Kremer NASA’s MAVEN Mars orbiter, chief scientist Prof. Bruce Jakosky of CU-Boulder and Ken Kremer of Universe Today inside the clean room at the Kennedy Space Center on Sept. 27, 2013. MAVEN launched to Mars on Nov. 18, 2013 from Florida. Credit: Ken Kremer/kenkremer.com
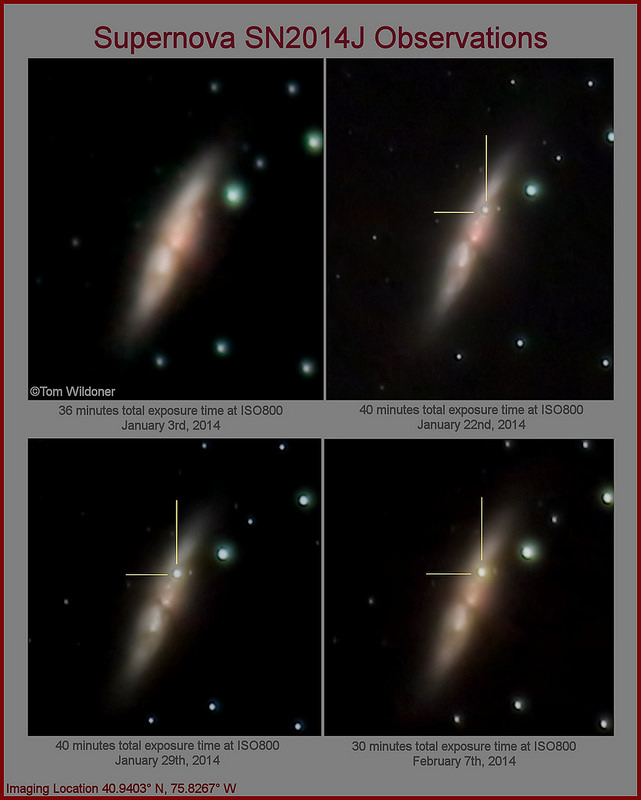
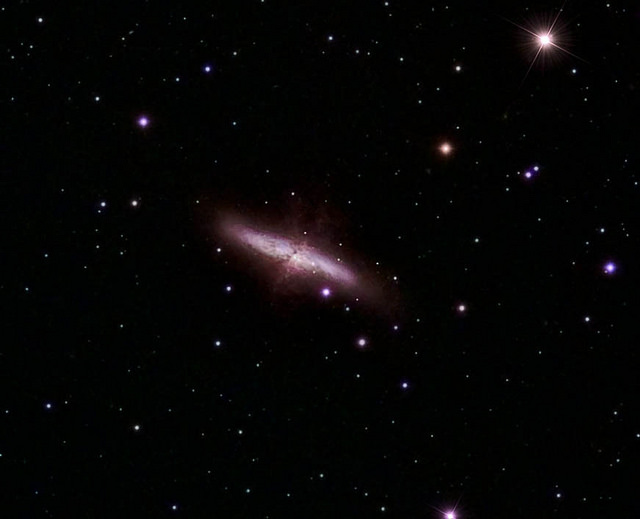
Comparison images from just before the supernova in M82 until Feb 7, 2014. Credit and copyright: Tom Wildoner.
In only three weeks since its discovery on January 21, 2014, much has been learned about the new supernova SN 2014J in Messier 82, the “Cigar” galaxy. In addition to early confirmation based on its spectrum that it is indeed a type Ia supernova, it is now understood to be the nearest type Ia explosion to our Milky Way galaxy since 1986.
Its unique proximity alone makes SN 2014J one the most important supernova ever observed. It will impact our understanding both of the type Ia-class of supernovae and of the Universe as a whole, because our Universe’s size, age, and ultimate fate are linked intimately to observations of type Ia supernovae, and because the precision with which they can be applied to estimate Universal-scale distances depends crucially on the nearest examples. SN 2014J is very likely to remain the nearest anchor-point in the type Ia supernovae-based distance scale for decades to come.
“Being the nearest supernova of this kind, SN 2014J will help us to better calibrate the expansion of the Universe,” said Adam Riess, co-leader of the Supernova H0 for Equation of State (SHOES) project, and co-winner of the 2011 Nobel Prize in Physics.
Observations of type Ia supernovae led to the discovery that our Universe is made mostly of dark energy, and that its expansion rate is apparently accelerating. That discovery earned the 2011 Nobel Prize in Physics for Riess, Saul Perlmutter, and Brian Schmidt.
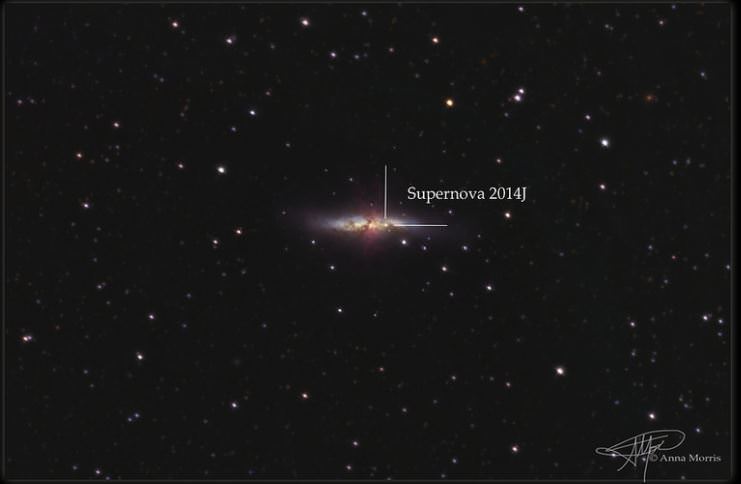
Measuring ever more accurately our Universe’s exact expansion rate has been the Holy Grail of cosmology since Hubble’s discovery of expansion in 1929. Type Ia are perfect for probing cosmological scale distances, because these stellar explosions occur only when white dwarf stars exceed a certain critical mass, equivalent to 1.4 solar masses. M82 with Supernova 2014J imaged on January 23, 2014. Credit and copyright: Anna Morris.
As a result, most type Ia supernova explode with roughly the same intrinsic or absolute magnitude. They therefore provide a unique kind of “standard candle,” by which any type Ia supernova observed to be one hundred times fainter than another can be understood to be exactly ten times farther than the other. In practice, subtle differences between actual type Ia supernovae, amounting to around ten percent on average in their net effect on distance estimates, are accounted for. Technically, therefore, type Ia supernova provide “standardizable candles.”
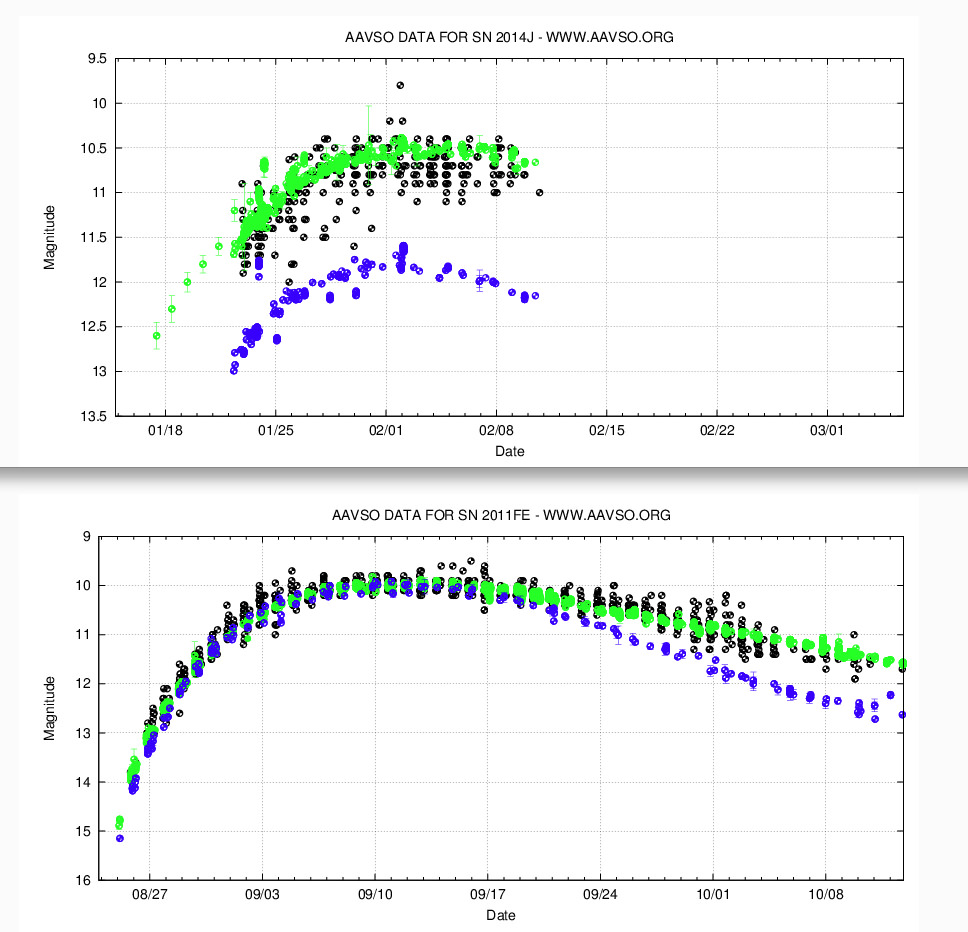
Normal type Ia supernovae are well understood. Within just days of its discovery, Robert Quimby of the Kavli Institute for the Physics and Mathematics of the Universe at the University of Tokyo was able to predict the peak apparent magnitude of m_V = 10.5 and time of peak brightness of February 2 for SN 2014J, more than a week prior to their occurrence. As observations now available show, as summarized in the light-curve available thanks to the American Association of Variable Star Observers, Quimby’s prediction based on the light-curves of other similar type Ia supernova, was spot on (see Figure 1, below).
Light curves for SN 2014J and SN 2011fe, the next nearest type Ia supernova, show blue magnitudes are ~1.3 mag fainter (blue dots) than visual magnitudes (green dots) for SN 2014J, due to obscuring dust in host galaxy Messier 82, compared to the normal, non-obscured, and nearly over-lapping blue and visual magnitudes for SN 2011fe. Courtesy of the American Association of Variable Star Observers.
While SN 2014J is a normal type Ia supernova, its light-curve reveals it is highly reddened, as in dimmed and obscured by large amounts of dust present and intervening in its host galaxy. The amount of reddening is indicated by the difference between the blue and visual magnitudes. Known as extinction, measured as E = (B-V), for SN 2014J the extinction amounts to ~1.3 mag. That compares to the next nearest recent type Ia supernova, SN 2011fe in galaxy Messier 101, at 23 million light-years (7.0 Megaparsecs). It’s light-curve shows SN 2011fe was reddened very little in comparison, i.e.- both spectrum and colour are normal.
The date of SN 2014J explosion’s first light has now been established to be January 14.72 UT, around one week prior to discovery January 21. That was reported in one of at least two papers already published online regarding SN 2014J, the one by WeiKang Zheng et al., and which has already been submitted to Astrophysical Journal Letters (see e-print here). SN 2014J is one of only four type Ia supernova with observations as early as one day after first light, the others including SN 2011fe mentioned, and SN 2009ig in galaxy NGC 1015 at 130 million light-years (41 Megaparsecs), and SN 2013dy in galaxy NGC 7250 at 46 million light-years (14 Megaparsecs).
Two rivals for nearest recent type Ia supernovae, SN 1972E in galaxy NGC 5253 and SN 1986G in NGC 5128, the Centaurus A galaxy, were cited early. Neither however, are argued to be directly relevant to the current distance scale zero point because neither have modern, complete, multi-band and multi-epoch observations including pre-maximum observations, which are quintessential to defining zero point type Ia supernovae, and data that is now being gathered for SN 2014J. For example, SN 2002fk in galaxy NGC 1309 at 100 million light-years (31 Megaparsecs) is one of only eight type Ia supernovae employed as zero point calibrators, because of their complete, multi-epoch, multi-band light-curve data, as employed for example by Riess et al. (see: 2011ApJ…730..119R).
In terms of which recent type Ia supernova was relatively nearest, the distances to the galaxies involved can be estimated based on analyzing essentially all of the redshift-independent distance estimates that have been published for galaxies since 1980, meaning in the modern era using CCDs and including observations based on NASA’s Hubble Space Telescope. Such galaxy distance estimates are tabulated in the NASA/IPAC Extragalactic Database of galaxy Distances (NED-D).
Galaxy Messier 82, the host of SN 2014J, is located at 12.0 million light-years (3.6 Megaparsecs), based on the mean of three kinds of distance indicator employing 8 different estimates. The standard deviation among those indicators is ~10%.
Galaxy NGC 5128, the host of SN 1986G, is also located at 12.0 million light-years, based on 11 different indicators employing 46 different distance estimates, and also with a standard deviation among indicators of ~10%. So, to within the precision of the indicators, both supernova occurred at essentially the same distance, confirming SN 2014J is the nearest since SN 1986G. Galaxy NGC 5253, the host of SN 1972E, is actually the nearest galaxy, at 11.0 million light-years (3.4 Megaparsecs) known to have hosted a type Ia supernova in the modern era, based on 6 indicators with 48 estimates.
M82 and Supernova 2014J imaged on January 23, 2014. Credit and copyright: Mick Hyde.
Accounting for its dimming due to the dust in Messier 82 is just one part of several involved in applying data from SN 2014J to estimate its distance. Future observations of its declining magnitude will reveal its complete light-curve. That will enable estimates to be made of its decline time and light-curve stretch factors. Once these are in hand, within the next few to several weeks at most, SN 2014J will begin its use as the nearest type Ia supernova anchor point.
More of a milestone than a Rosetta stone, SN 2014J will nevertheless have an impact of lasting legacy on future applications of type Ia supernova observations in cosmology. It will be especially significant to enhancing the use of type Ia supernova as cosmological distance indicators. That is important to ongoing projects, including the SHOES project, the Carnegie Hubble Program, and others, all of which aim to measure the Universe’s expansion rate or Hubble constant to an accuracy of better than one percent within the next decade. That level of accuracy is required in order to understand not only our Universe’s exact size and age, but also the exact Equation-of-State governing our Universe’s total energy, including its dark energy.
If you’ve got a space-related blog, you should really join the carnival. Just email an entry to [email protected], and the next host will link to it. It will help get awareness out there about your writing, help you meet others in the space community – and community is what blogging is all about. And if you really want to help out, sign up to be a host. Send an email to the above address.
Coronal Mass Ejection as viewed by the Solar Dynamics Observatory on June 7, 2011. A similar type of outburst triggered aurorae during a strong geomagnetic storm in February 1872. Image Credit: NASA/SDO
Four years ago today, the Solar Dynamics Observatory embarked on a five-year mission to boldly go where no Sun-observing satellite has gone before. SDO uses its three instruments to look constantly at the Sun in ten different wavelengths. Called the “Crown Jewel” of NASA’s fleet of solar observatories, SDO is a technologically advanced spacecraft that takes images of the sun every 0.75 seconds. Each day it sends back about 1.5 terabytes of data to Earth — the equivalent of about 380 full-length movies.
SDO launched on Feb. 11, 2010, and it has since captured the amazing views of the ever-changing face of the Sun — the graceful dance of solar material coursing through the Sun’s the corona, massive solar explosions and giant sunspot shows. Enjoy this latest highlight video from year 4 from SDO!
I was priveldged to be able to attend the launch of SDO, and you can read our article about the launch here.
The launch included a little “special effects” that wowed the crowd. The Atlas rocket soared close to a sundog just as the spacecraft reached Max-Q, and a ripple effect was created around the spacecraft. You can watch the launch below to see what happened:
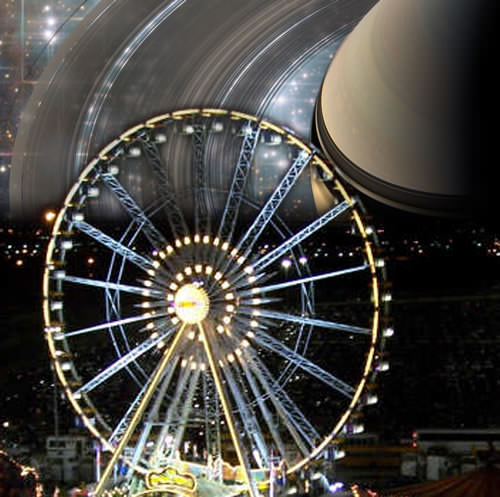
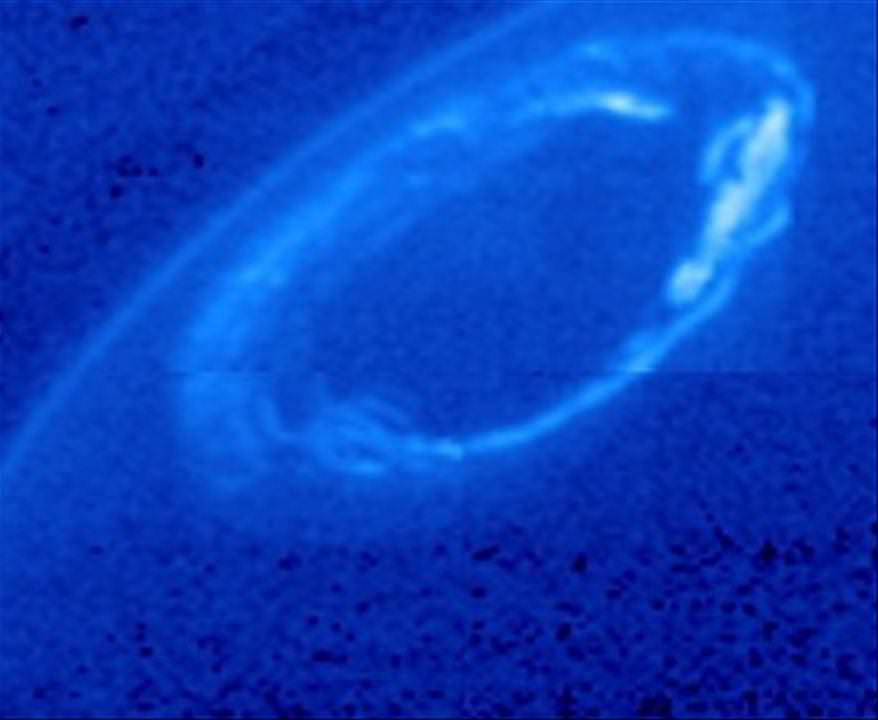
An aurora around Saturn's north pole in 2013. Credit: NASA/ESA/University of Leicester and NASA/JPL-Caltech/University of Arizona/Lancaster University
Above is the latest rave-like video from NASA. While the images are reminiscent of what could play during an awesome Friday night party, what you’re actually seeing is a timelapse of auroras on Saturn. These pictures are pretty to look at, but they also tell us more about how the sun’s belches of stuff influence the magnetic field around the ringed gas giant.
“Saturn’s auroras can be fickle — you may see fireworks, you may see nothing,” stated Jonathan Nichols of the University of Leicester in England, who led the work on the Hubble Space Telescope images shown in the video. “In 2013, we were treated to a veritable smorgasbord of dancing auroras, from steadily shining rings to super-fast bursts of light shooting across the pole.”
The light show was captured by both the Saturn-orbiting Cassini spacecraft and the Earth-orbiting Hubble. Cassini managed to nab its images from three Saturn distances away (which is apparently an unusually close vantage point.) This location “provided a look at the changing patterns of faint emissions on scales of a few hundred miles (kilometers) and tied the changes in the auroras to the fluctuating wind of charged particles blowing off the sun and flowing past Saturn,” NASA stated.
Here are a few things scientists are learning (or hoping to learn soon) from the light show:
How auroras are formed. The Cassini images suggest that as magnetic field lines forge new links, this is where the storms are centered. This process happens on Earth, so it would make sense for it to happen elsewhere. Researchers also found that some of the auroras stick close to the orbital position of Mimas, suggesting that the moon may be influencing some of the storms (a process already known to happen with Enceladus).
The nature of Saturn’s atmosphere. While the answers are still forthcoming, scientists are examining why the top of Saturn’s atmosphere (and other gas giants) are warmer than would be expected given how far they are from the sun. “By looking at these long sequences of images taken by different instruments, we can discover where the aurora heats the atmosphere as the particles dive into it and how long the cooking occurs,” stated Sarah Badman, a Cassini visual and infrared mapping spectrometer team associate at Lancaster University, England.
What color the auroras are. Red on the bottom, and purple on the top, depending on how Saturn’s hydrogen is excited and what light it emits. (For reference, Earth’s is green on bottom and red at top due to excitement of nitrogen and oxygen).
Where charged particles around Saturn go. More data from the W.M. Keck Observatory and NASA’s Infrared Telescope Facility (both in Hawaii) could show “how particles are ionized in Saturn’s upper atmosphere,” NASA stated. Better yet, scientists can compare that information to the stuff gathered from outside of Earth’s atmosphere by Hubble and Cassini. This will allow them to see what distortions the ground-based observatories experienced due to Earth’s atmosphere, and improve the accuracy of the observations.
Not bad work for a single music video, isn’t it? For more information on auroras on Saturn, check out these past Universe Today stories:
“We are, you and I, at least one of the ways that the Universe knows itself.” – Bill Nye
Did you manage to (or choose to) watch the much-anticipated debate between Science Guy Bill Nye and Ken Ham on the “merits” of Creationism on Feb. 4? While clearly nothing more than a publicity event cooked up by Ham to fund his Creation Museum in Kentucky (yes, I’m afraid that’s actually a thing here in America) Nye felt it to be in his — as well as the country’s — best interest to stand up and defend science and its methods in the face of unapologetic fundamentalist denial.
The video above, just released by John D. Boswell — aka melodysheep, creator of the excellent Symphony of Science series — takes some of Bill’s statements during the debate and puts them to music and images of our fascinating world.
Meet Kepler-22b, an exoplanet with an Earth-like radius in the habitable zone of its host star. Unfortunately its mass remains unknown. Image Credit: NASA
Astronomers constantly probe the skies for the unexpected. They search for unforeseen bumps in their data — signaling an unknown planet orbiting a star, a new class of astronomical objects or even a new set of physical laws that will rewrite the old ones. They are willing to embrace new ideas that may replace the wisdom of years past.
But there’s one exception to the rule: the search for Earth 2.0. Here we don’t want to find the unexpected, but the expected. We want to find a planet so similar to our own, we can almost call it home.
While, we can’t exactly image these planets with great enough detail to see if one’s a water world with luscious green plants and civilizations, we can use indirect methods to find an “Earth-like” planet — a planet with a similar mass and radius to the Earth.
There’s only one problem: the current techniques to measure an exoplanet’s mass are limited. To date astronomers measure radial velocity — tiny wobbles in a star’s orbit as it’s tugged by the gravitational pull of its exoplanet — to derive the planet-to-star mass ratio.
But given that most exoplanets are detected via their transit signal — dips in light as a planet passes in front of its host star — wouldn’t it be great if we could measure its mass based on this method alone? Well, astronomers at MIT have found a way.
Graduate student Julien de Wit and MacArthur Fellow Sara Seager have developed a new technique for determining mass by using an exoplanet’s transit signal alone. When a planet transits, the star’s light passes through a thin layer of the planet’s atmosphere, which absorbs certain wavelengths of the star’s light. Once the starlight reaches Earth it will be imprinted with the chemical fingerprints of the atmosphere’s composition.
The so-called transmission spectrum allows astronomers to study the atmospheres of these alien worlds.
But here’s the key: a more massive planet can hold on to a thicker atmosphere. So in theory, a planet’s mass could be measured based on the atmosphere, or the transmission spectrum alone.
Of course there isn’t a one to one correlation or we would have figured this out long ago. The atmosphere’s extent also depends on its temperature and the weight of its molecules. Hydrogen is so light it slips away from an atmosphere more easily than, say, oxygen.
So de Wit worked from a standard equation describing scale height — the vertical distance over which the pressure of an atmosphere decreases. The extent to which pressure drops off depends on the planet’s temperature, the planet’s gravitational force (a.k.a. mass) and the atmosphere’s density.
According to basic algebra: knowing any three of these parameters will let us solve for the fourth. Therefore the planet’s gravitational force, or mass, can be derived from its atmospheric temperature, pressure profile and density — parameters that may be obtained in a transmission spectrum alone.
With the theoretical work behind them, de Wit and Seager used the hot Jupiter HD 189733b, with an already well-established mass, as a case study. Their calculations revealed the same mass measurement (1.15 times the mass of Jupiter) as that obtained by radial velocity measurements.
This new technique will be able to characterize the mass of exoplanets based on their transit data alone. While hot Jupiters remain the main target for the new technique, de Wit and Seager aim to describe Earth-like planets in the near future. With the launch of the James Webb Space Telescope scheduled for 2018, astronomers should be able to obtain the mass of much smaller worlds.
The paper has been published in Science Magazine and is now available for download in a much longer form here.
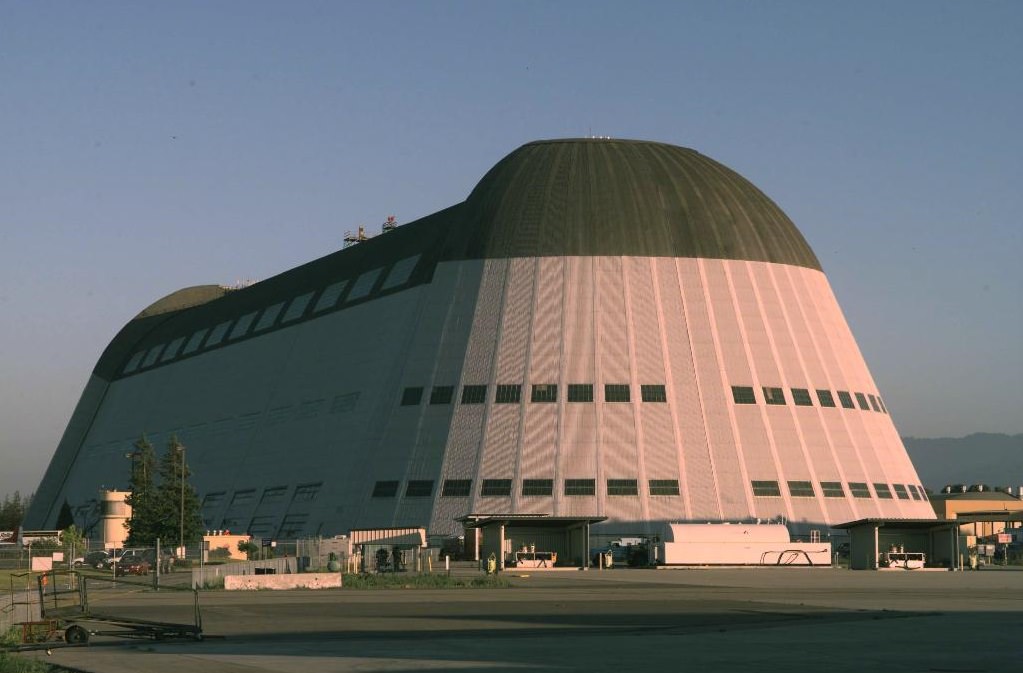
A 1999 image of Hangar 1 taken in Moffett Field, Calif. Credit: NASA Ames Research Center
Back in late 2011, three Google executives reportedly approached NASA because they knew the agency was facing a problem. NASA was managing the eight-acre Hangar One, which is best remembered for being an airship construction facility 80 years ago. Renovations were getting expensive, though, and the executives had a proposal: it would take over the fixing-up, as long as they could park several private jets in the facility.
Fast-forward a couple of years, and after a competitive process Google real estate subsidiary Planetary Ventures LLC is going to negotiate on a lease with two goals: fix up Hangar One and manage Moffett Federal Airfield. If approved, the lease would remove the NASA Ames Research Center’s management costs.
It’s another example of NASA looking to lease out its historic facilities to the private sector (examples: here and here) to save money amid cost-consciousness by federal legislators, something that administrator Charles Bolden highlighted in a statement. “The agreement announced today will benefit the American taxpayer and the community around Moffett,” he said. “It will allow NASA to focus its resources on core missions, while protecting the federal need to use Moffett Field as a continued, limited-use airfield.”
An undated photo showing a blimp inside Hangar One. The facility began as a facility for airships in the 1930s. Credit: NASA Ames Research Center
Lease terms are still being negotiated, but these are some of the things expected to be a part of it: rehabilitating Hangars One, 2 and 3, fixing up a golf course, starting a public use and educational facility, and getting rid of NASA’s operation and maintenance cost of the area, among other things. In a press release, NASA did not give a date as to when these negotiations would conclude.
As Wired points out, this is an indication that Google and NASA are becoming trusted partners in ventures such as this. “It underscores the increasingly tight relationship between Google and the space agency research center, located just three miles from Google’s headquarters,” wrote Robert McMillan. “Google has already leased more than 40 acres of NASA Ames space to build a 1.2-million-square-foot R&D facility, and the company is working with NASA to test the world’s first quantum computer at Ames too.”
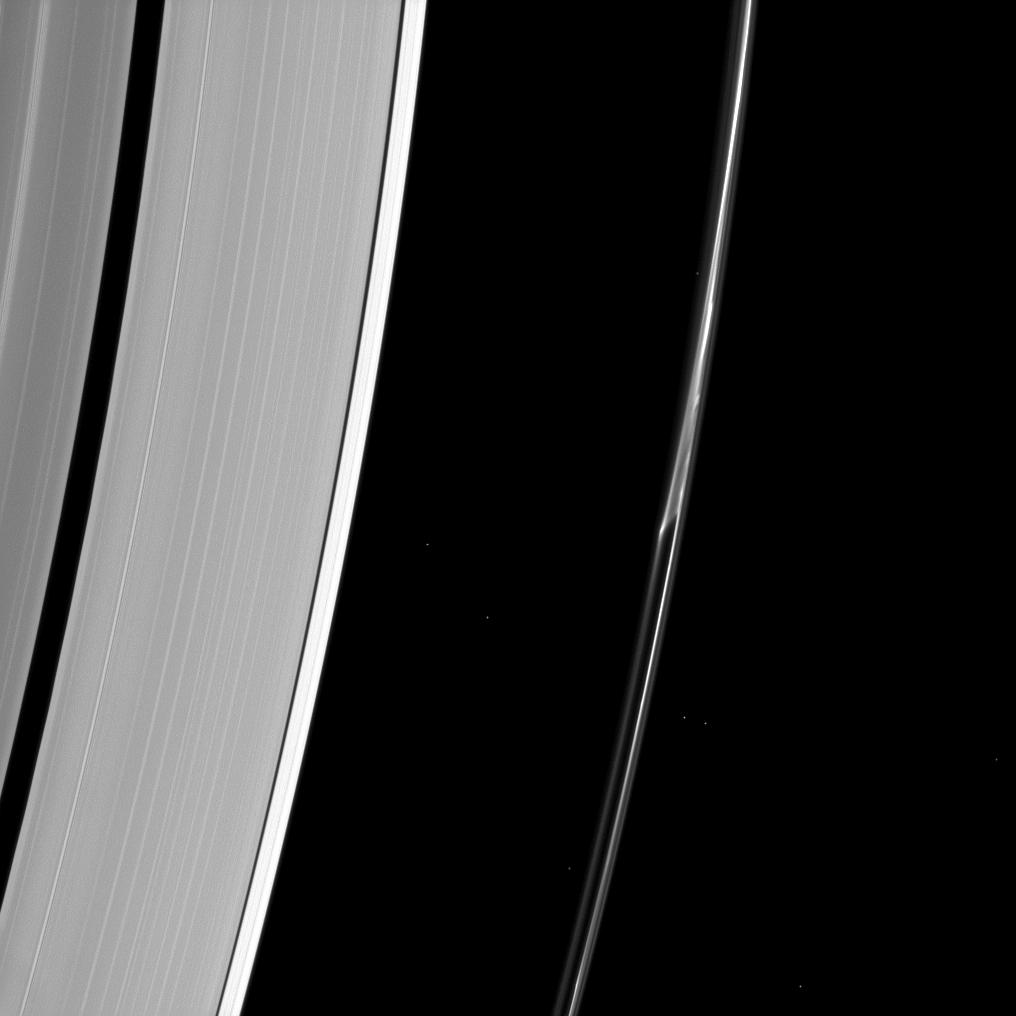
Saturn's F ring appears distorted in this October 2013 picture from the Cassini spacecraft. The twisting may be because the F ring is crashing repeatedly into a "single small object", NASA stated. Credit: NASA/JPL-Caltech/Space Science Institute
What’s up with this distortion? This picture from the Cassini spacecraft shows some kind of twist happening in the F ring of Saturn. Scientists in fact have seen other strange shapes in this delicate ring, indicating that something is disturbing it from time to time.
“Saturn’s F ring often appears to do things other rings don’t. In this Cassini spacecraft image, a strand of ring appears to separate from the core of the ring as if pulled apart by mysterious forces. Some ring scientists believe that this feature may be due to repeated collisions between the F ring and a single small object,” NASA stated this month.
There’s a debate in the scientific community about where the rings arose in the first place. “It’s been going back and forth for ages and it still goes back and forth. Are they old, or have they been there a long period of time? Are they new? I don’t know what to think, to be quite honest. I’m not being wishy-washy, I just don’t know what to think anymore,” Kevin Grazier, a planetary scientist with the Cassini mission for over 15 years, told Universe Today in December.
While this picture dates from October, you can check out Cassini images as they come in to NASA’s raw image database. Even in unprocessed form, the planet and its rings look beautiful — as you can clearly see in samples below.
The bulk of Saturn looms to the side of this shot of Saturn’s rings taken in February 2014 by the Cassini spacecraft. Credit: NASA/JPL/Space Science InstituteThe variety of Saturn’s rings is visible in this raw shot from the Cassini spacecraft taken in February 2014. Credit: NASA/JPL/Space Science InstituteAlthough Saturn’s rings look solid and substantial in images such as this, they are made up of many tiny, icy objects collecting as thin as 6.2 miles (10 kilometers) deep. Image taken by the Cassini spacecraft in February 2014. Credit: NASA/JPL/Space Science Institute
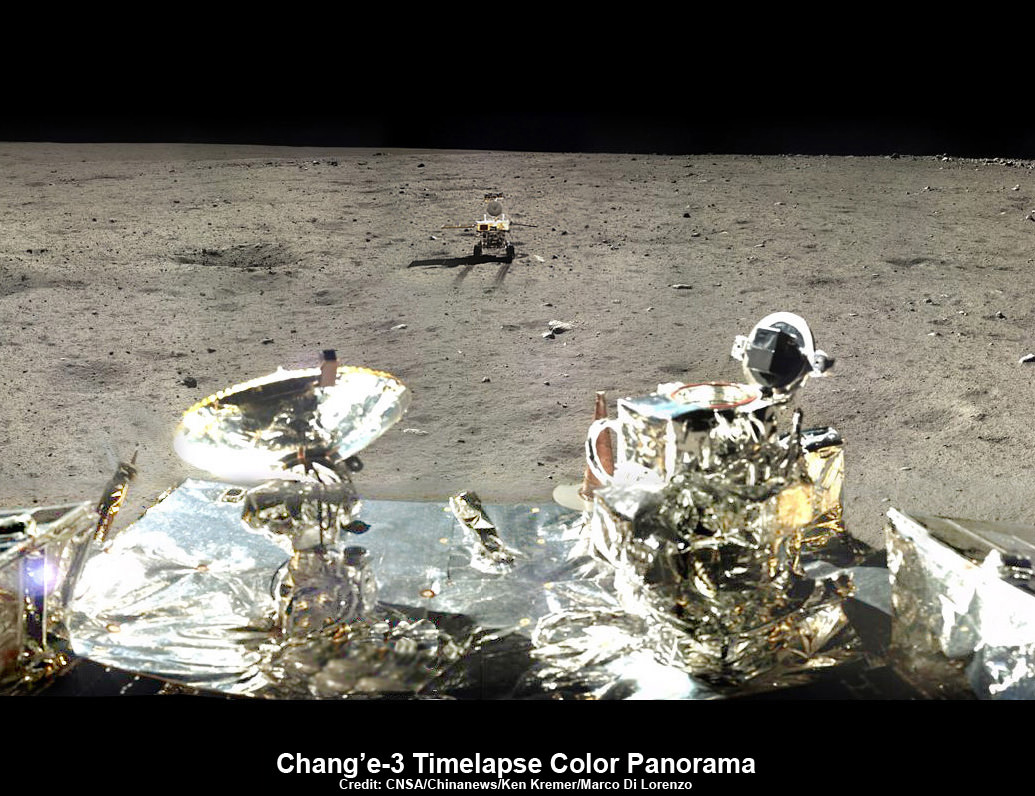
This composite view shows China’s Yutu rover heading south and away forever from the Chang’e-3 landing site about a week after the Dec. 14, 2013 touchdown at Mare Imbrium. This cropped view was taken from the 360-degree panorama. See complete 360 degree landing site panorama herein. Chang’e-3 landers extreme ultraviolet (EUV) camera is at right, antenna at left. Credit: CNSA/Chinanews/Ken Kremer/Marco Di Lorenzo – kenkremer.com. See our complete Yutu timelapse pano at NASA APOD Feb. 3, 2014: http://apod.nasa.gov/apod/ap140203.htm
Will Yutu Phone Home ?
This composite view shows China’s Yutu rover heading south and away forever from the Chang’e-3 landing site about a week after the Dec. 14, 2013 touchdown at Mare Imbrium. This cropped view was taken from the 360-degree timelapse panorama. See complete 360 degree landing site timelapse panorama below. Chang’e-3 landers extreme ultraviolet (EUV) camera is at right, antenna at left. Credit: CNSA/Chinanews/Ken Kremer/Marco Di Lorenzo – kenkremer.com
See our Yutu timelapse pano at NASA APOD Feb. 3, 2014:
http://apod.nasa.gov/apod/ap140203.html[/caption]
Will ‘Yutu’ phone home? Will Yutu live to see another Earthrise?
Those are the million dollar questions we’re all awaiting the answer to on pins and needles as Lunar Day 3 begins for China’s world famous ‘Yutu’ moon rover and Chang’e-3 lander, following a significant malfunction as night fell two weeks ago.
With the Sun due to rise over the Mare Imbrium landing site, China’s maiden pair of lunar probes are due to awaken at any moment now – and hopefully send good news.
Yutu – which means ‘Jade Rabbit’- and the mothership lander have been sleeping through the utterly frigid two week long lunar night since they entered their second hibernation period on Jan. 24th and 25th respectively, according to Chinese space agency officials.
To get a clear view of Yutu’s traverse across the Moon’s magnificently desolate gray plains, be sure to check out our timelapse panoramic mosaic showing the rover’s movements at three different positions around the stationary lander – above and below.
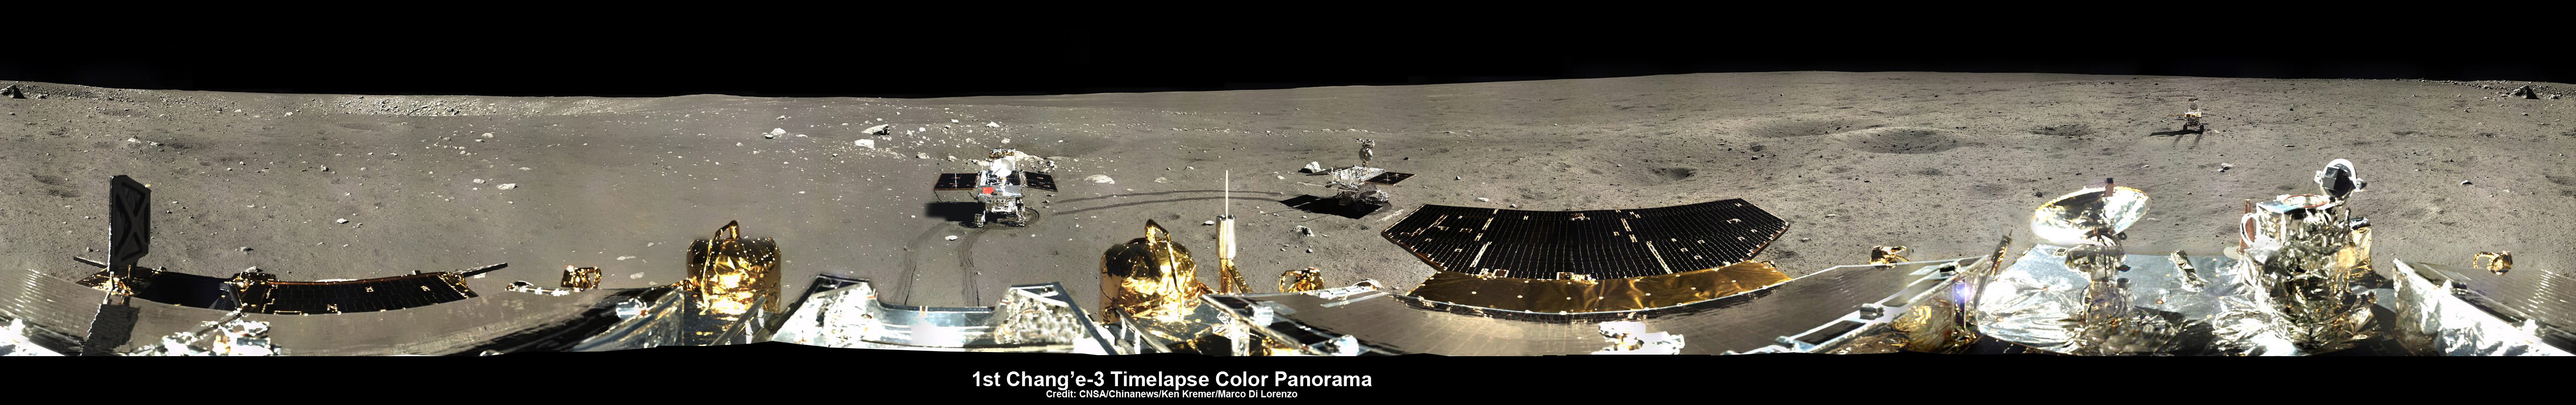
360-degree time-lapse color panorama from China’s Chang’e-3 lander
This 360-degree time-lapse color panorama from China’s Chang’e-3 lander shows the Yutu rover at three different positions during its trek over the Moon’s surface at its landing site from Dec. 15-22, 2013 during the 1st Lunar Day.
Credit: CNSA/Chinanews/Ken Kremer/Marco Di Lorenzo – kenkremer.com
See our Yutu timelapse pano at NASA APOD Feb. 3, 2014:
http://apod.nasa.gov/apod/ap140203.html
The 360 degree panorama by the imaging processing team of Ken Kremer and Marco Di Lorenzo was also newly featured on Astronomy Picture of the Day (APOD) on Feb 3, 2014.
However, as I reported earlier here, Yutu suffered a rather serious mechanical anomaly just as the sun was setting and causing China’s moon mission team to urgently sprang into action.
“Scientists are organizing repairs,” wrote the People’s Daily, the official government newspaper of China’s ruling Communist Party.
Apparently one of the solar panels did not fold back properly over Yutu’s instrument laden mast after it was lowered to the required horizontal position and into a warmed electronics box to shield and insulate it from the extremely frigid lunar night time temperatures.
The potentially deadly malfunction could spell doom for the unprotected mast mounted instruments and electronic systems, including the color and navigation cameras and the high gain antenna, if true.
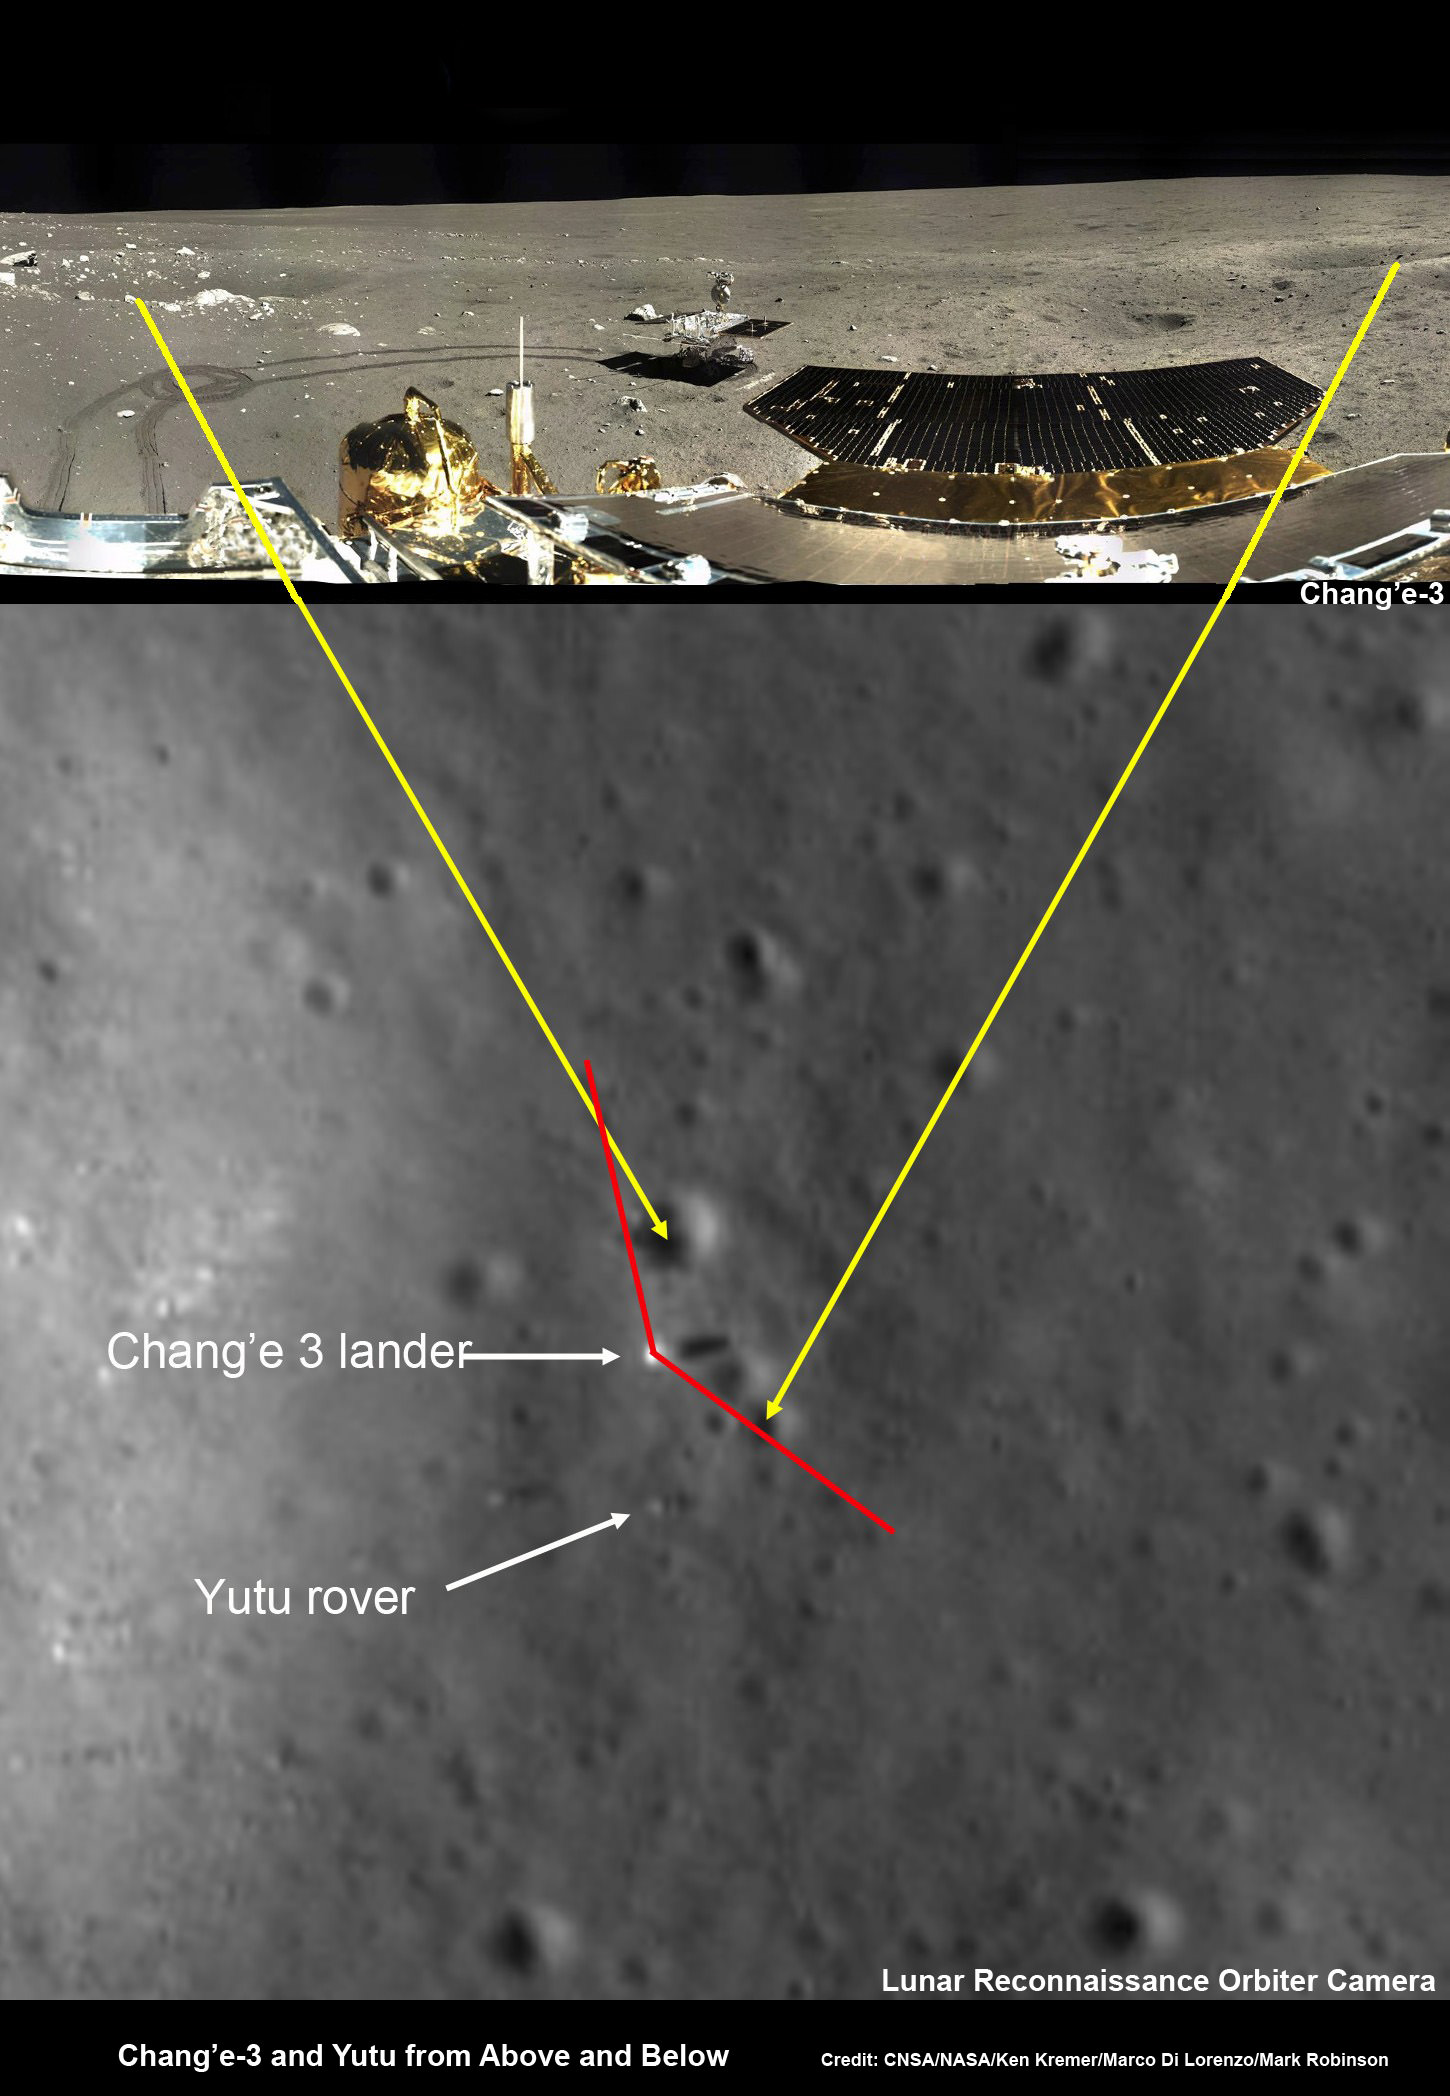
Chang’e-3 lander and Yutu rover – from Above And Below Composite view shows China’s Chang’e-3 lander and Yutu rover from Above And Below (orbit and surface) – lander color panorama (top) and orbital view from NASA’s LRO orbiter (bottom). Chang’e-3 lander color panorama shows Yutu rover after it drove down the ramp to the moon’s surface and began driving around the landers right side to the south. Yellow lines connect craters seen in the lander panorama and the LROC image from LRO (taken at a later date after the rover had moved), red lines indicate approximate field of view of the lander panorama. Credit: CNSA/NASA/Ken Kremer/Marco Di Lorenzo/Mark Robinson
During each 14 Earth-day long night, the Moon’s temperatures plunge dramatically to below minus 180 Celsius, or minus 292 degrees Fahrenheit.
A radioisotopic heater unit keeps the Mast instruments warm, during lunar night, in the absence of solar power.
Dust accumulation on the rover and gears may possibly be to blame for the failure to retract, based on unofficial accounts.
China has not released any official or detailed information on the cause of the malfunction or recovery actions taken by Chinese space engineers.
So, no one knows the ‘Jade Rabbits’ fate at this time.
‘Jade Rabbit’ has been immensely popular with the Chinese public.
Over 36,000 well wishes were posted on an unofficial Sina Weibo account shortly after word of the mechanical anomaly was announced.
Lunar Day 3 at Mare Imbrium was due to start around this past weekend Feb. 8 or 9.
Traverse Path of Yutu rover from Dec. 14 landing to Dec. 21, 2013. Landscape textured with Chang’e 3 imagery from space and ground. Credit: CNSA/BACC
An anonymous writer on Weibo, China’s twitter equivalent, reported; “We will hopefully get back news of the rabbit after sunrise today February 10 at 15:00 hrs (3 pm), Beijing local time, and confirm whether safe or unable to move.” That is according to a google translation I used.
Both vehicles depend on their life giving solar panels to produce power in order to function and accomplish their scientific tasks during each Lunar day which lasts approximately 14 days.
They had been functioning perfectly and collecting science measurement as planned during Lunar Day 2.
‘Jade Rabbit’ had departed the landing site forever, and was journeying southwards as the incident occurred – about six weeks into its planned 3 month long moon roving expedition.
In a historic feat for China, the Chang’e-3 spacecraft safely touched down on the Moon at Mare Imbrium near the Bay of Rainbows some two months ago on Dec. 14, 2013 .
Seven hours later, the piggybacked 140 kg Yutu robot drove off a pair of ramps, onto the Moon and into the history books.
The 1200 kg stationary lander is expected to return science data about the Moon and telescopic observations of the Earth and celestial objects for at least one year.
Chang’e-3 and Yutu landed on a thick deposit of volcanic material.
The hugely popular probes could be the forerunners to a manned Chinese Moon landing mission a decade from now.
China is only the 3rd country in the world to successfully soft land a spacecraft on Earth’s nearest neighbor after the United States and the Soviet Union.
Stay tuned here for Ken’s continuing Chang’e-3, Orion, Orbital Sciences, SpaceX, commercial space, LADEE, Mars and more planetary and human spaceflight news.
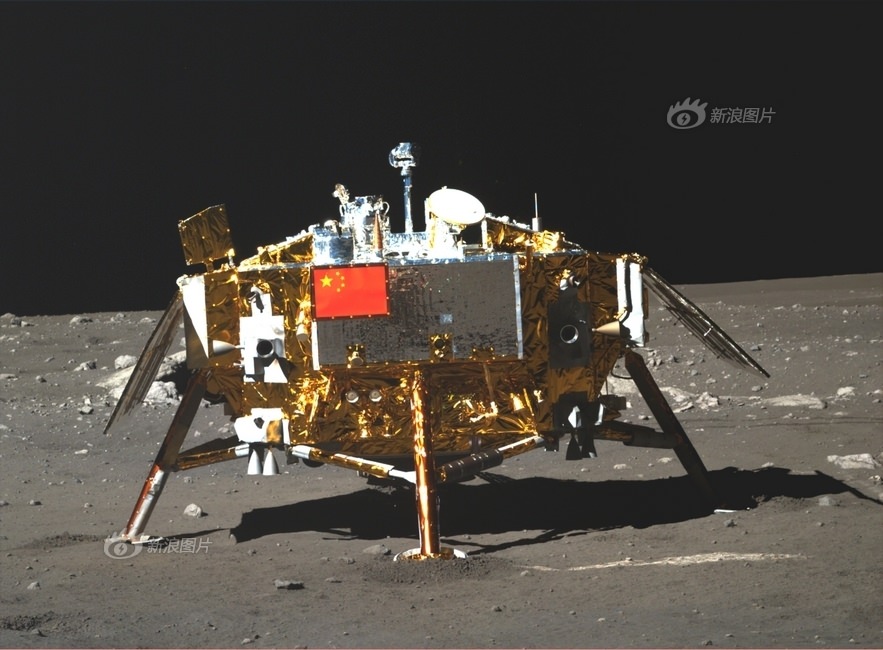
Photo of Chang’e-3 moon lander emblazoned with Chinese national flag taken by the panoramic camera on the Yutu moon rover on Dec. 22, 2013. Credit: CNSA