This dissolve animation compares the LRO image (geometrically corrected) of LADEE captured on Jan 14, 2014 with a computer-generated and labeled image of LADEE . LRO and LADEE are both NASA science spacecraft currently in orbit around the Moon. Credit: NASA/Goddard/Arizona State University
This dissolve animation compares the LRO image (geometrically corrected) of LADEE captured on Jan 14, 2014 with a computer-generated and labeled image of LADEE . LRO and LADEE are both NASA science spacecraft currently in orbit around the Moon. Credit: NASA/Goddard/Arizona State University
Story updated[/caption]
A pair of NASA spacecraft orbiting Earth’s nearest celestial neighbor just experienced a brief ‘Close Encounter of the Lunar Kind’.
Proof of the rare orbital tryst has now been revealed by NASA in the form of spectacular imagery (see above and below) just released showing NASA’s recently arrived Lunar Atmosphere and Dust Environment Explorer (LADEE) lunar orbiter being photographed by a powerful camera aboard NASA’s five year old Lunar Reconnaissance Orbiter (LRO) – as the two orbiters met for a fleeting moment just two weeks ago.
See above a dissolve animation that compares the LRO image (geometrically corrected) of LADEE captured on Jan. 14, 2014 with a computer-generated and labeled LADEE image.
All this was only made possible by a lot of very precise orbital calculations and a spacecraft ballet of sorts that had to be nearly perfectly choreographed and timed – and spot on to accomplish.
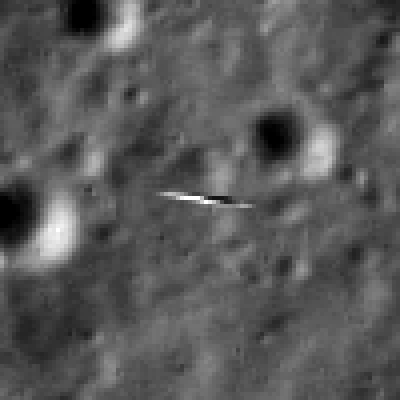
This subsection of the LRO image, expanded four times, shows the smeared view of LADEE against the lunar background. LADEE is about 2 meters in the long direction. Lunar scene about 81 meter wide. Credit: NASA/Goddard/Arizona State University
Both sister orbiters were speeding along at over 3600 MPH (1,600 meters per second) while traveling perpendicularly to one another!
So the glimpse was short but sweet.
LADEE flies in an equatorial orbit (east-to-west) while LRO travels in a polar orbit (south-to-north). LADEE achieved lunar orbit on Oct. 6, 2013 amidst the federal government shutdown.
Thus their orbits align only infrequently.
The LRO orbiter did a pirouette to precisely point its high resolution narrow angle camera (NAC) while hurtling along in lunar orbit, barely 5.6 miles (9 km) above LADEE.
And it was all over in less than the wink of an eye!
LADEE entered LRO’s Narrow Angle Camera (NAC) field of view for 1.35 milliseconds and a smeared image of LADEE was snapped. LADEE appears in four lines of the LROC image, and is distorted right-to-left.
Both spacecraft are tiny – barely two meters in length.
“Since LROC is a pushbroom imager, it builds up an image one line at a time, thus catching a target as small and fast as LADEE is tricky!” wrote Mark Robinson, LROC principal investigator of Arizona State University.
So the fabulous picture was only possible as a result of close collaboration and extraordinary teamwork between NASA’s LADEE, LRO and LROC camera mission operations teams.
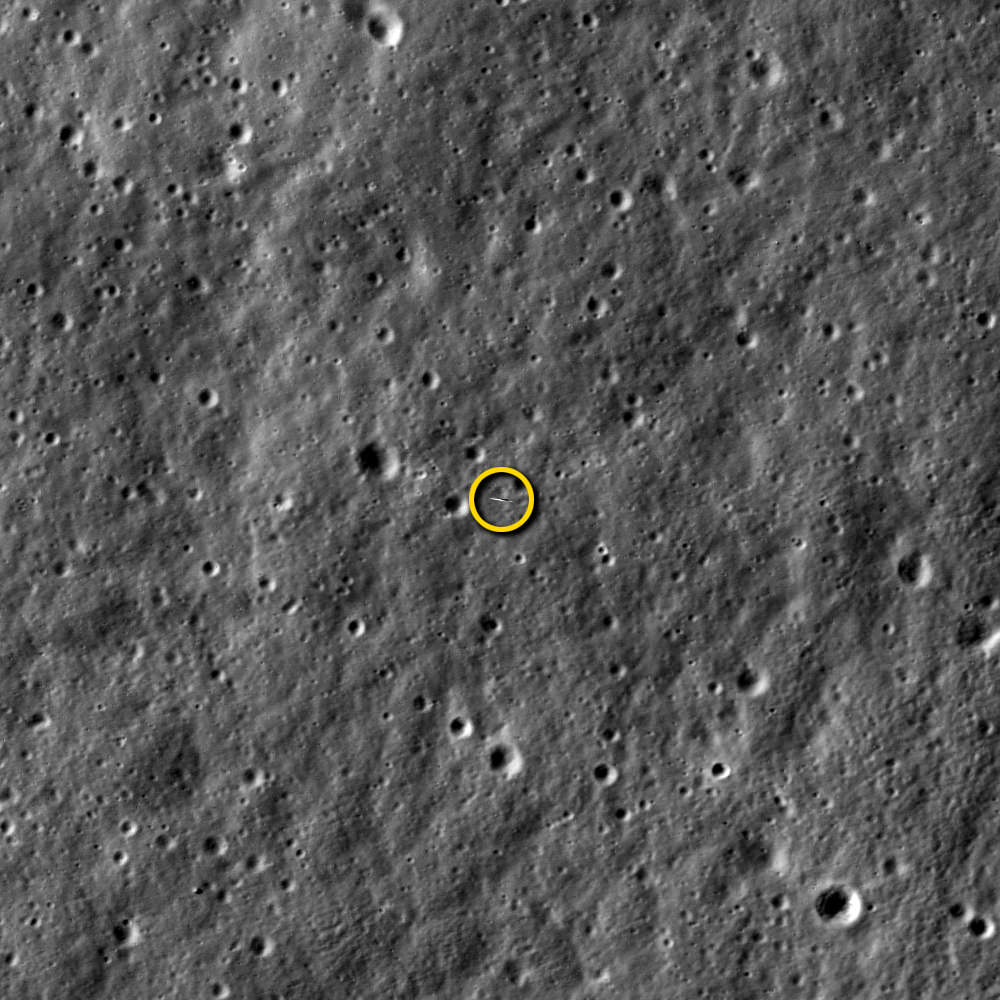
NASA’s LRO imaged NASA’s LADEE, about 5.6 miles (9 km) beneath it, at 8:11 p.m. EST on Jan. 14, 2014. (LROC NAC image M1144387511LR). Image width is 821 meters, or about 898 yards.) Credit: NASA/Goddard/Arizona State University
LADEE passed directly beneath the LRO orbit plane a few seconds before LRO crossed the LADEE orbit plane, meaning a straight down LROC image would have just missed LADEE, said NASA.
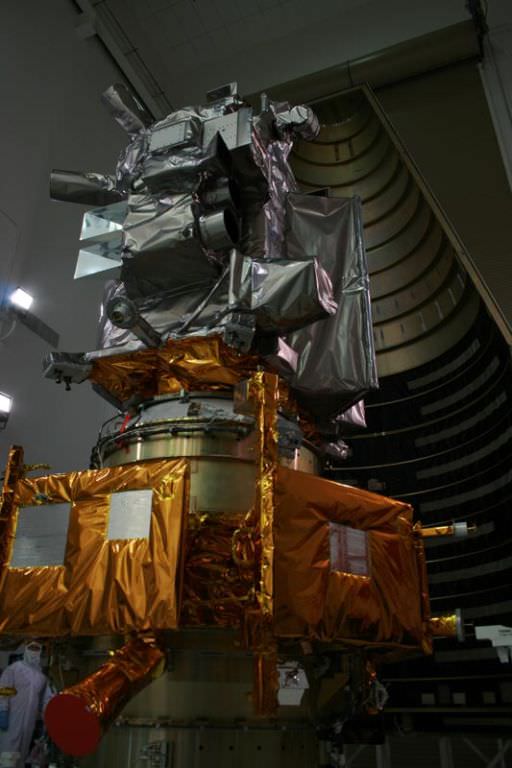
LRO spacecraft (top) protected by gray colored blankets is equipped with 7 science instruments located at upper right side of spacecraft. LRO cameras are pointing to right. LRO is piggybacked atop NASA’s LCROSS spacecraft. Payload fairing in background protects the spacecraft during launch and ascent. Credit: Ken Kremer
Therefore, LRO was rolled 34 degrees to the west so the LROC detector (one line) would be precisely oriented to catch LADEE as it passed beneath.
“Despite the blur it is possible to find details of the spacecraft. You can see the engine nozzle, bright solar panel, and perhaps a star tracker camera (especially if you have a correctly oriented schematic diagram of LADEE for comparison),” wrote Robinson in a description.
See the LADEE schematic in the lead image herein.
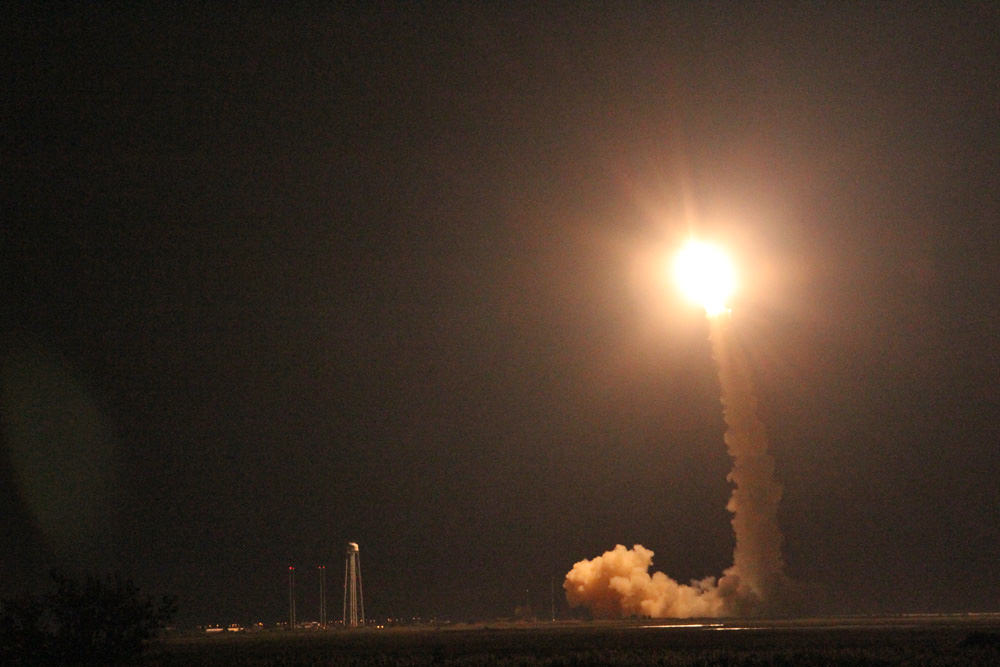
LADEE was launched Sept. 6, 2013 from NASA Wallops in Virginia on a science mission to investigate the composition and properties of the Moon’s pristine and extremely tenuous atmosphere, or exosphere, and untangle the mysteries of its lofted lunar dust.
Since LADEE is now more than halfway through its roughly 100 day long mission, timing was of the essence before the craft takes a death dive into the moon’s surface.
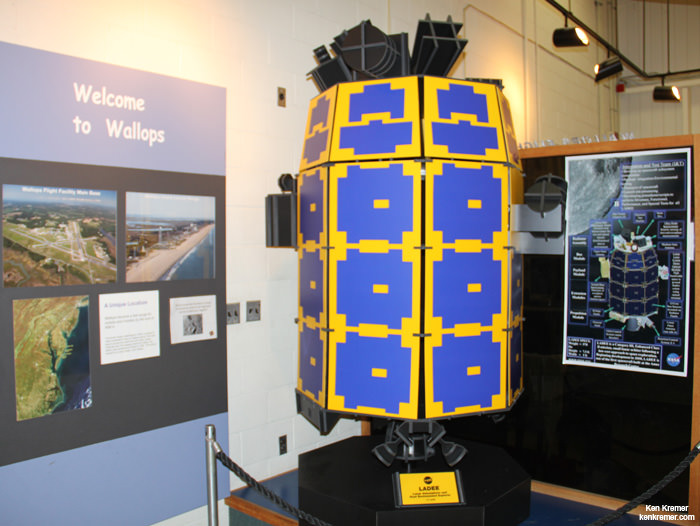
You can see a full scale model of LADEE at the NASA Wallops visitor center, which offers free admission.
Full scale model of NASA’s LADEE lunar orbiter on display at the free visitor center at NASA’s Wallops Flight Facility in Virginia. Credit: Ken Kremer/kenkremer.com
LRO launched Sept. 18, 2009 from Cape Canaveral, Florida to conduct comprehensive investigations of the Moon with seven science instruments and search for potential landing sites for a return by human explorers. It has collected astounding views of the lunar surface, including the manned Apollo landing sites as well as a treasure trove of lunar data.
In addition to NASA’s pair of lunar orbiters, China recently soft landed two probes on the Moon.
So be sure to read my new story detailing how LRO took some stupendous Christmas time 2013 images of China’s maiden lunar lander and rover; Chang’e-3 and Yutu from high above- here.
Stay tuned here for Ken’s continuing LADEE, Chang’e-3, Orion, Orbital Sciences, SpaceX, commercial space, Mars rover and more news.
Launch of NASA’s LADEE lunar orbiter on Friday night Sept. 6, at 11:27 p.m. EDT on the maiden flight of the Minotaur V rocket from NASA Wallops, Virginia, viewing site 2 miles away. Antares rocket launch pad at left. Credit: Ken Kremer/kenkremer.com
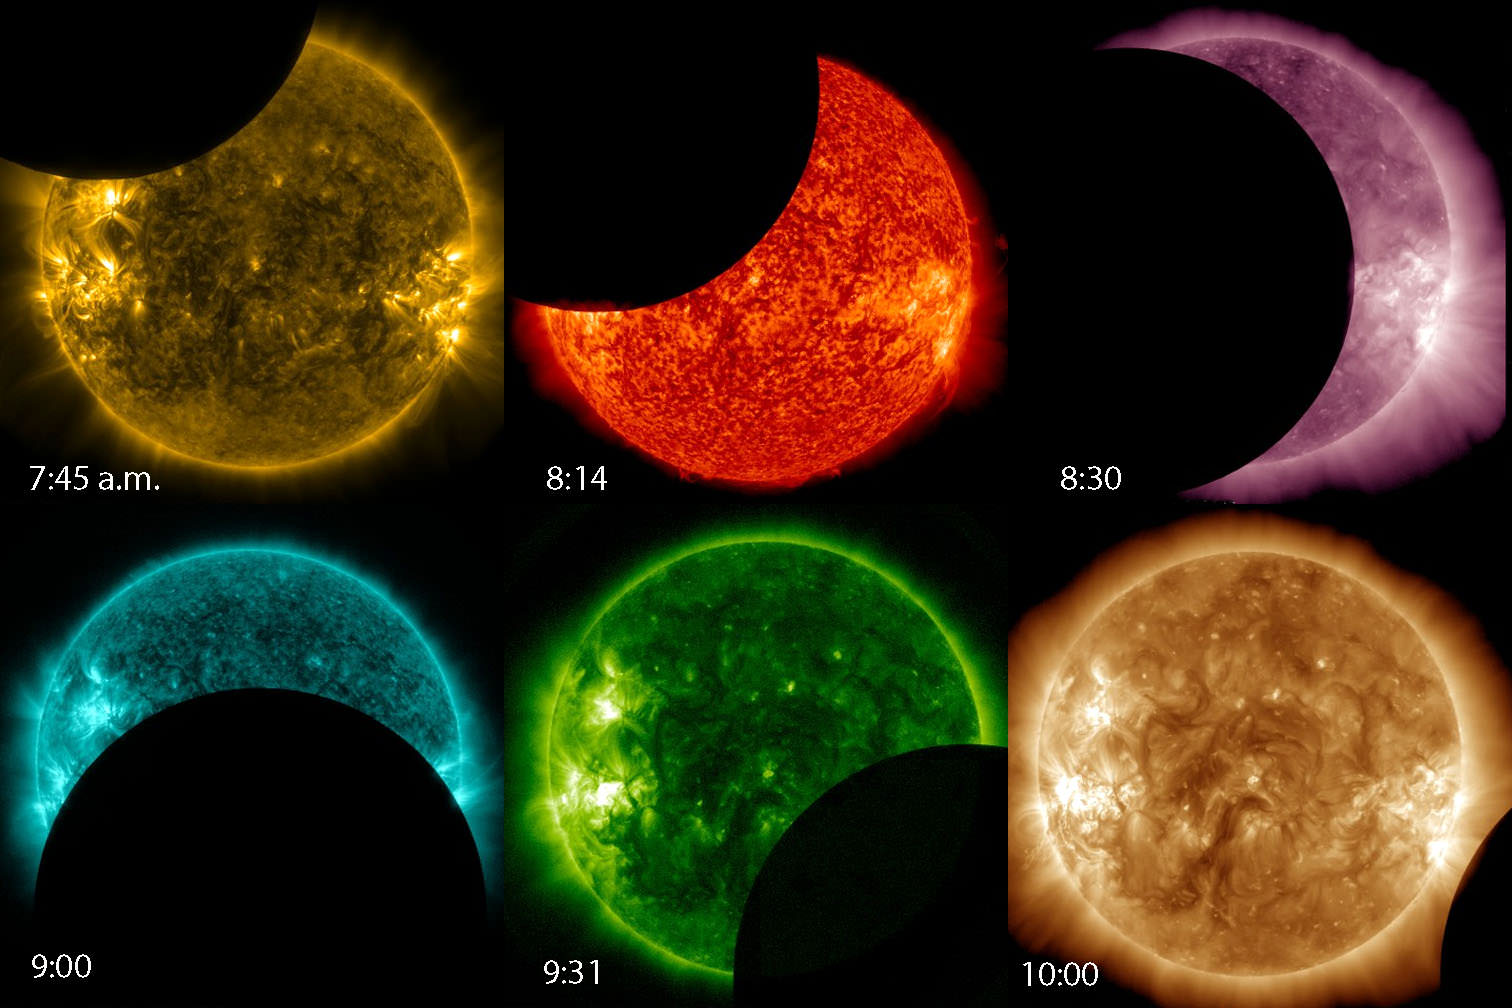
The sun seen in six different colors of wavelengths of light as the moon passed across from the perspective of NASA's Solar Dynamics Observatory this morning between about 7:30 and 10 a.m. CST. Credit: NASA
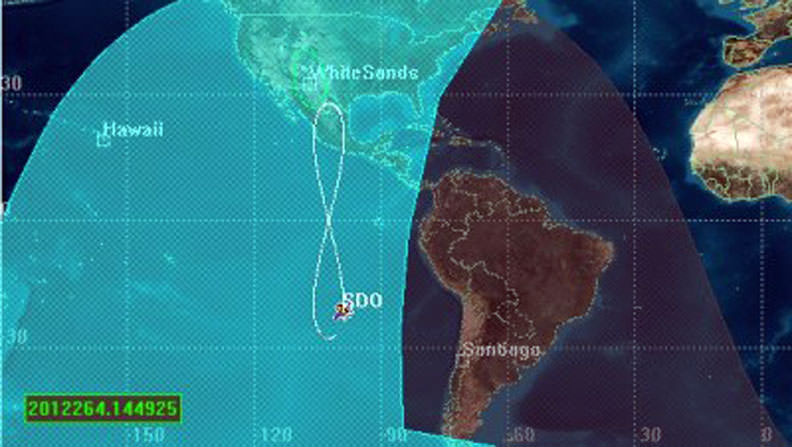
Call it the eclipse nobody saw. NASA’s Solar Dynamics Observatory (SDO) got its own private solar eclipse showing from its geosynchronous orbital perch today. Twice a year during new phase, the moon glides in front of the sun from the observatory’s perspective. Although we can’t be there in person to see it, the remote view isn’t too shabby. The events are called lunar transits rather than eclipses since they’re seen from outer space. Transits typically last about a half hour, but at 2.5 hours, today’s was one of the longest ever recorded. The next one occurs on July 26, 2014.
Today’s lunar transit of the sun followed by a strong solar flare
When an eclipse ends, the fun is usually over, but not this time. Just as the moon slid off the sun’s fiery disk, a strong M6.6 solar flare exploded from within a new, very active sunspot group rounding the eastern limb and blasted a CME (coronal mass ejection) into space. What a show!
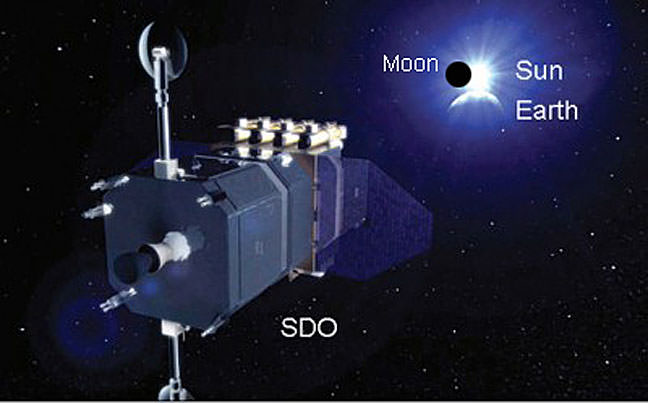
Approximate view of the moon transiting the sun from SDO’s viewpoint. To make sure SDO didn’t run down its batteries when the sun was blocked, mission control juiced them up beforehand. Credit: NASA
SDO circles Earth in a geosynchronous orbit about 22,000 miles high and photographs the sun continuously day and night from a vantage point high above Mexico and the Pacific Ocean. About 1.5 terabytes of solar data or the equivalent of half a million songs from iTunes are downloaded to antennas in White Sands, New Mexico every day.
For comparison, the space station, which orbits much closer to Earth, would make a poor solar observatory, since Earth blocks the sun for half of every 90 minute orbit.
When you look at the still pictures and video, notice how distinct the edge of the moon appears. With virtually no atmosphere, the moon takes a “sharp” bite out of the sun.
SDO orbits about 22,000 miles above Earth, tracing out a figure-8 (called an analemma) above the Pacific and Mexico every 24 hours. Credit: NASA Read more: http://www.universetoday.com/#ixzz2ruidvZJ5
SDO amazes with its spectacular pictures of the sun taken in 10 different wavelengths of light every 10 seconds; additional instruments study vibrations on the sun’s surface, magnetic fields and how much UV radiation the sun pours into space.
Compared to all the hard science, the twice a year transits are a sweet side benefit much like the cherries topping a sundae.
You can make your own movie of today’s partial eclipse by visiting the SDO websiteand following these easy steps:
* Click on the Data tab and select AIA/HMI Browse Data
* Click on the Enter Start Date window, select a start date and time and click Done
* Click on Enter End Date and click Done
* Under Telescopes, pick the color (wavelength) sun you want
* Select View in the display box
* Click Submit at the bottom and watch a video of your selected pictures
Artist's conception of asteroids and a gas giant planet. Credit: Harvard-Smithsonian Center for Astrophysics
We at Universe Today have snow on our minds these days with all this Polar Vortex talk. From out the window, the snowflakes all look the same, but peer at flakes under a microscope and you can see all these different designs pop up. Turns out that our asteroid belt between Mars and Jupiter is also much more diverse than previously believed, all because astronomers took the time to do a detailed survey.
Here’s the interesting thing: the diversity, the team says, implies that Earth-like planets would be hard to find, which could be a blow for astronomers seeking an Earth 2.0 somewhere out in the universe if other research agrees.
To jump back a couple of steps, there’s a debate about how water arose on Earth. One theory is that back billions of years ago when the solar system was settling into its current state — a time when planetesimals were crashing into each other constantly and the larger planets possibly migrated between different orbits — comets and asteroids bearing water crashed into a proto-Earth.
Artist’s conception of asteroids or comets bearing water to a proto-Earth. Credit: Harvard-Smithsonian Center for Astrophysics
“If true, the stirring provided by migrating planets may have been essential to bringing those asteroids,” the astronomers stated in a press release. “This raises the question of whether an Earth-like exoplanet would also require a rain of asteroids to bring water and make it habitable. If so, then Earth-like worlds might be rarer than we thought.”
To take this example further, the researchers found that the asteroid belt comes from a mix of locations around the solar system. Well, a model the astronomers cite shows that Jupiter once migrated much closer to the sun, basically at the same distance as where Mars is now.
When Jupiter migrated, it disturbed everything in its wake and possibly removed as much as 99.9 per cent of the original asteroid population. And other planet migrations in general threw in rocks from everywhere into the asteroid belt. This means the origin of water in the belt could be more complicated than previously believed.
You can read more details of the survey in the journal Nature. Data was gathered from the Sloan Digital Sky Survey and the research was led by Francesca DeMeo, a Hubble postdoctoral fellow at the Harvard-Smithsonian Center for Astrophysics.
NASA astronaut candidate Christina Hammock starts a fire successfully during wilderness survival training near
Rangeley, Maine in August 2013. Credit: NASA/Lauren Harnett
You sure couldn’t hide those grins on television from the Astronaut Candidate Class of 2013 when the call came from the International Space Station.
NASA’s latest recruits were at the Smithsonian National Air and Space Museum in Washington, D.C. at an event today (Thursday) for students. Amid the many youngster questions to Expedition 38 astronauts Mike Hopkins and Rick Mastracchio, astronaut candidate Jessica Meir managed one of her own: was the wait worth it?
Hovering in front of the camera, four-time flyer Mastracchio vigorously shook his hand “no” to laughter from the audience. Hopkins answered her more seriously: “It is definitely worth it. It is the most amazing experience I think you can ever have. Floating is just truly incredible; it just never gets old.”
Minutes later, Hopkins demonstrated a “stupid astronaut trick”: doing Road Runner-style sprinting in place in mid-air. The laughing crew signed off — “So they’re floating off now?” asked event moderator and veteran astronaut Leland Melvin — and the new class had the chance to answer questions of their own.
While the class expressed effusive delight at being astronauts — they were hired last year, so the feeling is quite new to them — Meir said that there was some sadness at leaving the careers they had before. As a recent article in Air&Space Smithsonian pointed out, this class will have several years to wait for a seat into space because there aren’t robust shuttle crews of seven people going up several times a year any more. The Soyuz only carries three people at a time, and there are fewer missions that last for a longer time.
There also is some ambiguity about where the astronauts will go. The International Space Station has been extended until at least 2024, but astronaut candidate Anne McClain added today that an asteroid or Mars are other things being considered for their class. “This class is such an exciting time to be at NASA,” she said.
Other questions asked of the class at the event include who is going to go in space first, and from a wee future astronaut, which planet they’d prefer to go to. You can watch the whole broadcast on the link above.
Two views of the brown dwarf map for Luhman 16B. Image credit: ESO/I. Crossfield
By now, you will probably have heard that astronomers have produced the first global weather map for a brown dwarf. (If you haven’t, you can find the story here.) May be you’ve even built the cube model or the origami balloon model of the surface of the brown dwarf Luhman 16B the researchers provided (here).
Since one of my hats is that of public information officer at the Max Planck Institute for Astronomy, where most of the map-making took place, I was involved in writing a press release about the result. But one aspect that I found particularly interesting didn’t get much coverage there. It’s that this particular bit of research is a good example of how fast-paced astronomy can be these days, and, more generally, it shows how astronomical research works. So here’s a behind-the-scenes look – a making-of, if you will – for the first brown dwarf surface map (see image on the right).
As in other sciences, if you want to be a successful astronomer, you need to do something new, and go beyond what’s been done before. That, after all, is what publishable new results are all about. Sometimes, such progress is driven by larger telescopes and more sensitive instruments becoming available. Sometimes, it’s about effort and patience, such as surveying a large number of objects and drawing conclusion from the data you’ve won.
Ingenuity plays a significant role. Think of the telescopes, instruments and analytical methods developed by astronomers as the tools in a constantly growing tool box. One way of obtaining new results is to combine these tools in new ways, or to apply them to new objects.
That’s why our opening scene is nothing special in astronomy: It shows Ian Crossfield, a post-doctoral researcher at the Max Planck Institute for Astronomy, and a number of colleagues (including institute director Thomas Henning) in early March 2013, discussing the possibility of applying one particular method of mapping stellar surfaces to a class of objects that had never been mapped in this way before.
The method is called Doppler imaging. It makes use of the fact that light from a rotating star is slightly shifted in frequency as the star rotates. As different parts of the stellar surfaces go by, whisked around by the star’s rotation, the frequency shifts vary slightly different depending on where the light-emitting region is located on the star. From these systematic variations, an approximate map of the stellar surface can be reconstructed, showing darker and brighter areas. Stars are much too distant for even the largest current telescopes to discern surface details, but in this way, a surface map can be reconstructed indirectly.
The method itself isn’t new. The basic concept was invented in the late 1950s, and the 1980s saw several applications to bright, slowly rotating stars, with astronomers using Doppler imaging to map those stars’ spots (dark patches on a stellar surface; the stellar analogue to Sun spots).
Crossfield and his colleagues were wondering: Could this method be applied to a brown dwarf – an intermediary between planet and star, more massive than a planet, but with insufficient mass for nuclear fusion to ignite in the object’s core, turning it into a star? Sadly, some quick calculations, taking into account what current telescopes and instruments can and cannot do as well as the properties of known brown dwarfs, showed that it wouldn’t work.
The available targets were too faint, and Doppler imaging needs lots of light: for one because you need to split the available light into the myriad colors of a spectrum, and also because you need to take many different rather short measurements – after all, you need to monitor how the subtle frequency shifts caused by the Doppler effect change over time.
So far, so ordinary. Most discussions of how to make observations of a completely new type probably come to the conclusion that it cannot be done – or cannot be done yet. But in this case, another driver of astronomical progress made an appearance: The discovery of new objects.
Kevin Luhman discovered the brown dwarf pair in data from NASA’s Wide-field Infrared Survey Explorer (WISE; artist’s impression). Image: NASA/JPL-Caltech
On March 11, Kevin Luhman, an astronomer at Penn State University, announced a momentous discovery: Using data from NASA’s Wide-field Infrared Survey Explorer (WISE), he had identified a system of two brown dwarfs orbiting each other. Remarkably, this system was at a distance of a mere 6.5 light-years from Earth. Only the Alpha Centauri star system and Barnard’s star are closer to Earth than that. In fact, Barnard’s star was the last time an object was discovered to be that close to our Solar system – and that discovery was made in 1916.
Modern astronomers are not known for coming up with snappy names, and the new object, which was designated WISE J104915.57-531906.1, was no exception. To be fair, this is not meant to be a real name; it’s a combination of the discovery instrument WISE with the system’s coordinates in the sky. Later, the alternative designation “Luhman 16AB” for the system was proposed, as this was the 16th binary system discovered by Kevin Luhman, with A and B denoting the binary system’s two components.
These days, the Internet gives the astronomical community immediate access to new discoveries as soon as they are announced. Many, probably most astronomers begin their working day by browsing recent submissions to astro-ph, the astrophysical section of the arXiv, an international repository of scientific papers. With a few exceptions – some journals insist on exclusive publication rights for at least a while –, this is where, in most cases, astronomers will get their first glimpse of their colleagues’ latest research papers.
Luhman posted his paper “Discovery of a Binary Brown Dwarf at 2 Parsecs from the Sun” on astro-ph on March 11. For Crossfield and his colleagues at MPIA, this was a game-changer. Suddenly, here was a brown dwarf for which Doppler imaging could conceivably work, and yield the first ever surface map of a brown dwarf.
However, it would still take the light-gathering power of one of the largest telescopes in the world to make this happen, and observation time on such telescopes is in high demand. Crossfield and his colleagues decided they needed to apply one more test before they would apply. Any object suitable for Doppler imaging will flicker ever so slightly, growing slightly brighter and darker in turn as brighter or darker surface areas rotate into view. Did Luhman 16A or 16B flicker – in astronomer-speak: did one of them, or perhaps both, show high variability?
Astronomy comes with its own time scales. Communication via the Internet is fast. But if you have a new idea, then ordinarily, you can’t just wait for night to fall and point your telescope accordingly. You need to get an observation proposal accepted, and this process takes time – typically between half a year and a year between your proposal and the actual observations. Also, applying is anything but a formality. Large facilities, like the European Southern Observatory’s Very Large Telescopes, or space telescopes like the Hubble, typically receive applications for more than 5 times the amount of observing time that is actually available.
But there’s a short-cut – a way for particularly promising or time-critical observing projects to be completed much faster. It’s known as “Director’s Discretionary Time”, as the observatory director – or a deputy – are entitled to distribute this chunk of observing time at their discretion.
To monitor Luhman 16A and B’s brightness flucutations, Beth Biller used the MPG/ESO 2.2. meter telescope at ESO’s La Silla Observatory. Image credit: ESO/José Francisco Salgado (josefrancisco.org)
On April 2, Beth Biller, another MPIA post-doc (she is now at the University of Edinburgh), applied for Director’s Discretionary Time on the MPG/ESO 2.2 m telescope at ESO’s La Silla observatory in Chile. The proposal was approved the same day.
Biller’s proposal was to study Luhman 16A and 16B with an instrument called GROND. The instrument had been developed to study the afterglows of powerful, distant explosions known as gamma ray bursts. With ordinary astronomical objects, astronomers can take their time. These objects will not change much over the few hours an astronomer makes observations, first using one filter to capture one range of wavelengths (think “light of one color”), then another filter for another wavelength range. (Astronomical images usually capture one range of wavelengths – one color – at a time. If you look at a color image, it’s usually the result of a series of observations, one color filter at a time.)
Gamma ray bursts and other transient phenomena are different. Their properties can change on a time scale of minutes, leaving no time for consecutive observations. That is why GROND allows for simultaneous observations of seven different colors.
Biller had proposed to use GROND’s unique capability for recording brightness variations for Luhman 16A and 16B in seven different colors simultaneously – a kind of measurement that had never been done before at this scale. The most simultaneous information researchers had gotten from a brown dwarf had been at two different wavelengths (work by Esther Buenzli, then at the University of Arizona’s Steward Observatory, and colleagues). Biller was going for seven. As slightly different wavelength regimes contain information about gas at slightly different colors, such measurements promised insight into the layer structure of these brown dwarfs – with different temperatures corresponding to different atmospheric layers at different heights.
For Crossfield and his colleagues – Biller among them –, such a measurement of brightness variations should also show whether or not one of the brown dwarfs was a good candidate for Doppler imaging.
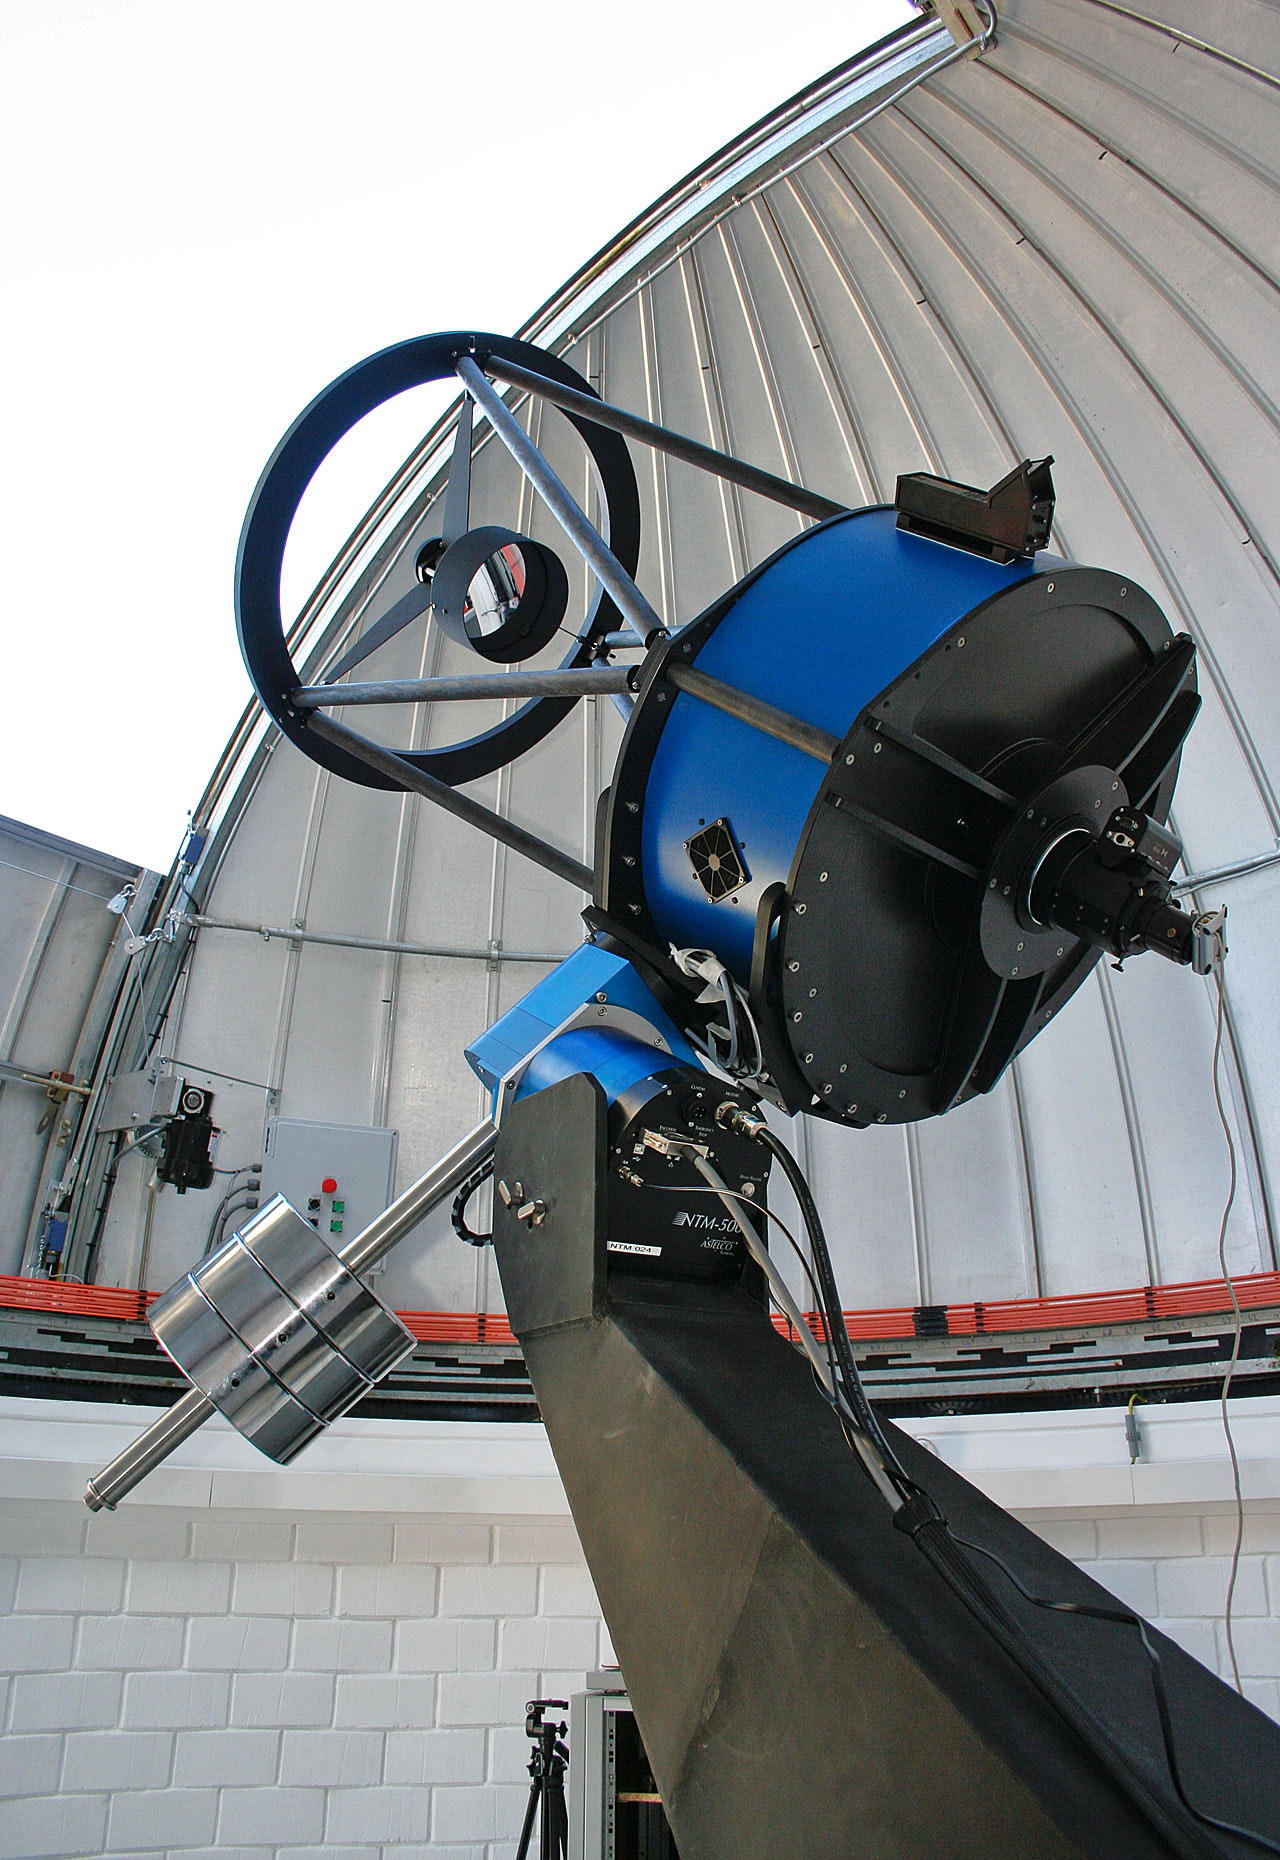
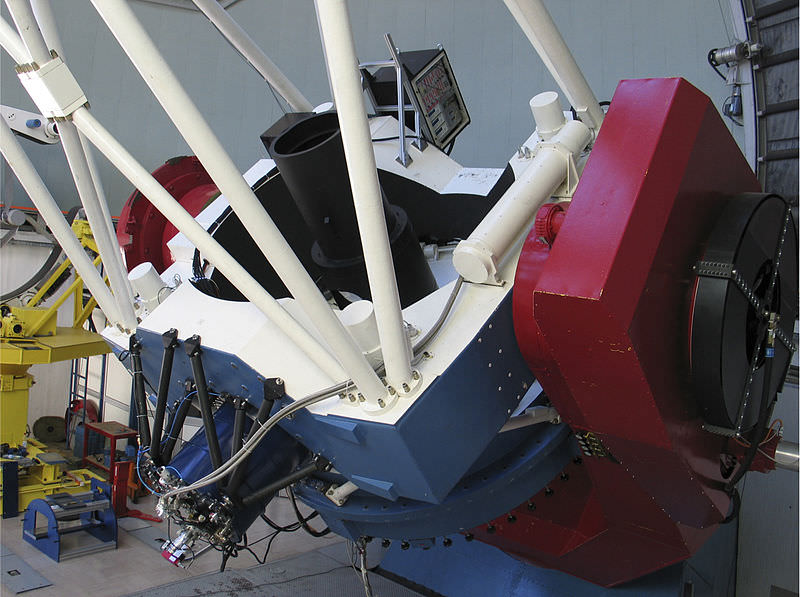
The robotic telescope TRAPPIST, also at ESO’s La Silla observatory, was the first to find brightness fluctuations of the brown dwarf Luhman 16B.
As it turned out, they didn’t even have to wait that long. A group of astronomers around Michaël Gillon had pointed the small robotic telescope TRAPPIST, designed for detecting exoplanets by the brightness variations they cause when passing between their host star and an observer on Earth, to Luhman 16AB. The same day that Biller had applied for observing time, and her application been approved, the TRAPPIST group published a paper “Fast-evolving weather for the coolest of our two new substellar neighbours”, charting brightness variations for Luhman 16B.
This news caught Crossfield thousands of miles from home. Some astronomical observations do not require astronomers to leave their cozy offices – the proposal is sent to staff astronomers at one of the large telescopes, who make the observations once the conditions are right and send the data back via Internet. But other types of observations do require astronomers to travel to whatever telescope is being used – to Chile, say, to or to Hawaii.
When the brightness variations for Luhman 16B were announced, Crossfield was observing in Hawaii. He and his colleagues realized right away that, given the new results, Luhman 16B had moved from being a possible candidate for the Doppler imaging technique to being a promising one. On the flight from Hawaii back to Frankfurt, Crossfield quickly wrote an urgent observing proposal for Director’s Discretionary Time on CRIRES, a spectrograph installed on one of the 8 meter Very Large Telescopes (VLT) at ESO’s Paranal observatory in Chile, submitting his application on April 5. Five days later, the proposal was accepted.
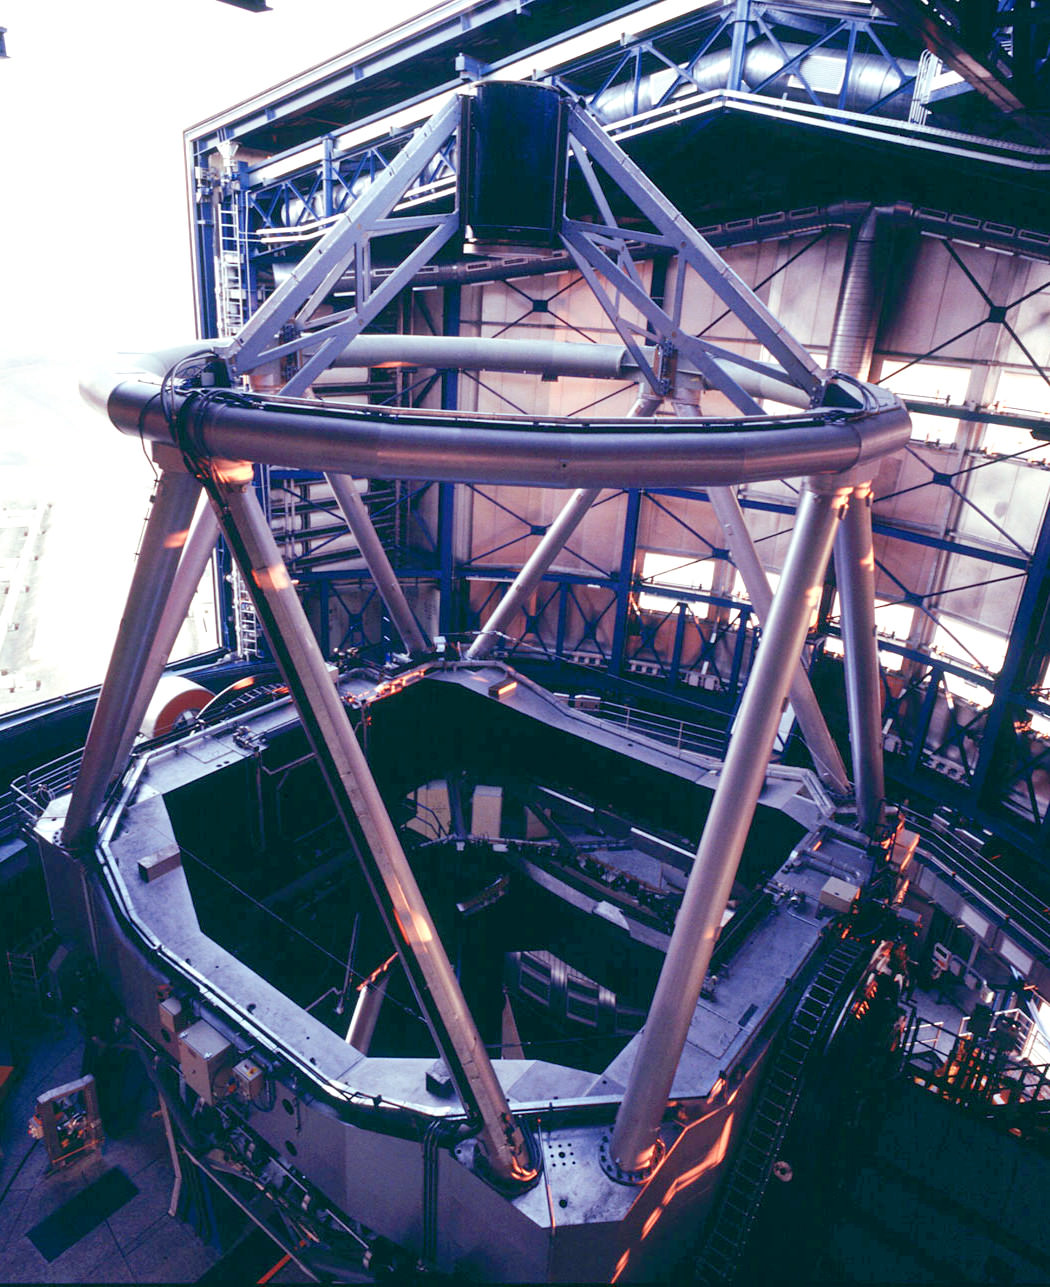
Antu, the first of the four 8 meter Unit Telescopes (UTs) of the Very Large Telescope (VLT) shortly after installation in 2000. Image: ESO
On May 5, the giant 8 meter mirror of Antu, one of the four Unit Telescopes of the Very Large Telescope, turned towards the Southern constellation Vela (the “Sail of the Ship”). The light it collected was funneled into CRIRES, a high-resolution infrared spectrograph that is cooled down to about -200 degrees Celsius (-330 Fahrenheit) for better sensitivity.
Three and two weeks earlier, respectively, Biller’s observations had yielded rich data about the variability of both the brown dwarfs in the intended seven different wavelength bands.
At this point, no more than two months had passed between the original idea and the observations. But paraphrasing Edison’s famous quip, observational astronomy is 1% observation and 99% evaluation, as the raw data are analyzed, corrected, compared with models and inferences made about the properties of the observed objects.
For Beth Biller’s multi-wavelength monitoring of brightness variations, this took about five months. In early September, Biller and 17 coauthors, Crossfield and numerous other MPIA colleagues among them, submitted their article to the Astrophysical Journal Letters (ApJL) after some revisions, it was accepted on October 17. From October 18 onward, the results were accessible online at astro-ph, and a month later they were published on the ApJL website.
In late September, Crossfield and his colleagues had finished their Doppler imaging analysis of the CRIRES data. Results of such an analysis are never 100% certain, but the astronomers had found the most probable structure of the surface of Luhman 16B: a pattern of brighter and darker spots; clouds made of iron and other minerals drifting on hydrogen gas.
As is usual in the field, the text they submitted to the journal Nature was sent out to a referee – a scientist, who remains anonymous, and who gives recommendations to the journal’s editors whether or not a particular article should be published. Most of the time, even for an article the referee thinks should be published, he or she has some recommendations for improvement. After some revisions, Nature accepted the Crossfield et al. article in late December 2013.
With Nature, you are only allowed to publish the final, revised version on astro-ph or similar servers no less than 6 month after the publication in the journal. So while a number of colleagues will have heard about the brown dwarf map on January 9 at a session at the 223rd Meeting of the American Astronomical Society, in Washington, D.C., for the wider astronomical community, the online publication, on January 29, 2014, will have been the first glimpse of this new result. And you can bet that, seeing the brown dwarf map, a number of them will have started thinking about what else one could do. Stay tuned for the next generation of results.
And there you have it: 10 months of astronomical research, from idea to publication, resulting in the first surface map of a brown dwarf (Crossfield et al.) and the first seven-wavelength-bands-study of brightness variations of two brown dwarfs (Biller et al.). Taken together, the studies provide fascinating image of complex weather patterns on an object somewhere between a planet and a star the beginning of a new era for brown dwarf study, and an important step towards another goal: detailed surface maps of giant gas planets around other stars.
On a more personal note, this was my first ever press release to be picked up by the Weather Channel.
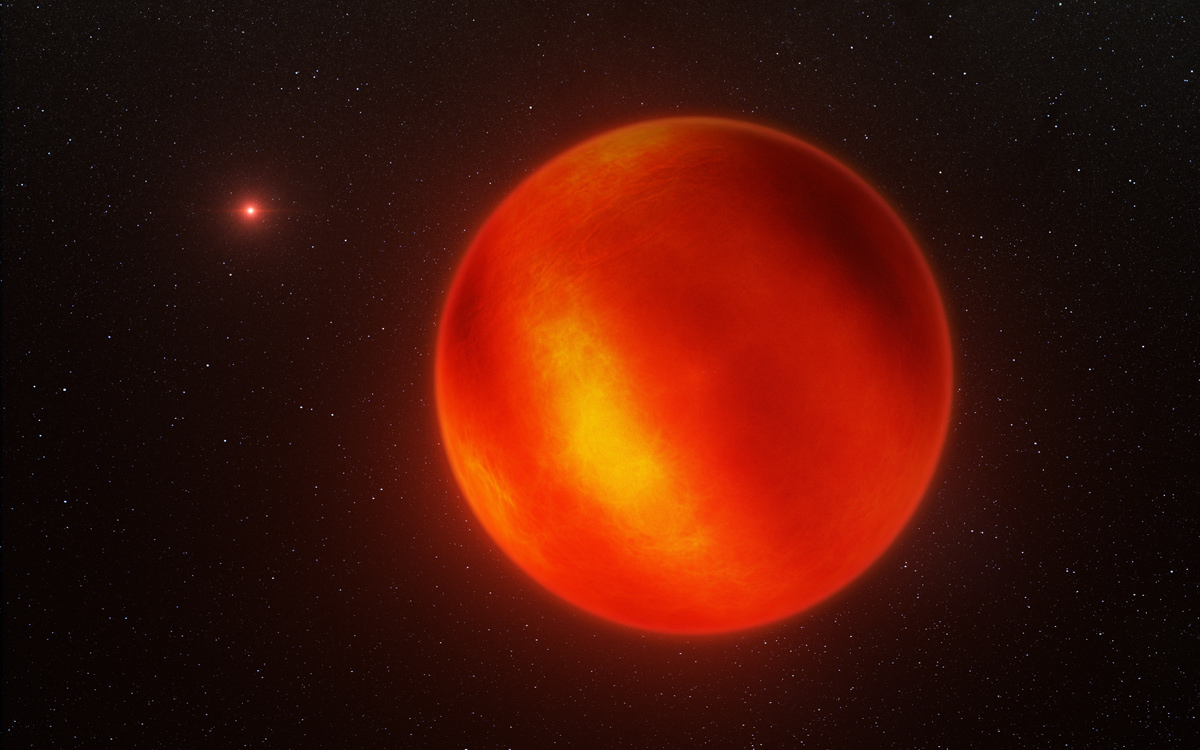
Think the weather is nasty this winter here on Earth? Try vacationing on the brown dwarf Luhman 16B sometime.
Two studies out this week from the Max Planck Institute for Astronomy based at Heidelberg, Germany offer the first look at the atmospheric features of a brown dwarf.
A brown dwarf is a substellar object which bridges the gap between at high mass planet at over 13 Jupiter masses, and a low mass red dwarf star at above 75 Jupiter masses. To date, few brown dwarfs have been directly imaged. For the study, researchers used the recently discovered brown dwarf pair Luhman 16A & B. At about 45(A) and 40(B) Jupiter masses, the pair is 6.5 light years distant and located in the constellation Vela. Only Alpha Centauri and Barnard’s Star are closer to Earth. Luhman A is an L-type brown dwarf, while the B component is a T-type substellar object.
“Previous observations have inferred that brown dwarfs have mottled surfaces, but now we can start to directly map them.” Ian Crossfield of the Max Planck Institute for Astronomy said in this week’s press release. “What we see is presumably patchy cloud cover, somewhat like we see on Jupiter.”
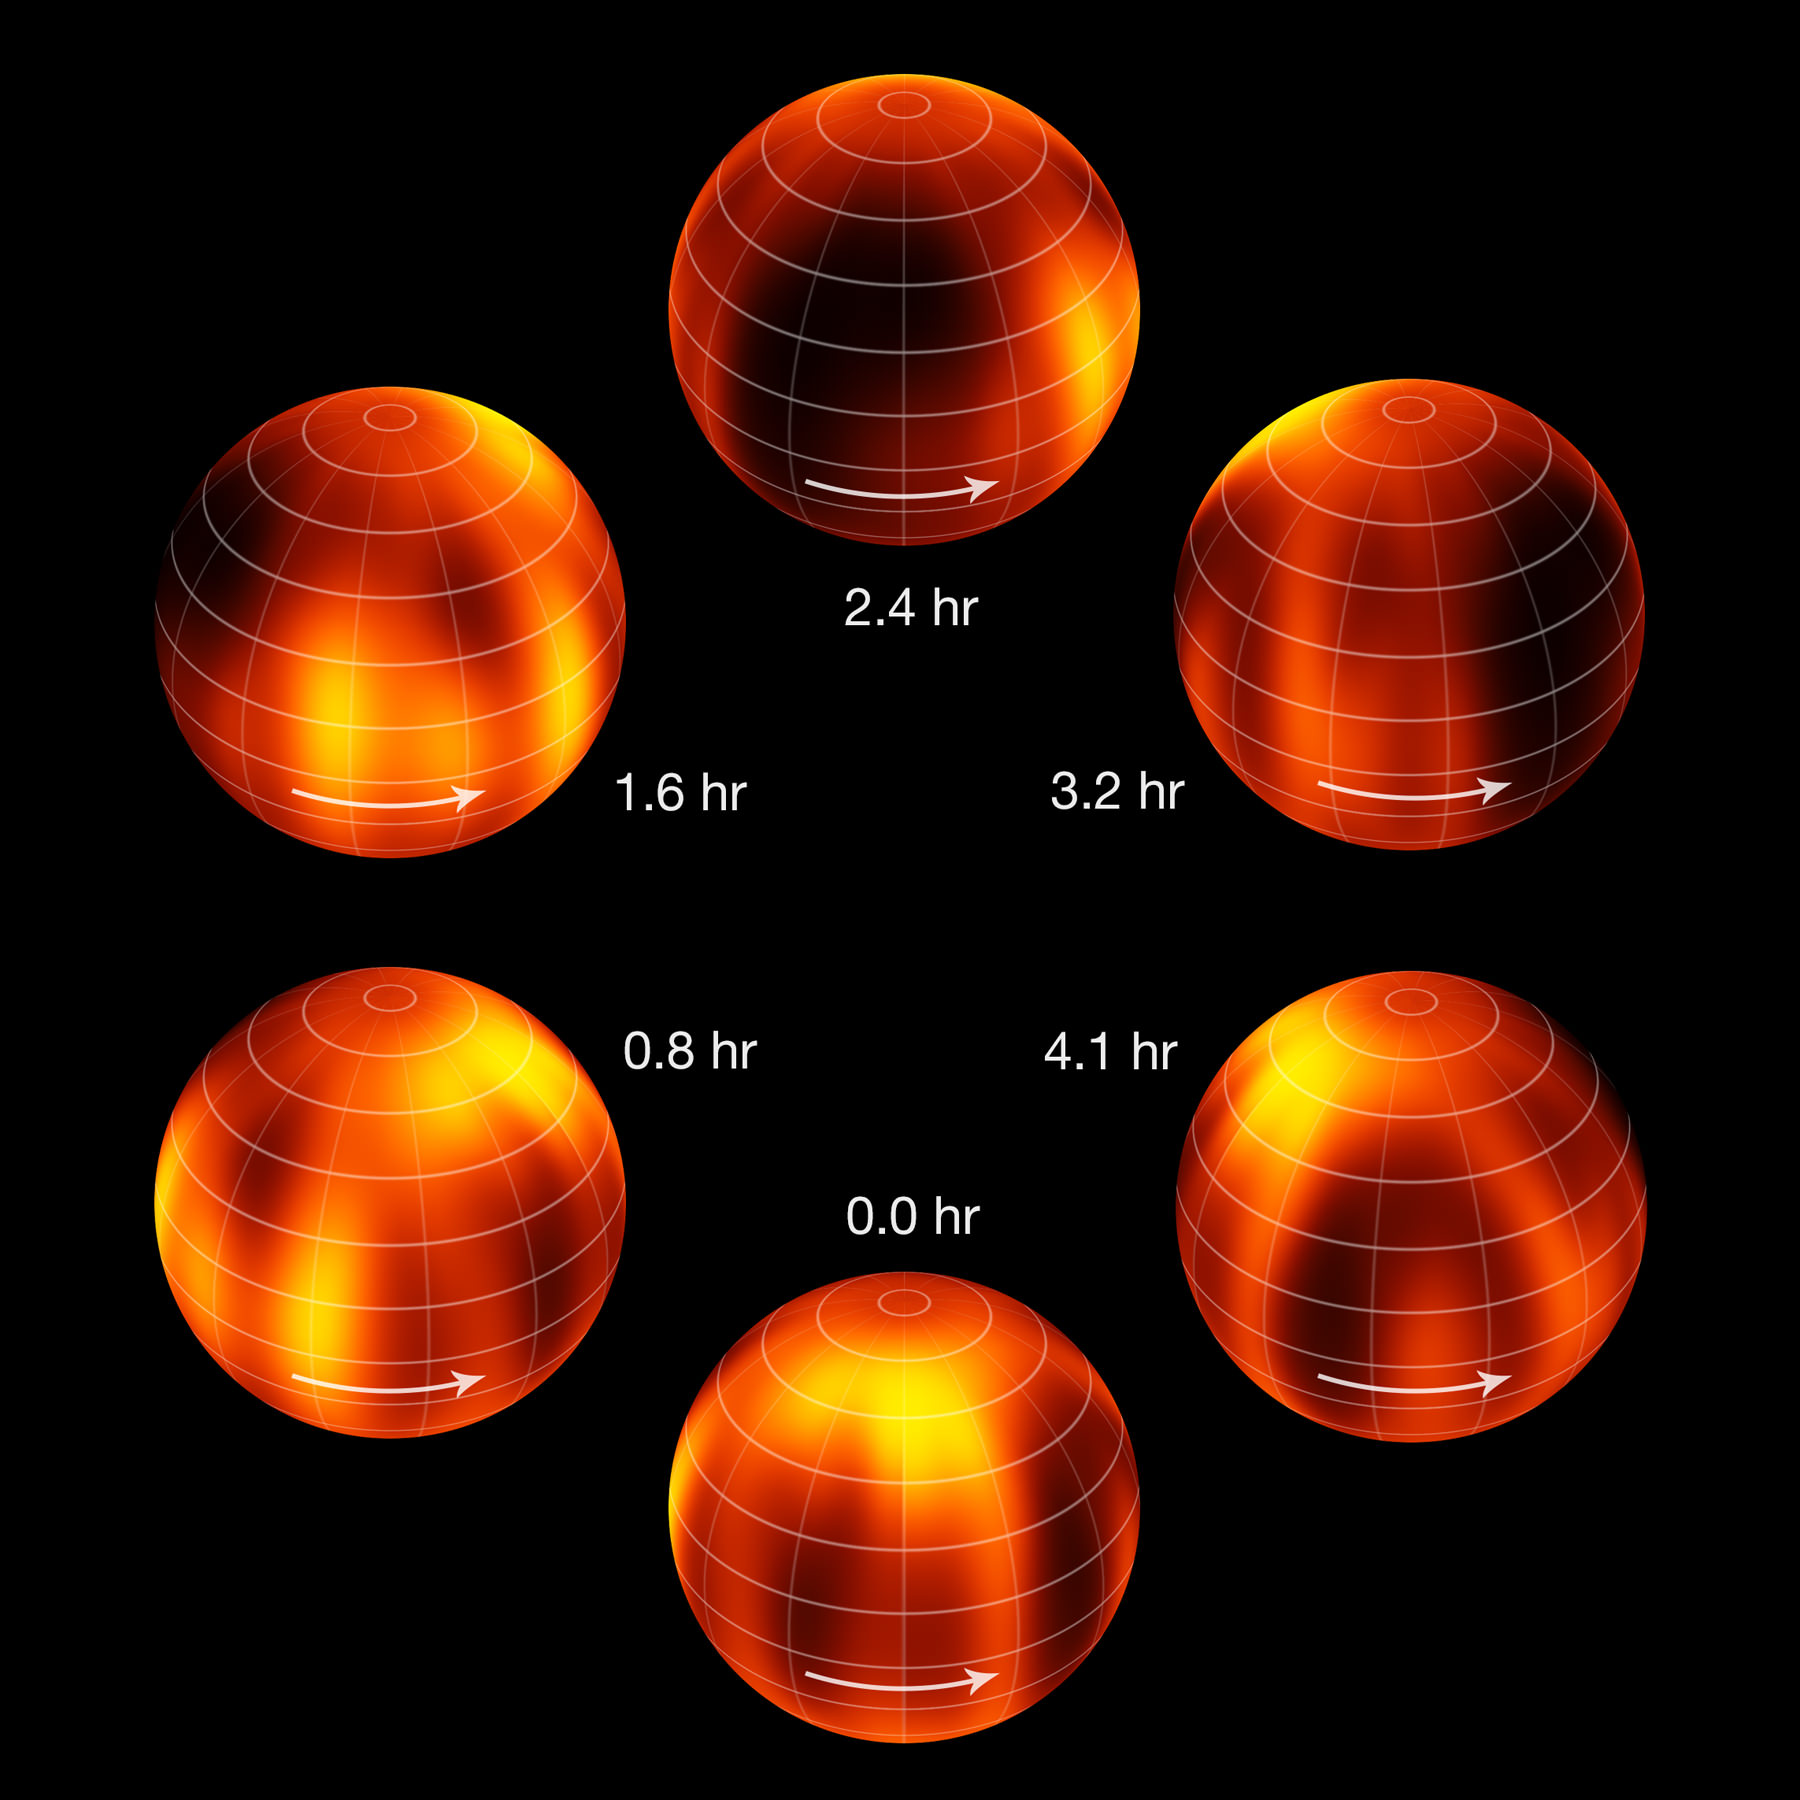
To construct these images, astronomers used an indirect technique known as Doppler imaging. This method takes advantage of the minute shifts observed as the rotating features on brown dwarf approach and recede from the observer. Doppler speeds of features can also hint at the latitudes being observed as well as the body’s inclination or tilt to our line of sight.
But you won’t need a jacket, as researchers gauge the weather on Luhman 16B be in the 1100 degrees Celsius range, with a rain of molten iron in a predominately hydrogen atmosphere.
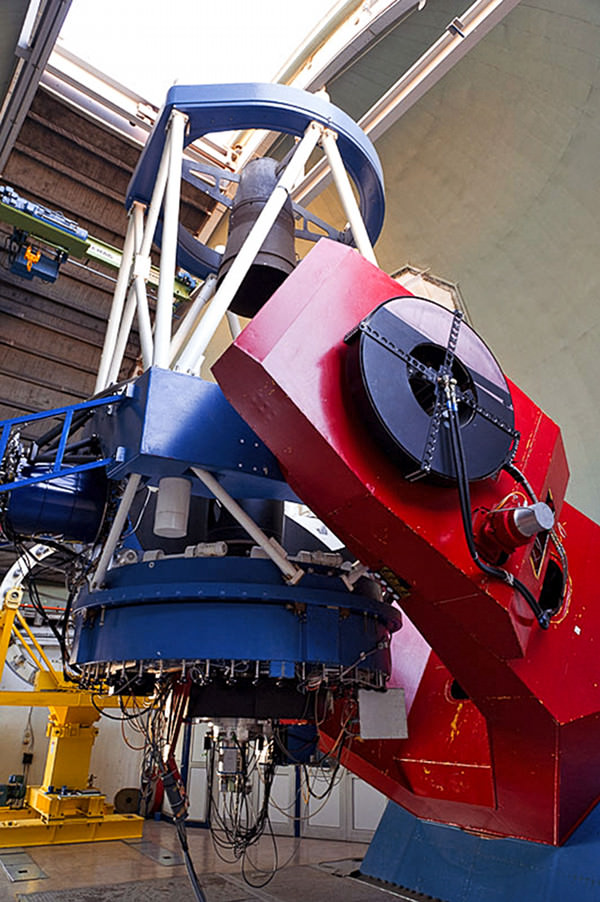
The study was carried out using the CRyogenic InfraRed Echelle Spectrograph (CRIRES) mounted on the 8-metre Very Large Telescope based at the European Southern Observatory’s (ESO) Paranal observatory complex in Chile. CRIRES obtained the spectra necessary to re-construct the brown dwarf map, while backup brightness measurements were accomplished using the GROND (Gamma-Ray Burst Optical/Near-Infrared Detector) astronomical camera affixed to the 2.2 metre telescope at the ESO La Silla Observatory.
A closeup of the GROND instrument (the blue cylinder to the lower left) on the La Silla 2.2-metre telescope. Credit-ESO/European Organization for Astronomical Research in the Southern Hemisphere.
The next phase of observations will involve imaging brown dwarfs using the Spectro-Polarimetric High-contrast Exoplanet Research (SPHERE) instrument, set to go online at the Very Large Telescope facility later this year.
And that may just usher in a new era of directly imaging features on objects beyond our solar system, including exoplanets.
“The exciting bit is that this is just the start. With the next generations of telescopes, and in particular the 39-metre European Large Telescope, we will likely see surface maps of more distant brown dwarfs — and eventually, a surface map for a young giant planet,” said Beth Biller, a researcher previously based at the Max Planck Institute and now based at the University of Edinburgh. Biller’s study of the pair went even more in-depth, analyzing changes in brightness at different wavelengths to peer into the atmospheric structure of the brown dwarfs at varying depths.
“We’ve learned that the weather pattern on these brown dwarfs are quite complex,” Biller said. “The cloud structure of the brown dwarf varies quite strongly as a function of atmospheric depth and cannot be explained with single layer clouds.”
A rotational surface map of Luhman 16B Credit-ESO/I. Crossfield.
The paper on brown dwarf weather pattern map comes out today in the January 30th, 2014 edition of Nature under the title Mapping Patchy Clouds on a Nearby Brown Dwarf.
The brown dwarf pair targeted in the study was designated Luhman 16A & B after Pennsylvania State University researcher Kevin Luhman, who discovered the pair in mid-March, 2013. Luhman has discovered 16 binary systems to date. The WISE catalog designation for the system has the much more cumbersome and phone number-esque designation of WISE J104915.57-531906.1.
We caught up with the researchers to ask them some specifics on the orientation and rotation of the pair.
“The rotation period of Luhman 16B was previously measured watching the brown dwarf’s globally-averaged brightness changes over many days. Luhman 16A seems to have a uniformly thick layer of clouds, so it exhibits no such variation and we don’t yet know its period,” Crossfield told Universe Today. “We can estimate the inclination of the rotation axis because we know the rotation period, we know how big brown dwarfs are, and in our study, we measured the “projected” rotational velocity. From this, we know we must be seeing the brown dwarf near equator-on.”
The maps constructed correspond with an amazingly fast rotation period of just under 6 hours for Luhman 16B. For context, the planet Jupiter – one of the fastest rotators in our solar system – spins once every 9.9 hours.
“The rotational period of Luhman 16B is known from 12 nights of variability monitoring,” Biller told Universe Today. “The variability in the B component is consistent with the results from 2013, but the A component has a lower amplitude of variability and a somewhat different rotational period of maybe 3-4 hours, but that is still a very tentative result.”
This first mapping of the cloud patterns on a brown dwarf is a landmark, and promises to provide a much better understanding of this transitional class of objects.
Couple this announcement with the recent nearby brown dwarf captured in a direct image, and its apparent that a new era of exoplanet science is upon us, one where we’ll not only be able to confirm the existence of distant worlds and substellar objects, but characterize what they’re actually like.
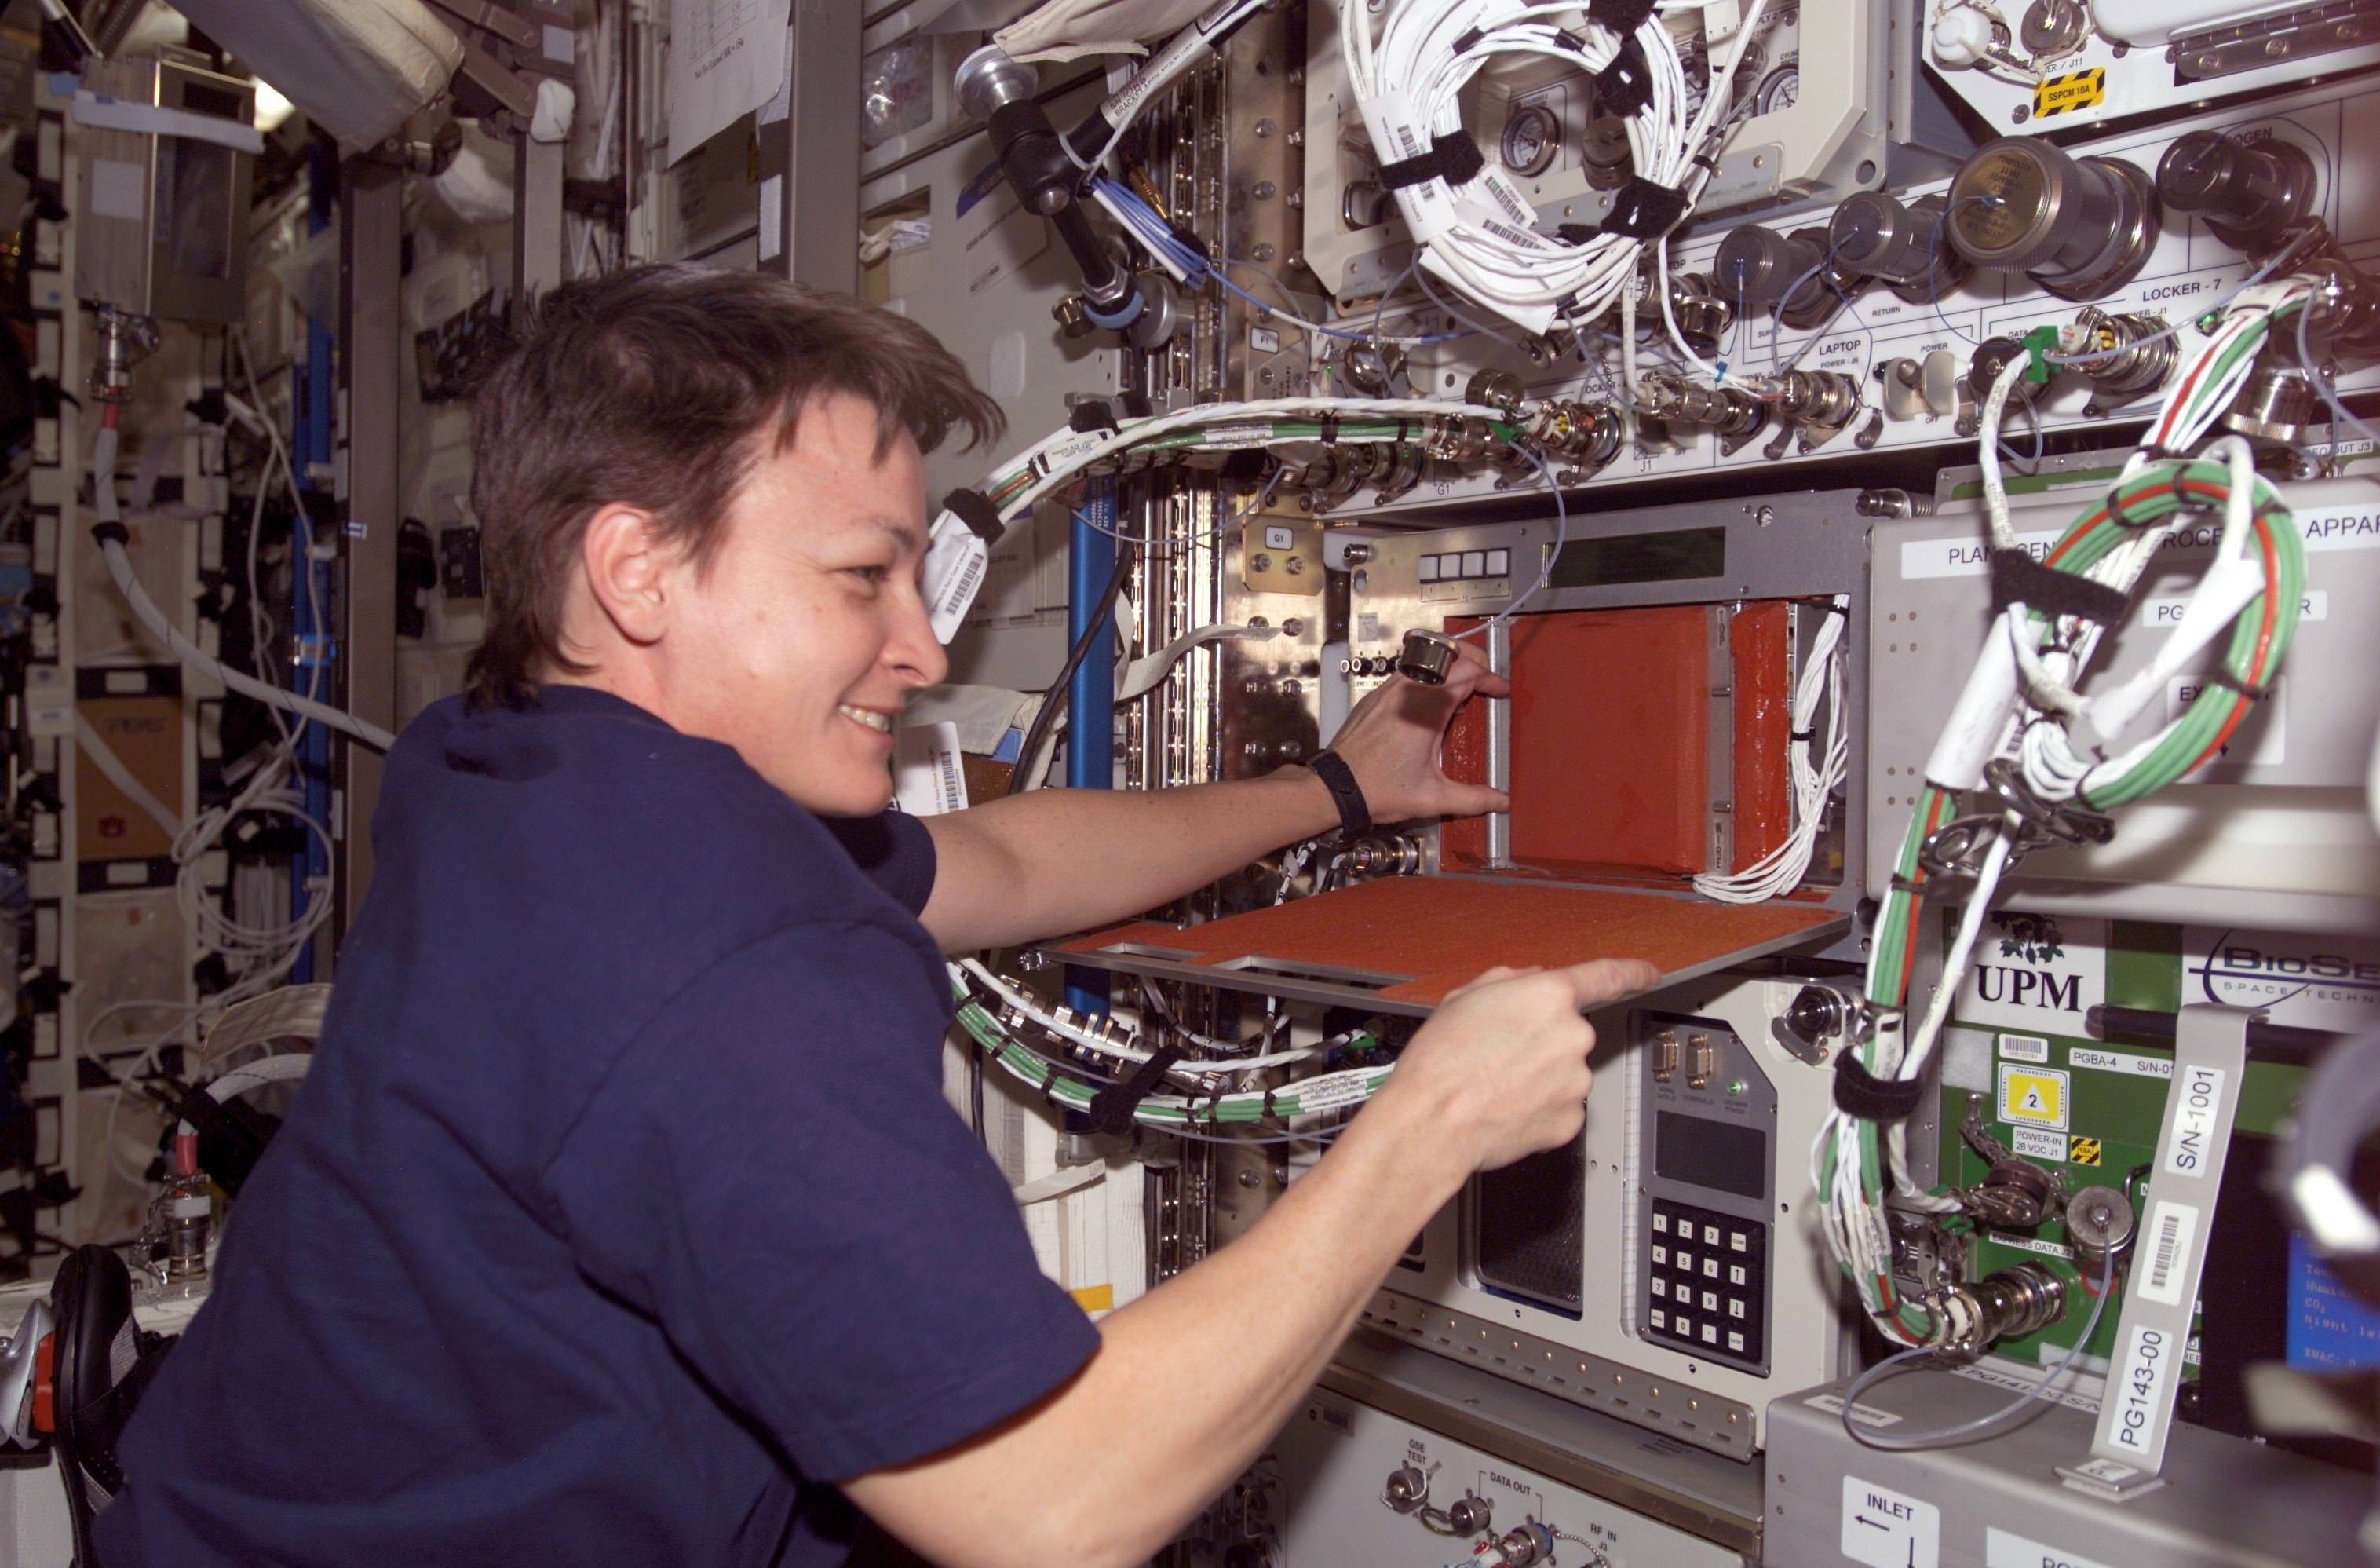
NASA astronaut Peggy Whitson working at the Plant Generic Bioprocessing Apparatus during Expedition 5 on the International Space Station in 2002. The experiment "monitored and maintained light, temperature, humidity and oxygen levels", NASA stated, to look at the production of lignin (a polymer) in plants. Credit: NASA
A bunch of people really, really want to go to the Red Planet on the proposed one-way Mars One trip; more than 1,000 applicants are being considered in Round 2 selections. They will face, however, more radiation during their journey that could put them at higher risk of cancers down the road. While the solution could be to add more shielding to a spacecraft, that’s both heavy and expensive.
Enter the alternative: a magnetic field. A group calling itself the EU Project Space Radiation Superconductive Shield says their technology will “solve the issue of radiation protection in three years” and is seeking academic collaborations to make that happen. Here’s how it will work:
“The SR2S superconducting shield will provide an intense magnetic field, 3,000 times stronger than the Earth’s magnetic field and will be confined around the space craft,” a press release states.
“The magnetic fields will extend to about 10 metres in diameter and ionizing particles will be deflected away. Only the most energetic particles will penetrate the superconducting shield, but these will contribute the least to the absorbed radiation dose as their flux is negligible. This will address the issue of suitability of people for space travel as it will open up eligibility for space travel regardless of gender.”
That last bit refers to some radiation guidelines highlighted a few months ago. Peggy Whitson, a veteran NASA astronaut, said publicly that women fly far fewer hours in space than men. That’s because space authorities apply lower “lifetime” radiation limits to females (for biological reasons, which you can read more about here).
The project team includes participation from the Italian National Institute of Nuclear Physics, General Company For Space (CGS SpA), Columbus Superconductor SpA, Thales Alenia Space – Italia S.p.A., the French Commission of Atomic Energy and Alternative Energies, and the European Organization for Nuclear Research (CERN).
“We have already made significant progress since the beginning of the project and believe we will succeed in this goal of solving the radiation protection issue,” stated Roberto Battiston, who leads the project and is also a professor of experimental physics at the University of Trento in Italy. The project started a year ago.
“In the last few months, the international teams working at CERN have solved two major technical issues relevant to the superconducting magnets in space (i) how to make very long high temperature superconducting cables join together in a shorter segment without losing the superconducting properties and (ii) how to ensure protection of long high temperature cables from a quench.”
More information on the project is available at its website. What do you think of their idea? Leave your thoughts in the comments.
This artist’s impression shows the exotic double object that consists of a tiny, but very heavy neutron star that spins 25 times each second, orbited every two and a half hours by a white dwarf star. The neutron star is a pulsar named PSR J0348+0432 that is giving off radio waves that can be picked up on Earth by radio telescopes. Although this unusual pair is very interesting in its own right it is also a unique laboratory for testing the limits of physical theories. This system is radiating gravitational radiation, ripples in spacetime. Although these waves cannot be yet detected directly by astronomers on Earth they can be detected indirectly by measuring the change in the orbit of the system as it loses energy. As the pulsar is so small the relative sizes of the two objects are not drawn to scale.
When we think of gravity, we typically think of it as a force between masses. When you step on a scale, for example, the number on the scale represents the pull of the Earth’s gravity on your mass, giving you weight. It is easy to imagine the gravitational force of the Sun holding the planets in their orbits, or the gravitational pull of a black hole. Forces are easy to understand as pushes and pulls.
But we now understand that gravity as a force is only part of a more complex phenomenon described the theory of general relativity. While general relativity is an elegant theory, it’s a radical departure from the idea of gravity as a force. As Carl Sagan once said, “Extraordinary claims require extraordinary evidence,” and Einstein’s theory is a very extraordinary claim. But it turns out there are several extraordinary experiments that confirm the curvature of space and time.
The key to general relativity lies in the fact that everything in a gravitational field falls at the same rate. Stand on the Moon and drop a hammer and a feather, and they will hit the surface at the same time. The same is true for any object regardless of its mass or physical makeup, and this is known as the equivalence principle.
Since everything falls in the same way regardless of its mass, it means that without some external point of reference, a free-floating observer far from gravitational sources and a free-falling observer in the gravitational field of a massive body each have the same experience. For example, astronauts in the space station look as if they are floating without gravity. Actually, the gravitational pull of the Earth on the space station is nearly as strong as it is at the surface. The difference is that the space station (and everything in it) is falling. The space station is in orbit, which means it is literally falling around the Earth.
The International Space Station orbiting Earth. Credit: NASA
This equivalence between floating and falling is what Einstein used to develop his theory. In general relativity, gravity is not a force between masses. Instead gravity is an effect of the warping of space and time in the presence of mass. Without a force acting upon it, an object will move in a straight line. If you draw a line on a sheet of paper, and then twist or bend the paper, the line will no longer appear straight. In the same way, the straight path of an object is bent when space and time is bent. This explains why all objects fall at the same rate. The gravity warps spacetime in a particular way, so the straight paths of all objects are bent in the same way near the Earth.
So what kind of experiment could possibly prove that gravity is warped spacetime? One stems from the fact that light can be deflected by a nearby mass. It is often argued that since light has no mass, it shouldn’t be deflected by the gravitational force of a body. This isn’t quite correct. Since light has energy, and by special relativity mass and energy are equivalent, Newton’s gravitational theory predicts that light would be deflected slightly by a nearby mass. The difference is that general relativity predicts it will be deflected twice as much.
Description of Eddington’s experiment from the Illustrated London News (1919).
The effect was first observed by Arthur Eddington in 1919. Eddington traveled to the island of Principe off the coast of West Africa to photograph a total eclipse. He had taken photos of the same region of the sky sometime earlier. By comparing the eclipse photos and the earlier photos of the same sky, Eddington was able to show the apparent position of stars shifted when the Sun was near. The amount of deflection agreed with Einstein, and not Newton. Since then we’ve seen a similar effect where the light of distant quasars and galaxies are deflected by closer masses. It is often referred to as gravitational lensing, and it has been used to measure the masses of galaxies, and even see the effects of dark matter.
Another piece of evidence is known as the time-delay experiment. The mass of the Sun warps space near it, therefore light passing near the Sun is doesn’t travel in a perfectly straight line. Instead it travels along a slightly curved path that is a bit longer. This means light from a planet on the other side of the solar system from Earth reaches us a tiny bit later than we would otherwise expect. The first measurement of this time delay was in the late 1960s by Irwin Shapiro. Radio signals were bounced off Venus from Earth when the two planets were almost on opposite sides of the sun. The measured delay of the signals’ round trip was about 200 microseconds, just as predicted by general relativity. This effect is now known as the Shapiro time delay, and it means the average speed of light (as determined by the travel time) is slightly slower than the (always constant) instantaneous speed of light.
A third effect is gravitational waves. If stars warp space around them, then the motion of stars in a binary system should create ripples in spacetime, similar to the way swirling your finger in water can create ripples on the water’s surface. As the gravity waves radiate away from the stars, they take away some of the energy from the binary system. This means that the two stars gradually move closer together, an effect known as inspiralling. As the two stars inspiral, their orbital period gets shorter because their orbits are getting smaller.
Decay of pulsar period compared to prediction (dashed curve). Data from Hulse and Taylor, Plotted by the author.
For regular binary stars this effect is so small that we can’t observe it. However in 1974 two astronomers (Hulse and Taylor) discovered an interesting pulsar. Pulsars are rapidly rotating neutron stars that happen to radiate radio pulses in our direction. The pulse rate of pulsars are typically very, very regular. Hulse and Taylor noticed that this particular pulsar’s rate would speed up slightly then slow down slightly at a regular rate. They showed that this variation was due to the motion of the pulsar as it orbited a star. They were able to determine the orbital motion of the pulsar very precisely, calculating its orbital period to within a fraction of a second. As they observed their pulsar over the years, they noticed its orbital period was gradually getting shorter. The pulsar is inspiralling due to the radiation of gravity waves, just as predicted.
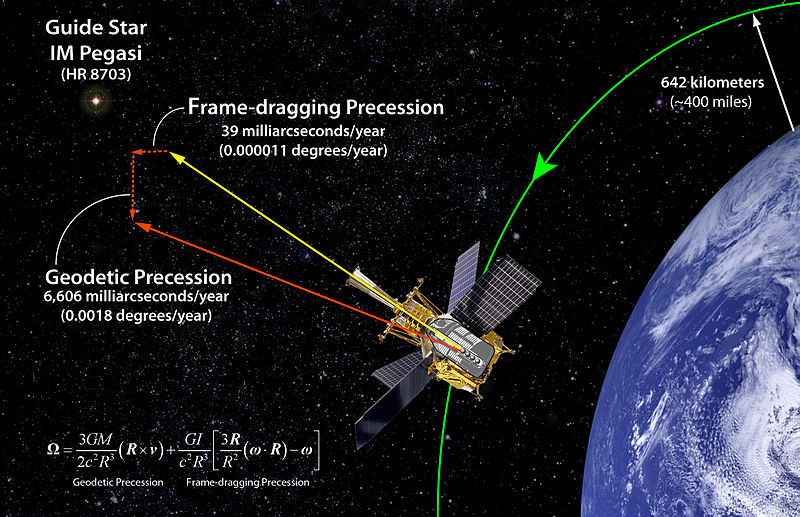
Illustration of Gravity Probe B. Credit: Gravity Probe B Team, Stanford, NASA
Finally there is an effect known as frame dragging. We have seen this effect near Earth itself. Because the Earth is rotating, it not only curves spacetime by its mass, it twists spacetime around it due to its rotation. This twisting of spacetime is known as frame dragging. The effect is not very big near the Earth, but it can be measured through the Lense-Thirring effect. Basically you put a spherical gyroscope in orbit, and see if its axis of rotation changes. If there is no frame dragging, then the orientation of the gyroscope shouldn’t change. If there is frame dragging, then the spiral twist of space and time will cause the gyroscope to precess, and its orientation will slowly change over time.
Gravity Probe B results. Credit: Gravity Probe B team, NASA.
We’ve actually done this experiment with a satellite known as Gravity Probe B, and you can see the results in the figure here. As you can see, they agree very well.
Each of these experiments show that gravity is not simply a force between masses. Gravity is instead an effect of space and time. Gravity is built into the very shape of the universe.
Think on that the next time you step onto a scale.
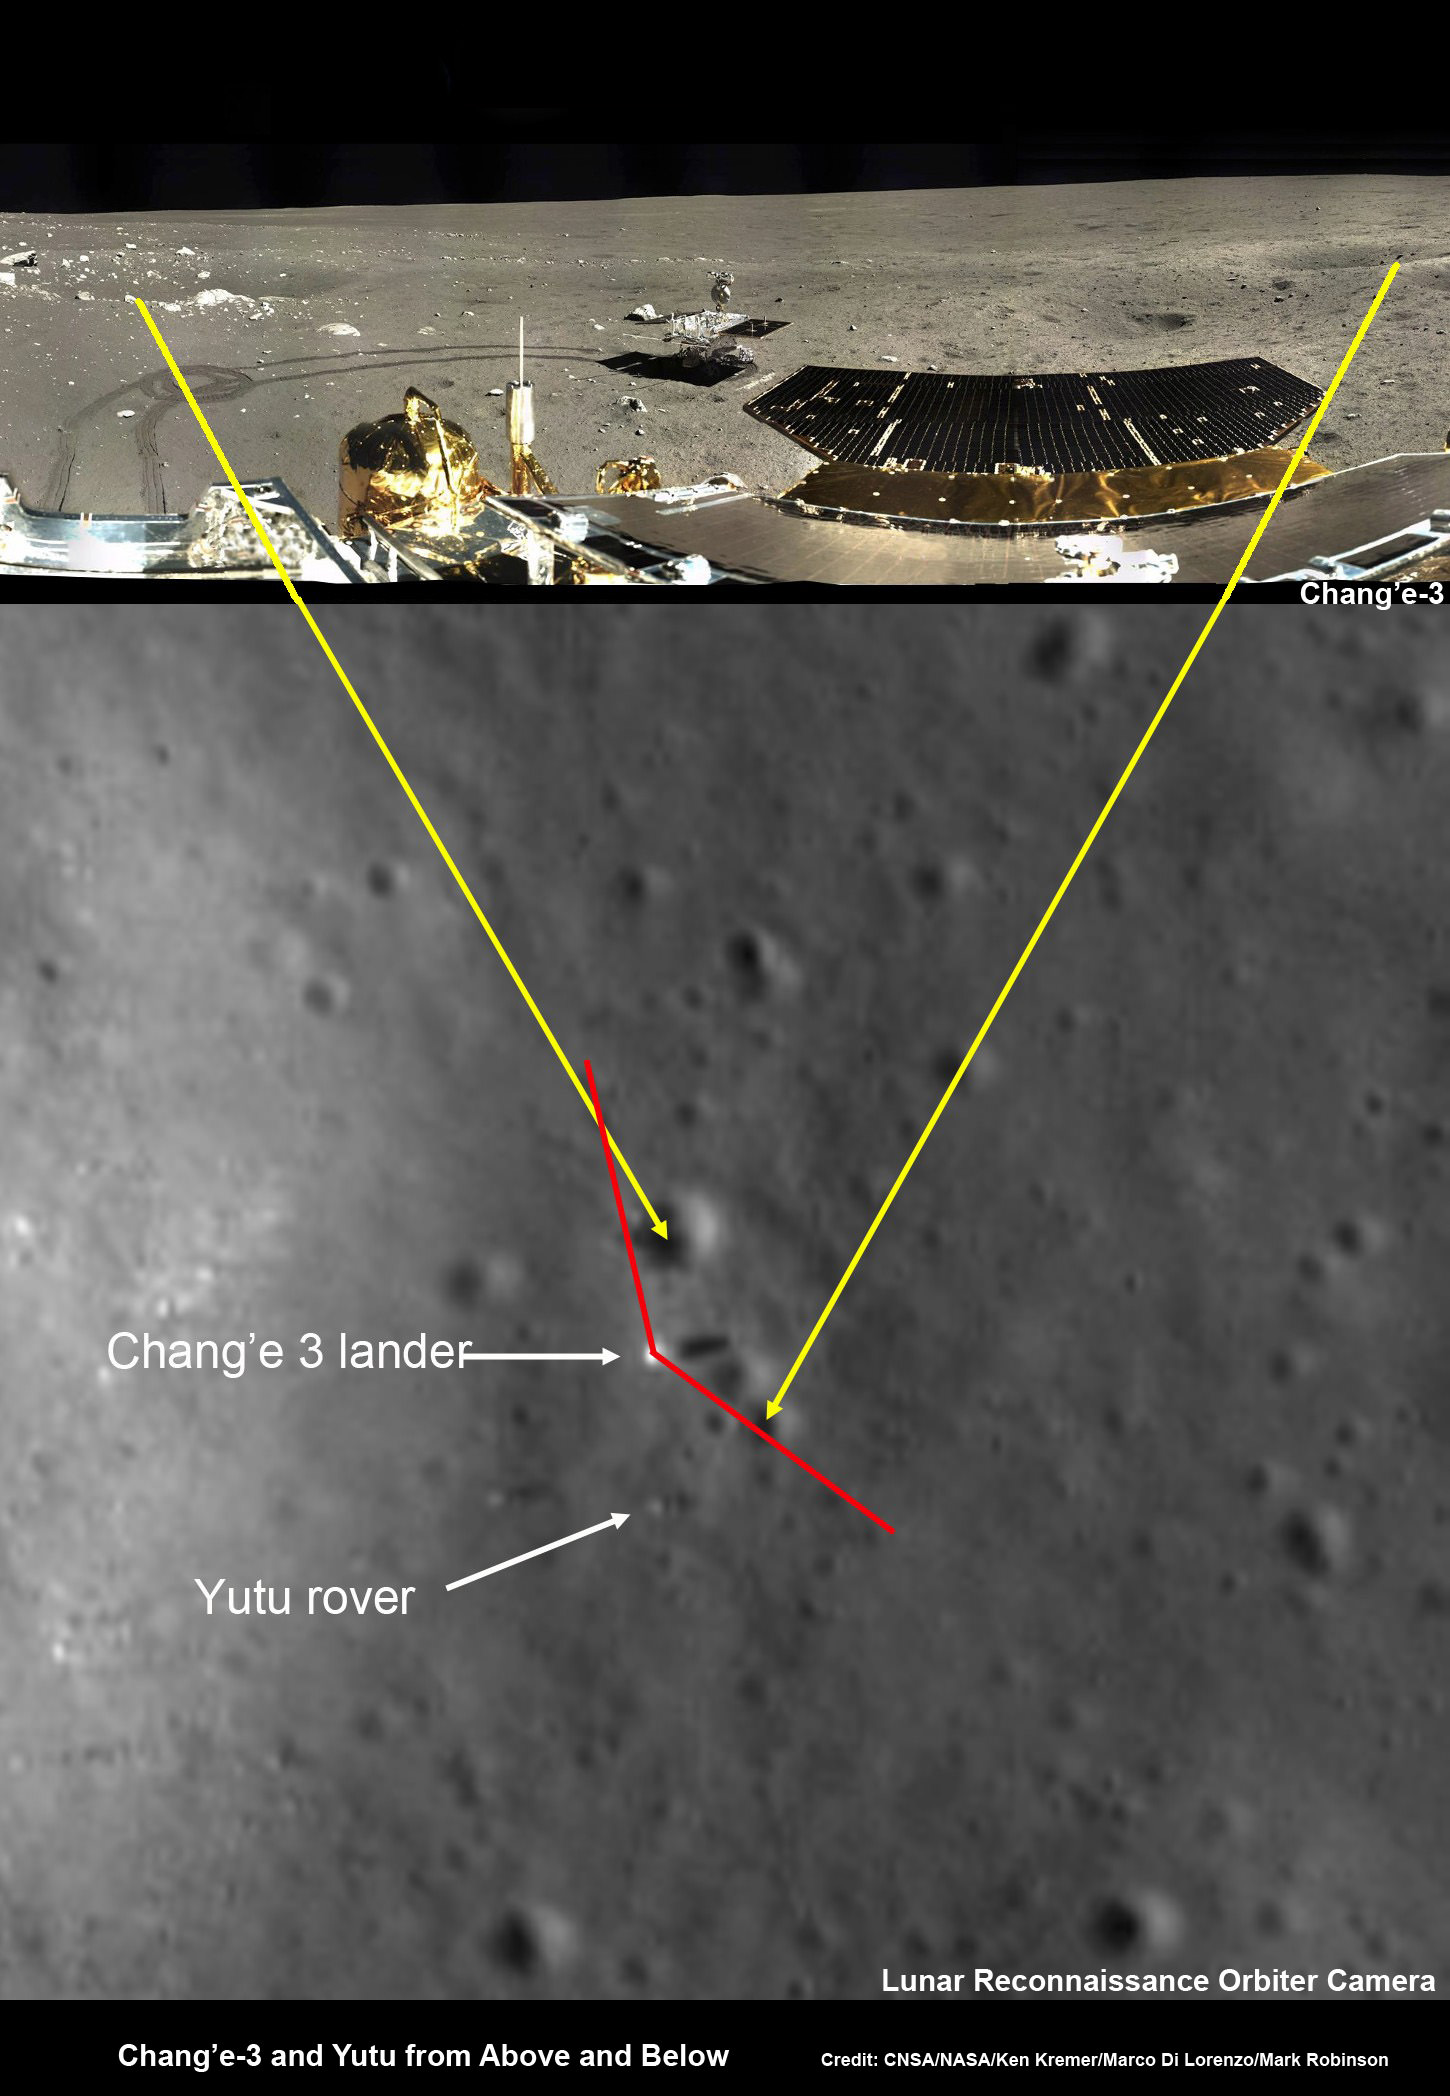
Chang’e-3 lander and Yutu rover – from Above And Below Composite view shows China’s Chang’e-3 lander and Yutu rover from Above And Below (orbit and surface) – lander color panorama (top) and orbital view from NASA’s LRO orbiter (bottom). Chang’e-3 lander color panorama shows Yutu rover after it drove down the ramp to the moon’s surface and began driving around the landers right side to the south. Yellow lines connect craters seen in the lander panorama and the LROC image from LRO (taken at a later date after the rover had moved), red lines indicate approximate field of view of the lander panorama. Credit: CNSA/NASA/Ken Kremer/Marco Di Lorenzo/Mark Robinson
Chang’e-3 lander and Yutu rover – from Above And Below
Composite view shows China’s Chang’e-3 lander and Yutu rover from Above And Below (orbit and surface) – lander color panorama (top) and orbital view from NASA’s LRO orbiter (bottom). Chang’e-3 lander color panorama shows Yutu rover after it drove down the ramp to the moon’s surface and began driving around the landers right side to the south. Yellow lines connect craters seen in the lander panorama and the LROC image from LRO (taken at a later date after the rover had moved), red lines indicate approximate field of view of the lander panorama. Credit: CNSA/NASA/Ken Kremer/Marco Di Lorenzo/Mark Robinson
See further composite and panorama views below
Story updated See our Yutu timelapse pano at NASA APOD Feb. 3, 2014: http://apod.nasa.gov/apod/ap140203.html[/caption]
China’sChang’e-3 lander and Yutu moon rover have been imaged from above and below – in one of those rare, astounding circumstances when space probes from Earth are exploring an extraterrestrial body both from orbit and the surface. And it’s even more amazing when these otherworldly endeavors just happen to overlap and involve actual work in progress to expand human knowledge of the unknown.
And it’s even rarer, when those images stem from active space probes built by two different countries on Earth.
Well by combining imagery from America’s space agency, NASA, and China’s space agency, CNSA, we are pleased to present some breathtaking views of ‘Chang’e-3 and the Yutu rover from Above and Below.’
Check out our composite mosaic (above) combining the view from the Moon’s orbit snapped by the hi res camera aboard NASA’s Lunar Reconnaissance Orbiter (LRO) with our new color panoramas from the Moon’s surface, compiling imagery from the landing site of China’s Chang’e-3 lander – with Yutu in transit in mid-Dec. 2013 soon after the successful touchdown.
See below an earlier composite mosaic using the first black and white panorama from the Chang’e-3 Moon lander.
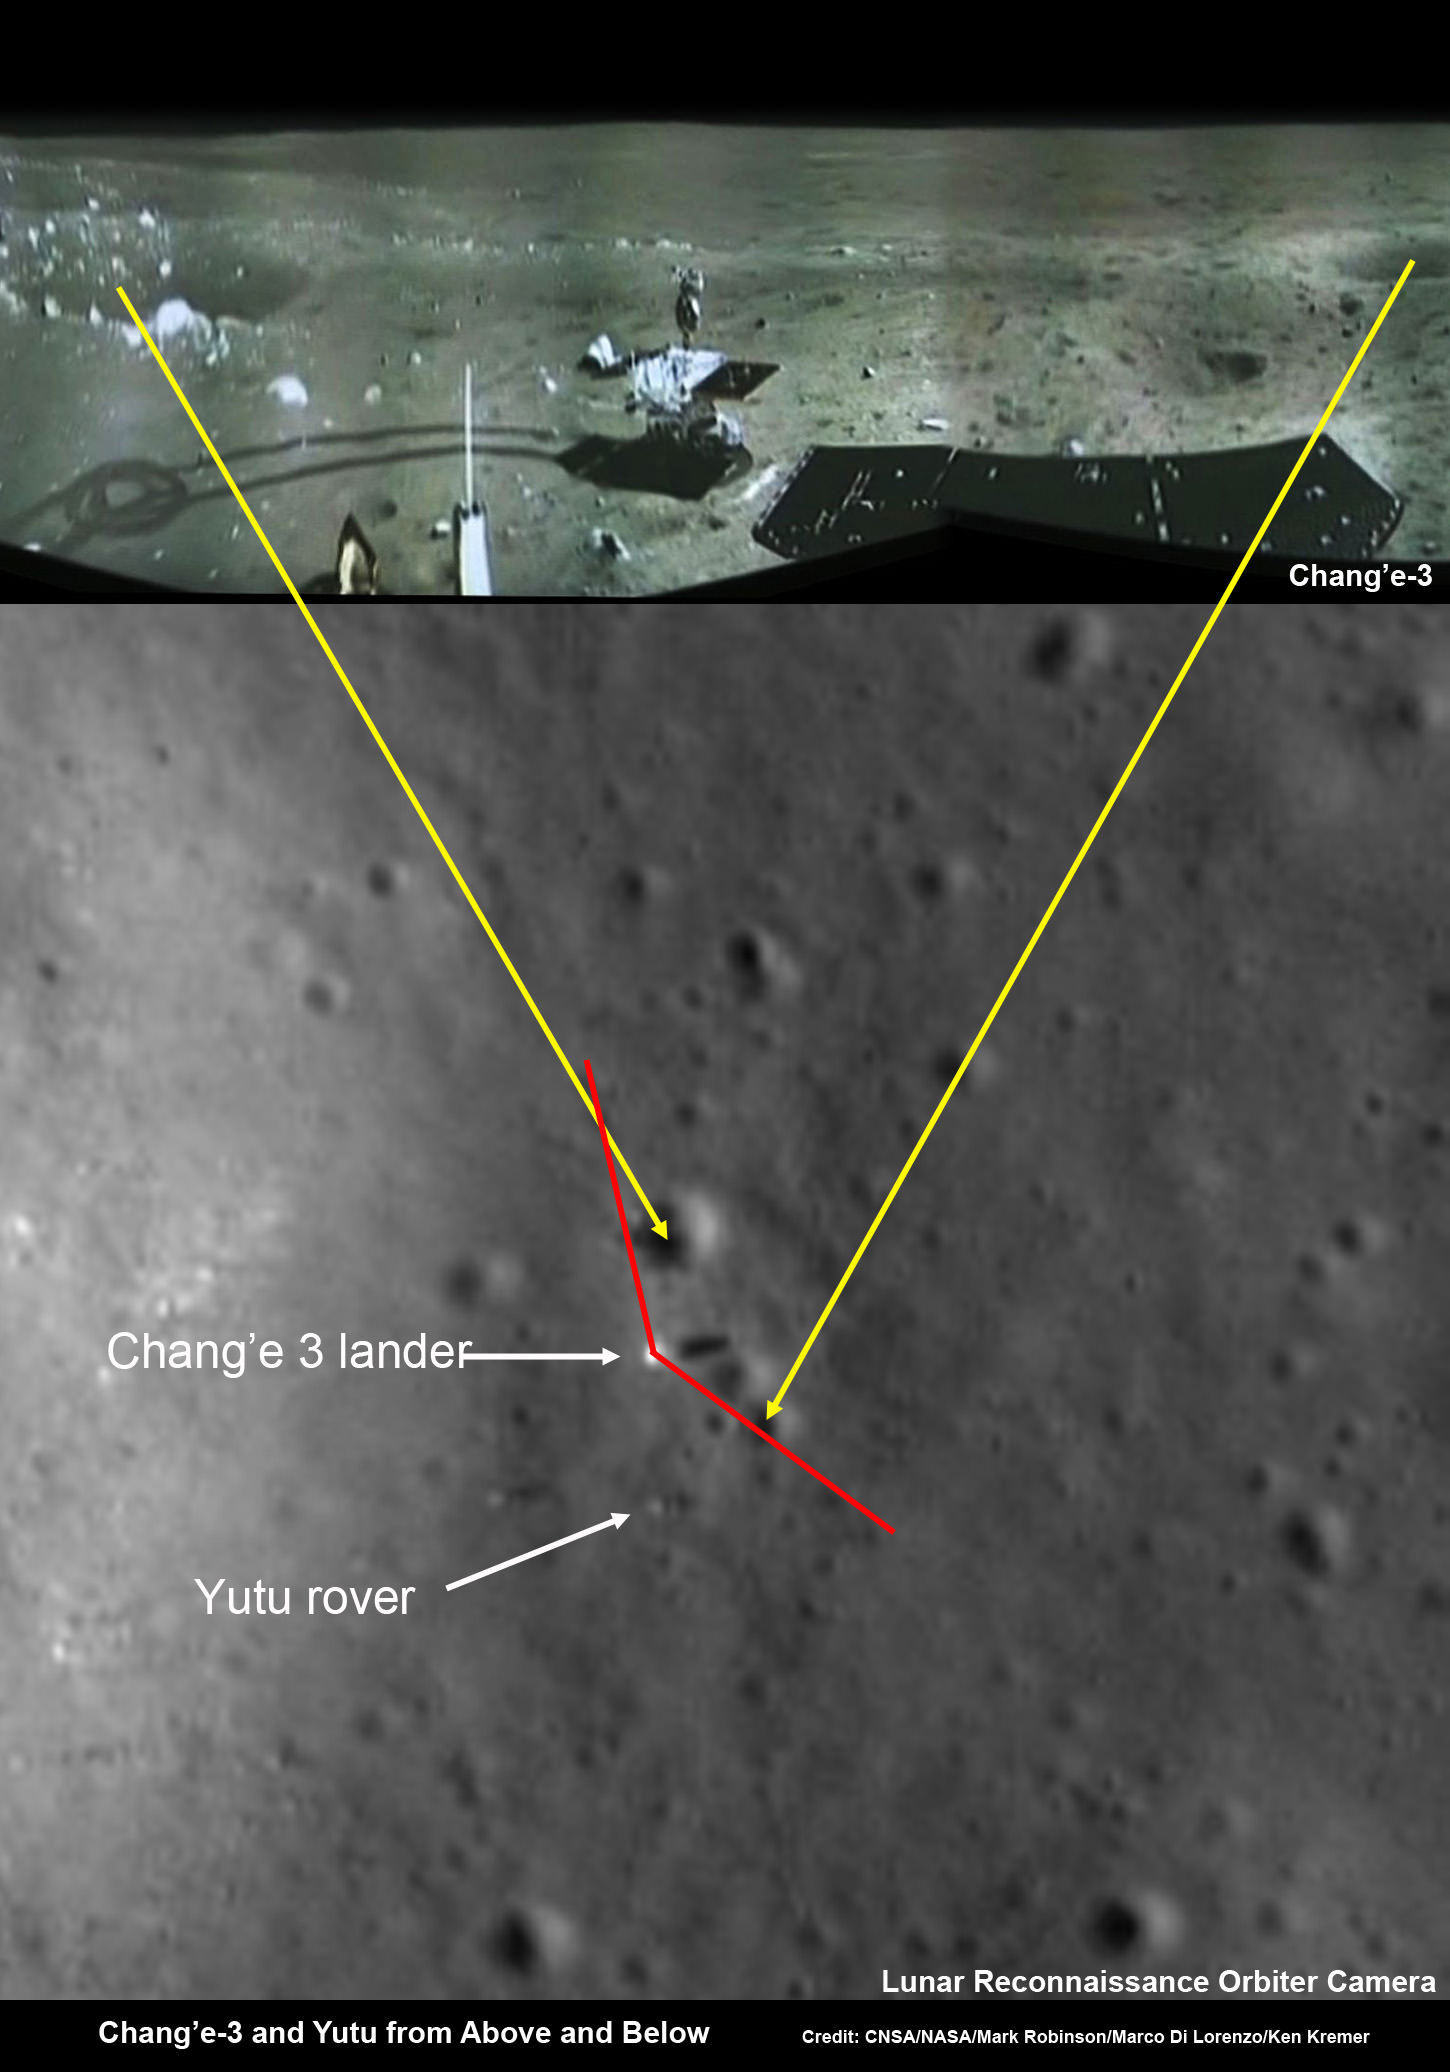
Chang’e-3 lander and Yutu rover – from Above And Below
Composite view shows China’s Chang’e-3 lander and Yutu rover from Above And Below (orbit and surface) – lander panorama (top) and orbital view from NASA’s LRO orbiter (bottom). Chang’e-3 lander B/W panorama from camera shows Yutu rover after it drove down the ramp to the moon’s surface and began driving around the landers right side to the south. Yellow lines connect craters seen in the lander panorama and the LROC image from LRO (taken at a later date after the rover had moved), red lines indicate approximate field of view of the lander panorama. Credit: CNSA/NASA/Mark Robinson/Marco Di Lorenzo/Ken Kremer – kenkremer.com
The composite mosaic combines the efforts of Mark Robinson, Principal Investigator for the LRO camera, and the imaging team of Ken Kremer and Marco Di Lorenzo.
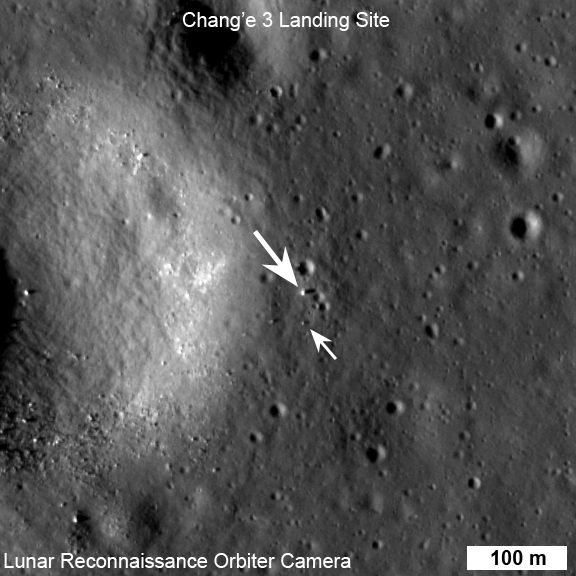
On Christmas eve, Dec. 24, 2013, NASA’s LRO captured it’s first images of China’s Chang’e-3 lander and Yutu moon rover – barely 10 days after the history making touchdown on Mare Imbrium (Sea of Rains) and just 60 meters east of the rim of a 450 meter diameter impact crater.
LRO was orbiting about 150 kilometers above Chang’e-3 and Yutu when the highest resolution orbital image was taken on 24 December 22:52:49 EST (25 December 03:52:49 UT).
Image of Chang’e-3 (top arrow) and Yutu rover captured by NASA’s Lunar Reconnaissance Orbiter on Dec. 24, 2013
The orbital imagery was taken by the LRO orbiters high resolution Lunar Reconnaissance Orbiter Camera (LROC) – specifically the narrow angle camera (NAC).
See below my pre-launch cleanroom photo of LRO and the LROC cameras and other science instruments.
The Chang’e-3 lander color panorama shows the Yutu rover after it drove down the ramp to the moon’s surface and began driving a significant distance around the landers right side on its journey heading southwards.
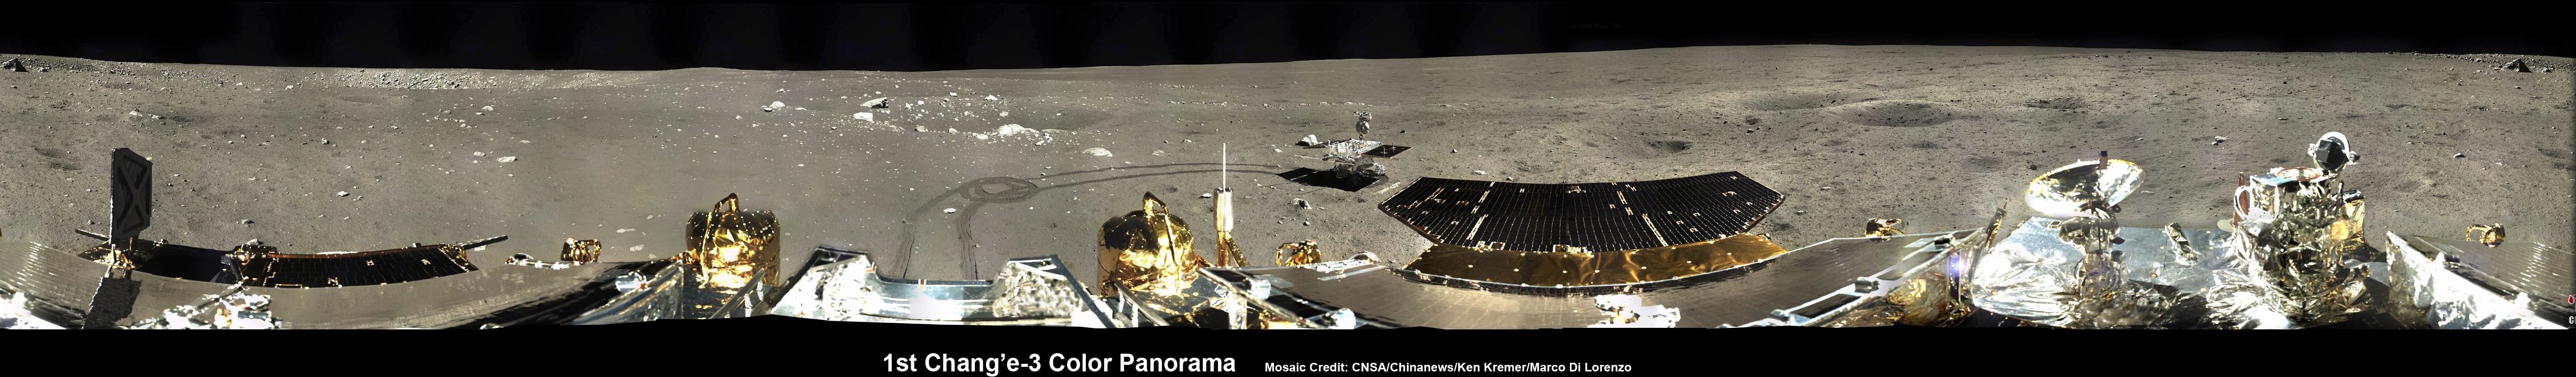
1st 360 Degree Color Panorama from China’s Chang’e-3 Lunar Lander
This 1st color panorama from Chang’e-3 lander shows the view all around the landing site after the ‘Yutu’ lunar rover left impressive tracks behind when it initially rolled all six wheels onto the pockmarked and gray lunar terrain on Dec. 15, 2013. Mosaic Credit: CNSA/Chinanews/Ken Kremer/Marco Di Lorenzo – kenkremer.com
Yellow lines connect craters seen in the lander panorama to those seen in the LROC hi res NAC image from LRO, in the composite view.
Robinson identified the lunar craters and determined the field of view on the LROC image.
The LRO image was taken at a later date (on Christmas eve) after the rover had already moved. Red lines on the orbital image indicate the approximate field of view of what is seen in the Chang’e-3 lander panorama.
Although Yutu is only about 150 cm wide – which is the same as the pixel size – it shows up in the NAC images for two reasons.
“The solar panels are very effective at reflecting light so the rover shows up as two bright pixels, and the Sun is setting thus the rover casts a distinct shadow (as does the lander),” says NASA in a statement.
In a historic first for China, the Chang’e-3 spacecraft safely touched down on the Moon at Mare Imbrium near the Bay of Rainbows nearly seven weeks ago on Dec. 14, 2013.
Seven hours later, the piggybacked 140 kg Yutu robot drove off a pair of ramps, onto the Moon and into the history books.
Yutu was about 10 meters away from the 1200 kg stationary lander when the lander panoramic images were taken.
The lander and Yutu were just completing their 1st Lunar Day of explorations when the LROC images were taken, and entered their first period of hibernation soon thereafter on Dec. 25 (Christmas Day) and Dec 26 respectively coinciding with the start of their 1st Lunar Night.
However, Yutu’s future mission is now in jeopardy following a serious mechanical anomaly this past weekend as both vehicles entered their 2nd hibernation period.
Apparently one of the solar panels did not fold back properly – perhaps due to dust accumulation – and its instruments may not survive.
Yutu’s fate will remain unknown until the 3rd Lunar Day starts around Feb. 8 or 9.
So, What’s the terrain like at the Mare Imbrium landing site?
Chang’e-3 landed on a thick deposit of volcanic material.
“A large scale wrinkle ridge (~100 km long, 10 km wide) cuts across the area and was formed as tectonic stress caused the volcanic layers to buckle and break along faults. Wrinkle ridges are common on the Moon, Mercury and Mars,” says Robinson.
“The landing site is on a blue mare (higher titanium) thought to be about 3.0 billion years old.”
Older red mare about from 3.5 billion years is only 10 km to the north, he notes.
See our Chang’e-3 color panoramas now featured at NBC News and Space.com
China is only the 3rd country in the world to successfully soft land a spacecraft on Earth’s nearest neighbor after the United States and the Soviet Union.
Stay tuned here for Ken’s continuing Chang’e-3, Orion, Orbital Sciences, SpaceX, commercial space, LADEE, Mars and more news.
NASA’s Lunar Reconnaissance Orbiter (LRO) LROC Wide angle camera (WAC) color (689 nm, 415 nm, 321 nm) overlain on WAC sunset BW image. Note the proximity of the landing site to a contact between red and blue maria. Credit: NASA/GSFC/Arizona State UniversityNASA’s LRO spacecraft (top) protected by gray colored blankets is equipped with 7 science instruments located at upper right side of spacecraft. LRO is piggybacked atop NASA’s LCROSS spacecraft. Payload fairing in background protects the spacecraft during launch and ascent on Atlas V rocket. Credit: Ken Kremer
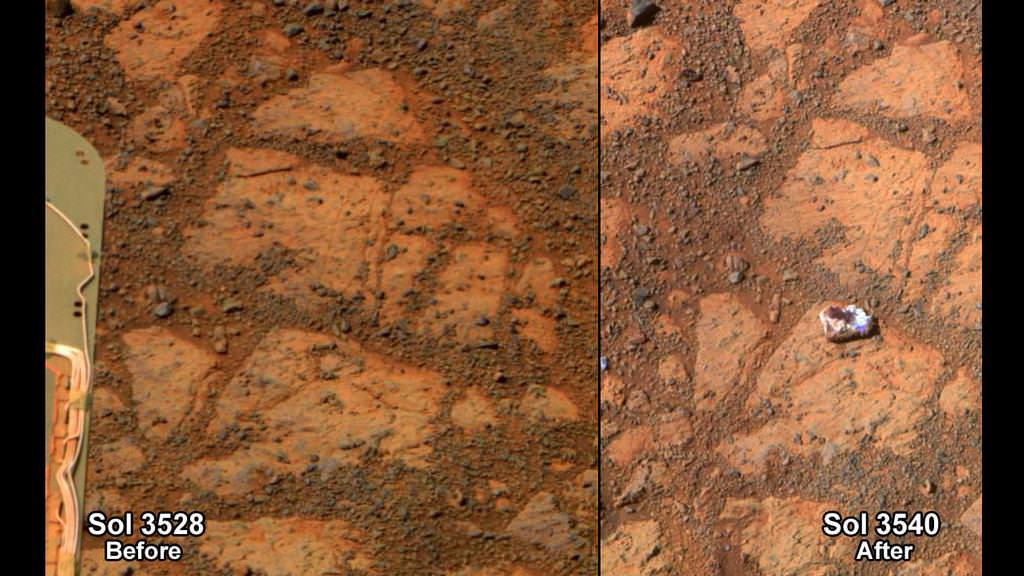
This before-and-after pair of images of the same patch of ground in front of NASA's Mars Exploration Rover Opportunity 13 days apart documents the arrival of a bright rock onto the scene. Credit: NASA/JPL-Caltech/Cornell Univ./Arizona State Univ.
Hoo boy. Just mention the word “mystery” in conjunction with the planet Mars and all sorts of folks come out of the woodwork. Some start talking about silicon-based alien life forms or Mars-based reptiles or projectiles being tossed by little green men. The latest is that there’s an exotic mushroom on Mars, and this idea has sparked a lawsuit against NASA.
This all started when a strange rock suddenly appeared in photos from the Opportunity rover in a spot where photos taken just 12 sols (Mars days) earlier showed no rock. Mission principal investigator Steve Squyres talked about it during the recent 10-year anniversary celebration for the rover.
“It appeared,” Squyres said during the event. “It just plain appeared and we haven’t driven over that spot.”
They’ve named the rock “Pinnacle Island,” and Squyres and the Mars Exploration Rover team think the most likely scenario is that the rover actually dislodged the rock with its wheels and flicked it to a new spot as the rover was turning. “We had driven a meter or two away from here and somehow maybe one of the wheels managed spit it out of the ground,” Squyres said. “That’s the more likely theory.”
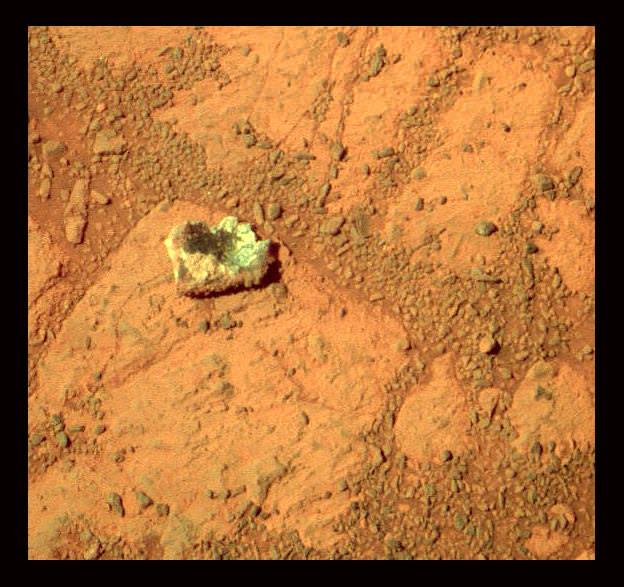
A colorized version of the rock called Pinnacle Island. Credit: NASA/JPL, color by Stuart Atkinson.
Another idea is that the rock is a piece of ejecta – a piece of rock which plunked down near the rover after being blasted out of the ground by a nearby meteoroid impact.
An idea favored by our readers here on Universe Today is that it possibly was a meteorite, dropping in from space and landing near the rover. Another thought is that since Opportunity is currently at Solander Point, a mountain of sorts, the rock may have rolled down to its new spot from a higher outcrop.
We checked in with Steve Squyres to see if there any new possibilities and he said the team thoughts on the rock’s appearance are the same as they were last week.
“We think the most likely hypothesis is that it was dislodged by the rover wheels from a location that may currently be obscured by the solar arrays,” he said via email.
Squyres described the rock as “white around the outside, in the middle there’s low spot that is dark red. It looks like a jelly donut,” and said it’s like nothing they’ve ever seen before on Mars.
Then things got weird. We received an email this week from neurologist and self-proclaimed astrobiologist Dr. Rhawn Joseph, of the Journal of Cosmology fame who we’ve previously written about.
He has filed a lawsuit in the US District Court Northern District of California claiming the white rock is biological in nature and is seeking an order forcing NASA, Administrator Charles Bolden, and others including Squyres to “examine a biological specimen on Mars” and that NASA is failing to investigate the rock thoroughly enough.
Joseph is petitioning the Federal Court for a writ of mandamus to “compel and order” NASA to “perform a public, scientific, and statutory duty which is to closely photograph and thoroughly scientifically examine and investigate a putative biological organism which was identified (and thus discovered) by Petitioner.”
From the lawsuit:
“Petitioner immediately recognized that bowl-shaped structure, hereafter referred to as Sol 3540,resembling a mushroom-like fungus, a composite organism consisting of colonies of lichen and cyanobacteria, and which on Earth is known as Apothecium.”
“When examined by Petitioner the same structure in miniature was clearly visible upon magnification and appears to have just germinated from spores.”
For one thing, this is a rock. A rock. Squyres has said Pinnacle Island is very high in sulfur and magnesium, with twice as much manganese as anything else they’ve seen on Mars.
Second, the rover team is already throwing everything they’ve got at this rock.
“We are as we speak situated with the rover, with its instruments, making measurements on this rock. We’ve taken pictures of both the donut part and the jelly part,” Squyres said during the 10-year anniversary event.
Third, Joseph is not the “discoverer” of this rock. The MER team is and they’ve given full disclosure, talking frequently about the rock and posting all the images they’ve taken of the rock available for anyone to peruse.
They’ve offered a few ideas, but this image from sol 3544 pointed out by “marsophile” on the forum might be the most compelling:
A disturbed area near the Opportunity rover that could be the spot where ‘Pinnacle Island’ came from. Credit: NASA/JPL.
There appears to hole in the ground where a rock may have previously been.
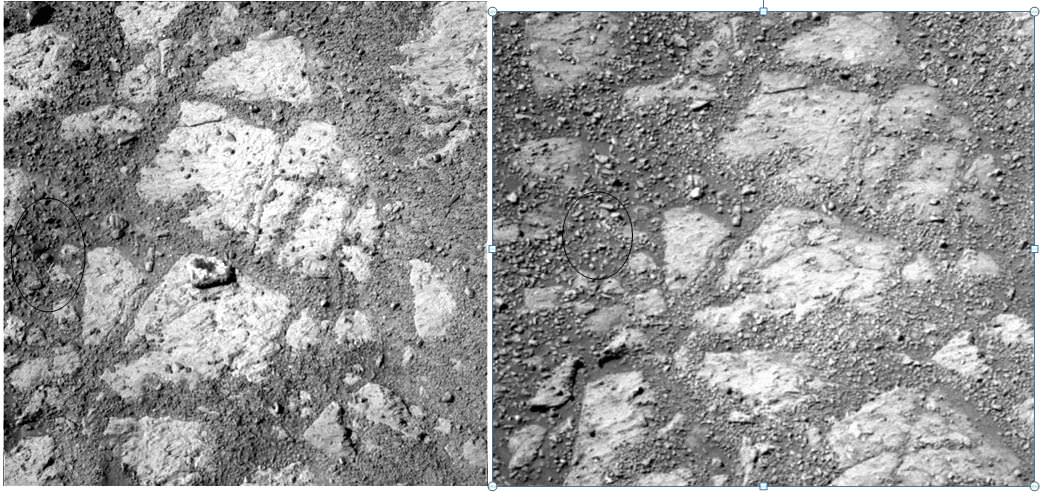
Another set of images submitted by Universe Today reader Yuksel Kenaroglu highlights a possible location where the rock may have come from, but changes in lighting might just be making things look different in the two images:
Two images from the Opportunity rover from Sol 3528 (right) and Sol 3540 showing possible location of where the ‘Jelly Donut’ rock came from. Image credit: Credit: NASA/JPL-Caltech/Cornell Univ./Arizona State Univ., notation via Yuksel Kenaroglu.
Joseph said he wants “A) 100 high resolution close-up infocus photos of the specimen identified in Sol 3540, at various angles, from all sides, and from above down into the “bowl” of the specimen, and under appropriate lighting conditions which minimize glare. B) Take a minimum of 24 microscopic in-focus images of the exterior, lip, walls, and interior of the specimen under appropriate lighting conditions. C) NASA, and the rover team must make public and supply Petitioner with all high resolution photos and images of that specimen as demanded in A and B.”
Surely, Squyres and the MER team would like nothing better than to solve the mystery of how this rock appeared and just like the Mars flower, and the piece of plastic there’s very little likelihood that biology plays any role in this rock an how it suddenly appeared.