Landmark Discovery: New Results Provide Direct Evidence for Cosmic Inflation

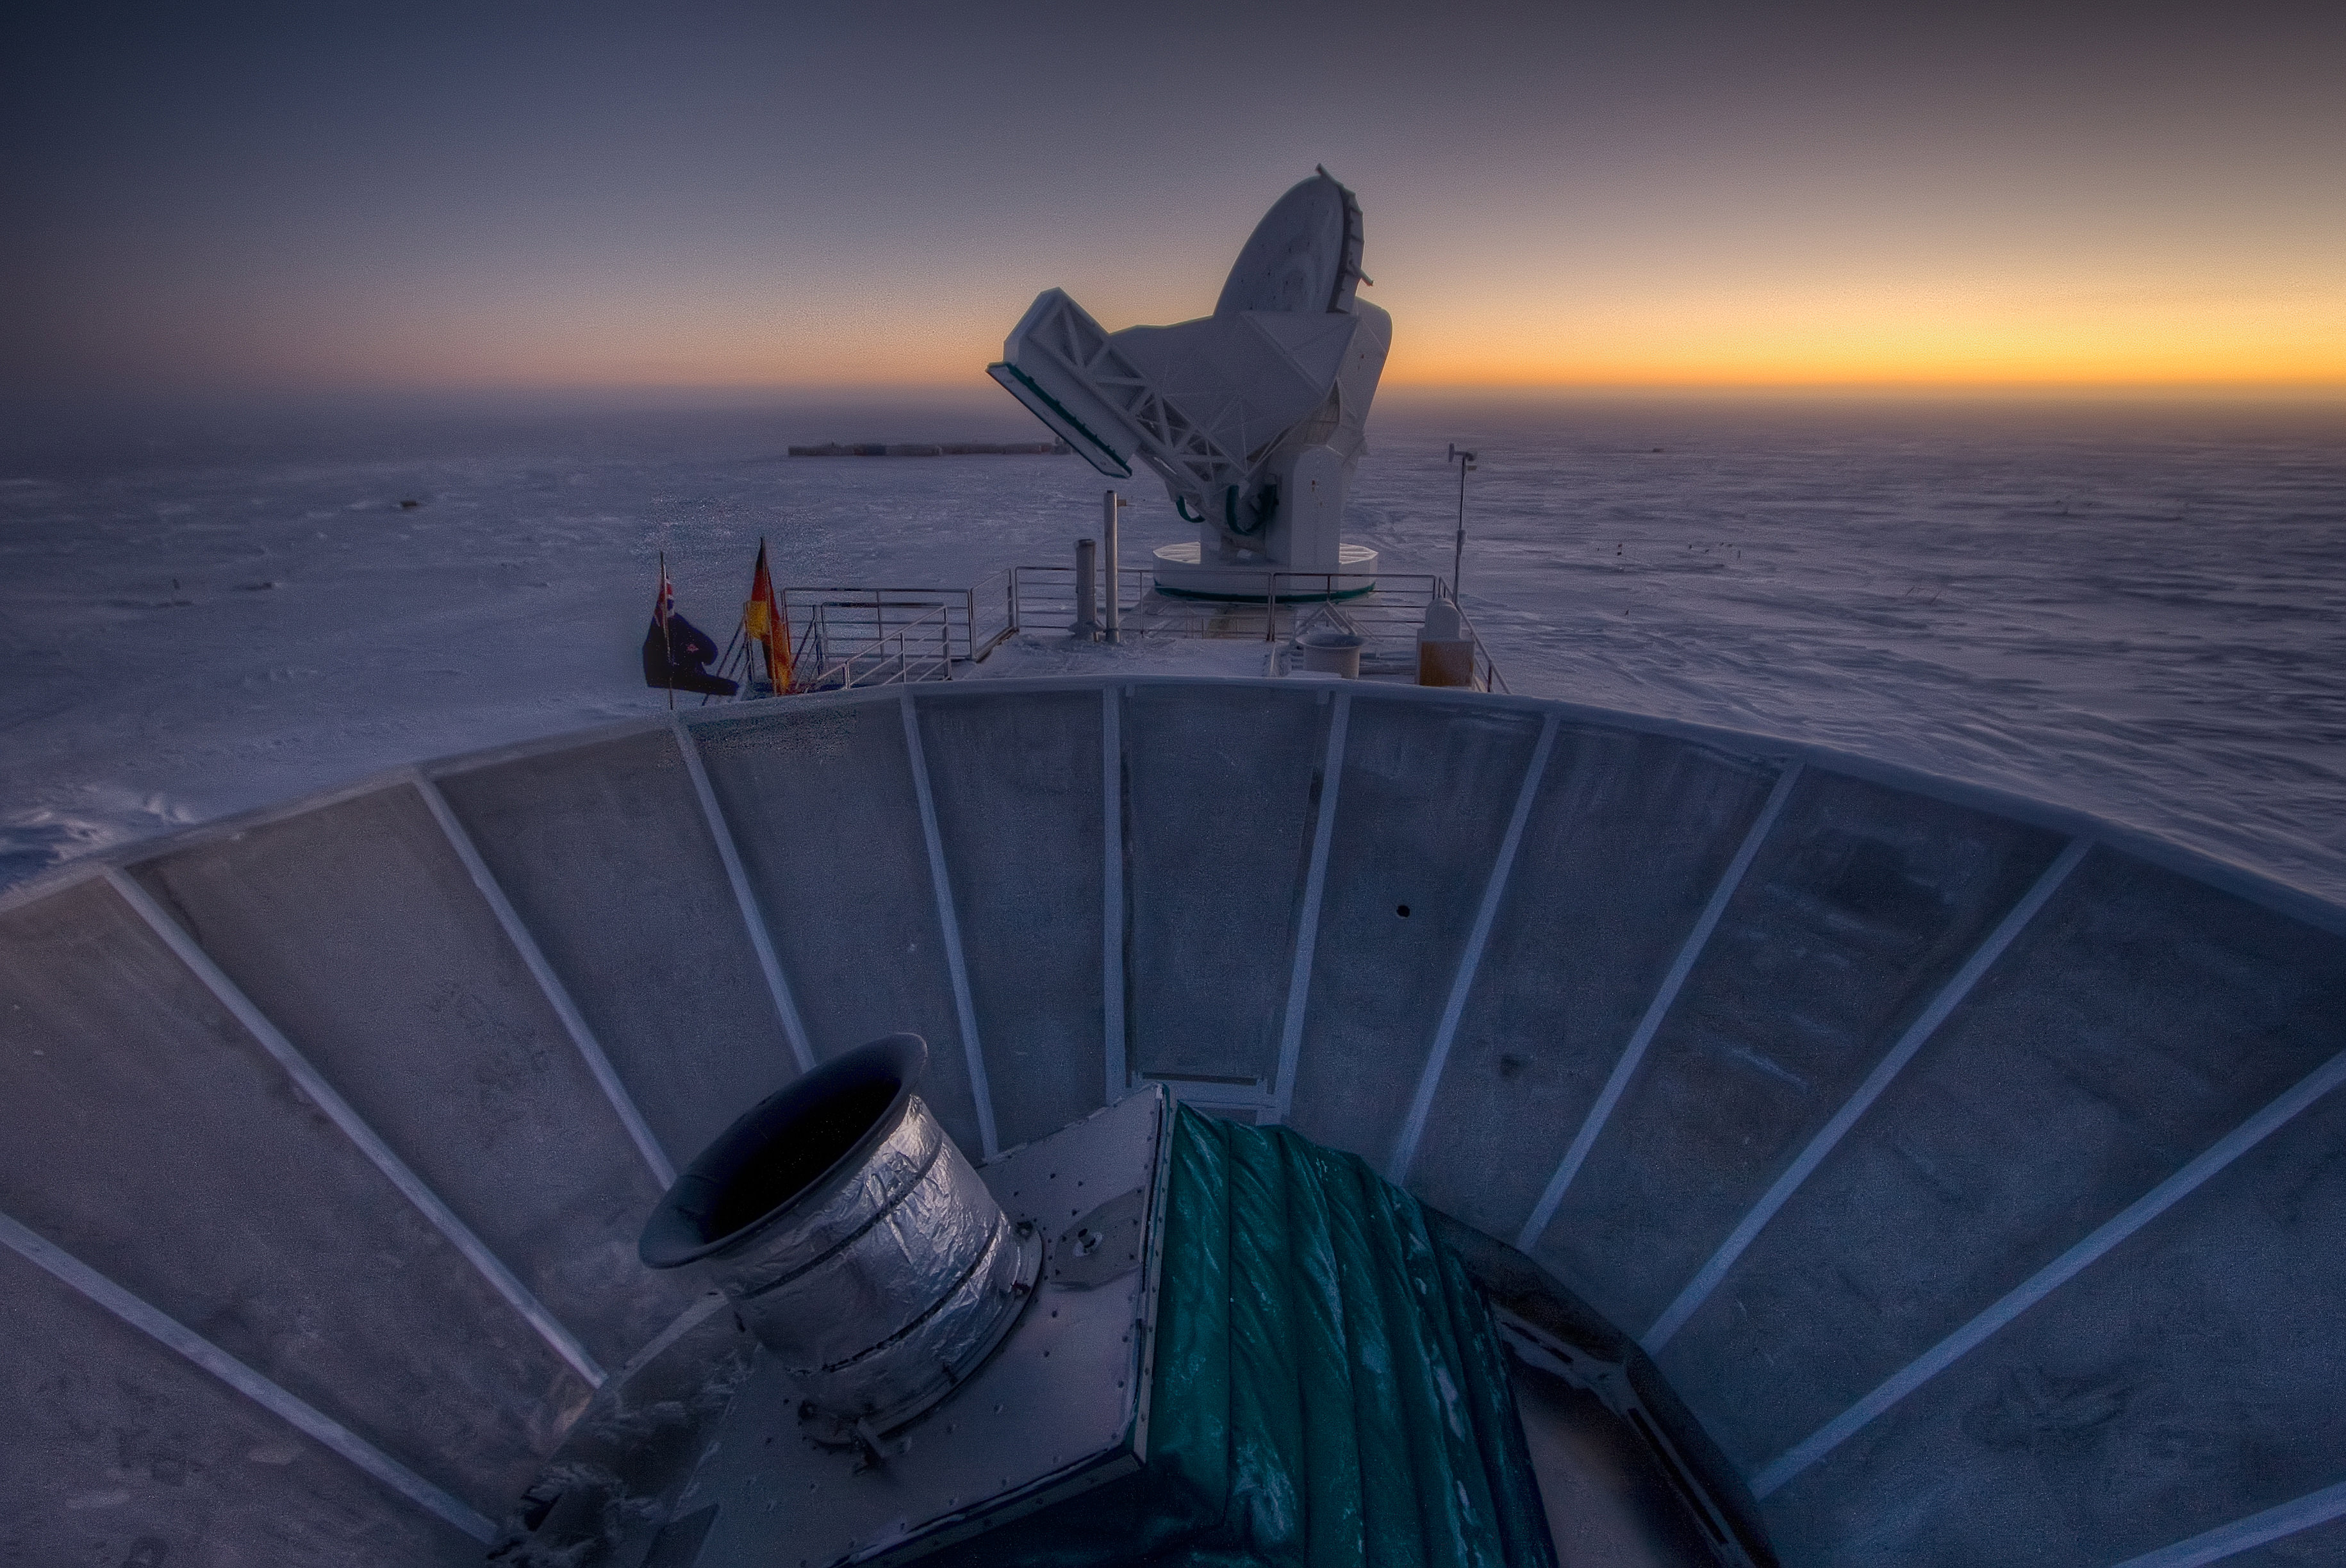
The BICEP telescope located at the south pole. Image Credit: CfA / Harvard

Astronomers have announced Nobel Prize-worthy evidence of primordial gravitational waves — ripples in the fabric of spacetime — providing the first direct evidence the universe underwent a brief but stupendously accelerated expansion immediately following the big bang.

“The implications for this detection stagger the mind,” said co-leader Jamie Bock from Caltech. “We are measuring a signal that comes from the dawn of time.”

BICEP2 (Background Imaging of Cosmic Extragalactic Polarization) scans the sky from the south pole, looking for a subtle effect in the cosmic microwave background (CMB) — the radiation released 380,000 years after the Big Bang when the universe cooled enough to allow photons to travel freely across the cosmos.

The CMB fills every cubic centimeter of the observable universe with approximately 400 microwave photons. The so-called afterglow of the big bang is nearly uniform in all directions, but small residual variations (on the level of one in 100,000) in temperature show a specific pattern. These irregularities match what would be expected if minute quantum fluctuations had ballooned to the size of the observable universe today.

So astronomers dreamed up the theory of inflation — the epoch immediately following the big bang (10-34 seconds later) when the universe expanded exponentially (by at least a factor of 1025) — causing quantum fluctuations to magnify to cosmic size. Not only does inflation help explain why the universe is so smooth on such massive scales, but also why it’s flat when there’s an infinite number of other possible curvatures.

While inflation is a pillar of big bang cosmology, it has remained purely a theoretical framework. Many astronomers don’t buy it as we can’t explain what physical mechanism would have driven such a massive expansion, let alone stop it. The results announced today provide a strong case in support of inflation.

In Depth: We’ve Discovered Inflation! Now What?

The trick is in looking at the CMB where inflation’s signature is imprinted as incredibly faint patterns of polarized light — some of the light waves have a preferred plane of vibration. If a gravitational wave passes through the fabric of spacetime it will squeeze spacetime in one direction (making it hotter) and stretch it in another (making it cooler). Inflation will then amplify these quantum fluctuations into a detectable signal: the hotter and therefore more energetic photons will be visible in the CMB, leaving a slight polarization imprint.

E-modes (left side)
E-modes (left side) look the same when reflected in a mirror. B-modes (right side) do not. Image Credit: Nathan Miller

This effect will create two distinct patterns: E-modes and B-modes, which are differentiated based on whether or not they have even or odd parity. In simpler terms: E-mode patterns will look the same when reflected in a mirror, whereas B-mode patterns will not.

E-modes have already been extensively detected and studied. While both are the result of primordial gravitational waves, E-modes can be produced through multiple mechanisms whereas B-modes can only be produced via primordial gravitational waves. Detecting the latter is a clean diagnostic — or as astronomers are putting it: “smoking gun evidence” — of inflation, which amplified gravitational waves in the early Universe.

“The swirly B-mode pattern is a unique signature of gravitational waves because of their handedness. This is the first direct image of gravitational waves across the primordial sky,” said co-leader Chao-Lin Kuo from Stanford University, designer of the BICEP2 detector.
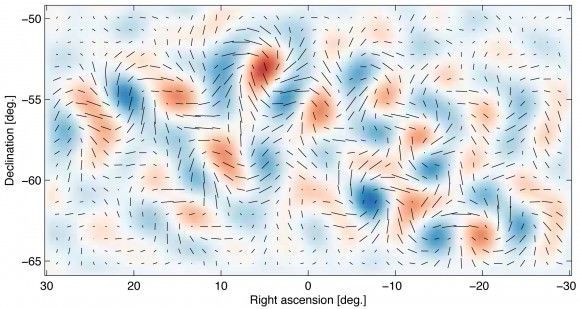
Polarization patterns imprinted in the CMB. Image Credit: CfA
Shown here are the actual B-mode polarization patterns provided by the BICEP2 Telescope. Image Credit: Harvard-Smithsonian Center for Astrophysics

The team analyzed sections of the sky spanning one to five degrees (two to 10 times the size of the full moon) for more than three years. They created a unique array of 512 detectors, which collectively operate at a frosty 0.25 Kelvin. This new technology enabled them to make detections at a speed 10 times faster than before.

The results are surprisingly robust, with a 5.9 sigma detection. For comparison, when particle physicists announced the discovery of the Higgs Boson in July, 2012 they had to reach at least a 5 sigma result, or a confidence level of 99.9999 percent.  At this level, the chance that the result is erroneous due to random statistical fluctuations is only one in a million. Those are pretty good odds.

While the team was careful to rule out any errors, it will be crucial for another team to verify these results. The Planck spacecraft, which has been producing exquisite measurements of the CMB, will be reporting its own findings later this year. At least a dozen other teams have also been searching for this signature.

“This work offers new insights into some of our most basic questions: Why do we exist? How did the universe begin?” commented Harvard theorist Avi Loeb. “These results are not only a smoking gun for inflation, they also tell us when inflation took place and how powerful the process was.”

Not only does inflation succeed in explaining the origin of cosmic structure — how the cosmic web formed from the smooth aftermath of the big bang — but it makes wilder predictions as well. The model seems to produce not just one universe, but rather an ensemble of universes, otherwise known as a multiverse. This collection of universes has no end and no beginning, continuing to pop up eternally.

Today’s results provide a stronger case for “eternal inflation,” which gives a new perspective on our desolate place within the cosmos. Not only do we live on a small planet orbiting one star out of hundreds of billions, in one galaxy out of hundreds of billions, but our entire universe may just be one bubble out of a vast cosmic ocean of others.

The detailed paper may be found here.
The full set of papers are here.
An FAQ summarizing the data is here.

Till Hellas Freezes Over – See Frost and Clouds in Mars’ Largest Crater

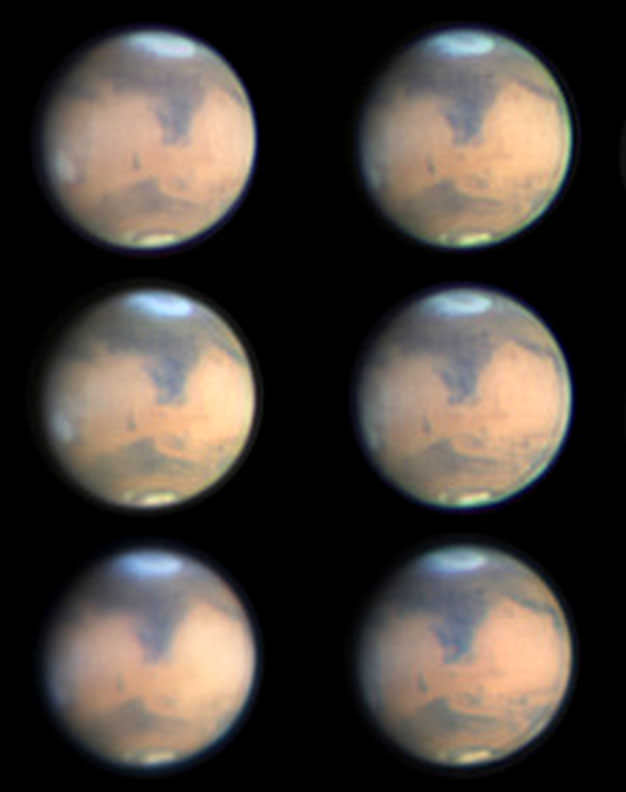
Mars photographed during part of its rotation from Melbourne, Australia on March 8. The bright "cap" marks Hellas, now covered in wintertime frost and clouds. Credit: Maurice Valimberti

Earth’s changing weather always makes life interesting. Seeing weather on other planets through a telescope we sense a kinship between our own volatile world and the fluttering image in the eyepiece. With the  April 8 opposition of Mars rapidly approaching, you won’t want to miss a striking meteorological happening right now on the Red Planet. 

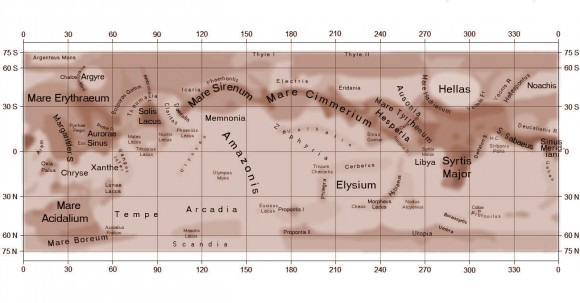
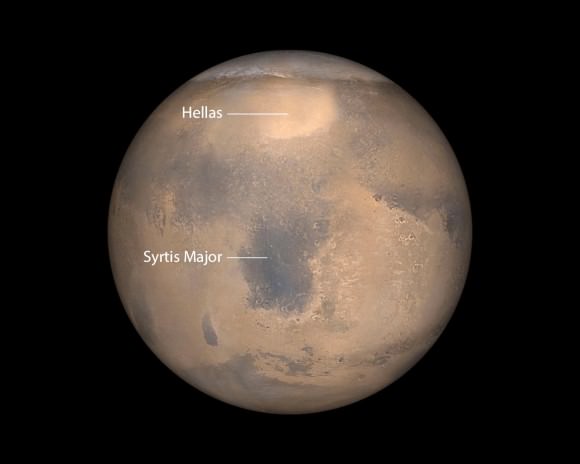
Map showing the most prominent dark features on Mars. Hellas is at upper right. To its north is the Africa-shaped windswept volcanic plain Syrtis Major. Credit: A.L.P.O.
Map showing the most prominent dark features on Mars. Hellas is at upper right. Credit: A.L.P.O.

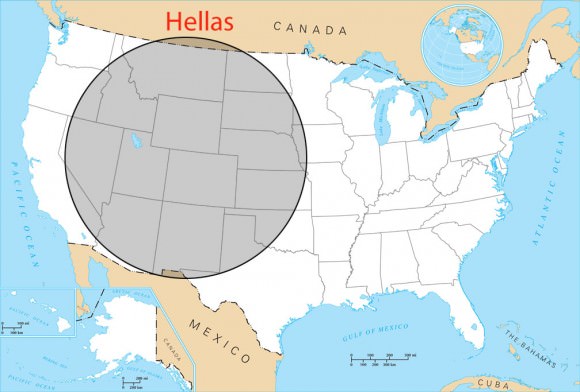
Winter’s already well underway in the planet’s southern hemisphere and there’s no better place to see it than over Hellas, Mars’ biggest impact crater. Hellas formed some 4 billion years when a small asteroid crashed into the young planet and left a scar measuring 1,400 miles (2,300 km) wide and 26,465 feet (7,152 meters) deep. Point your telescope in its direction in the next few weeks and you’ll see what looks at first like the planet’s south polar cap. Don’t be deceived. That’s Hellas coated in dry ice frost and filled with wintertime clouds.

The Hellas impact basin, also known as Hellas Planitia. After Mars' Utopia Planitia and the moon's South Pole-Aitken Basin, Hellas is the third largest confirmed crater in the solar system.
The Hellas impact basin, also known as Hellas Planitia, is 1,400 miles wide. After Mars’ Utopia Planitia and the moon’s South Pole-Aitken Basin, Hellas is the third largest confirmed crater in the solar system.

Right now, Mars’ northern hemisphere, along with the north polar cap, are tipped our way. Though the cap is rapidly vaporizing as the northern summer progresses,  you can still spot it this month as a small dab of white along the northern limb in 6-inch (15 cm) and larger telescopes. Use a magnification upwards of 150x for the best views. The south polar cap can’t be seen because it’s tipped beyond the southern limb.

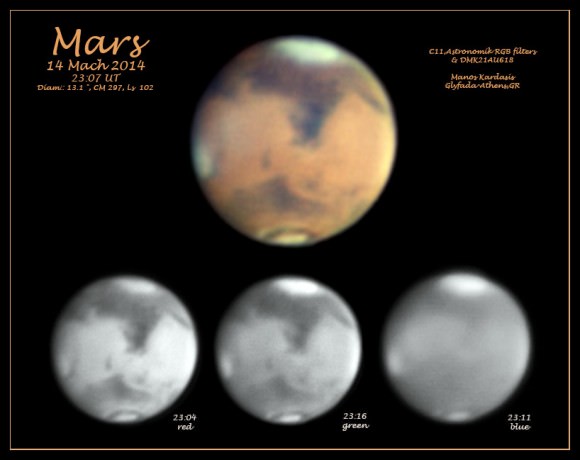
Mars from Athens, Greece on March 14, 2014 with Hellas (top), Syrtis Major and both morning and evening limb water clouds. Credit: Manos Kardasis
Mars from Athens, Greece on March 14, 2014 with Hellas (top), Syrtis Major and both morning and evening limb water clouds. The winter-whitened Hellas impact basin is best seen using magnifications of 150x or higher. Credit: Manos Kardasis

Along with nearby Syrtis Major, Hellas was one of the first features discovered with the telescope. Even in summer its pale floor stands out against the darker volcanic features of the planet. Though windswept and bitter cold now, Hellas’ great depth makes it one of the warmest places on Mars during the summer months. Mid-summer atmospheric pressure has been measured at more than 10 millibars, more than twice the planet’s mean. Afternoon high temperatures reach near the freezing point (32 F / 0 C) with nighttime lows around -50 F (-45 C). Winter temperatures are much more severe with lows around -22o F (-140 C). Carbon dioxide condenses as frost and whitens the floors of many craters during this time.

Mars photographed by the Mars Global Surveyor shows the equally prominent Syrtis Major and the Hellas impact basin. Credit; NASA/JPL/Malin Space Systems
Mars photographed by the Mars Global Surveyor shows the equally prominent Syrtis Major and the Hellas impact basin. Syrtis Major is an ancient, low relief shield volcano. Credit; NASA/JPL/Malin Space Systems

We can only see Hellas when that hemisphere is turned in our direction; this happens for about a week and  a half approximately once a month.  European observers are favored this week with Hellas well placed near the planet’s central meridian from 1 – 4 a.m. local time. Why the outrageous hour? Mars rises around 10 p.m. but typically looks soft and mushy in the telescope until it’s high enough to clear the worst of atmospheric turbulence 2 – 3 hours later. North and South American observers will get their turn starting this Saturday March 22nd around 12:30 – 1 a.m. Good Hellas viewing continues through early April.

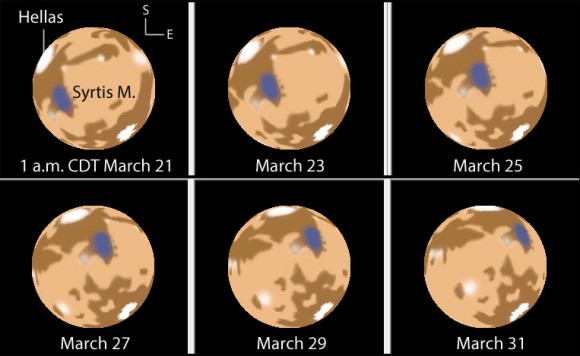
Mars at 1 a.m. CDT on successive nights starting March 21, 2014. Notice how planetary features appear to rotate to the east night to night. Created with images from Meridian
Mars at 1 a.m. CDT on successive nights starting March 21, 2014. Notice how planetary features appear to rotate slowly eastward night to night. Created with images from Meridian

Like Earth, Mars revolves from west to east on its axis, but because it rotation period is 37 minutes longer than Earth’s, Hellas and all Martian features appear to drift slowly eastward with each succeeding night. A feature you observed face-on at midnight one night will require staying up until 2:30 a.m. a week later for Mars to “rotate it back” to the same spot. To keep track of the best times to look for Hellas or anything else on Mars, I highly recommend the simple, free utility called Meridian created by Claude Duplessis. Set your time zone and you’ll know exactly the best time to look.

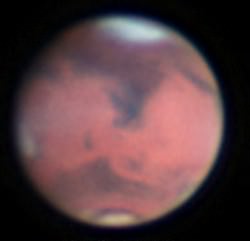
Mars on March 8, 2014 shows not only clouds over Hellas but evening limb clouds. Credit: W.L. Chin
Mars on March 8, 2014 shows clouds over Hellas and evening limb clouds. Credit: Chin Wei Loon

While you’re out watching the Martian winter at work, don’t forget to also look for the shrinking north polar cap and bright, patchy clouds along the planet’s morning (east) and evening limbs. You can use the map above to try and identify the many subtle, gray-toned features named after lands in classic antiquity by 19th century Italian astronomer and Mars aficionado Giovanni Schiaparelli.

I will you success in seeing Hellas and encourage you to share your observations with us here at Universe Today.

Hubble Captures Starbirth In A Monkey’s Head As Telescope Approaches 24 Years In Space

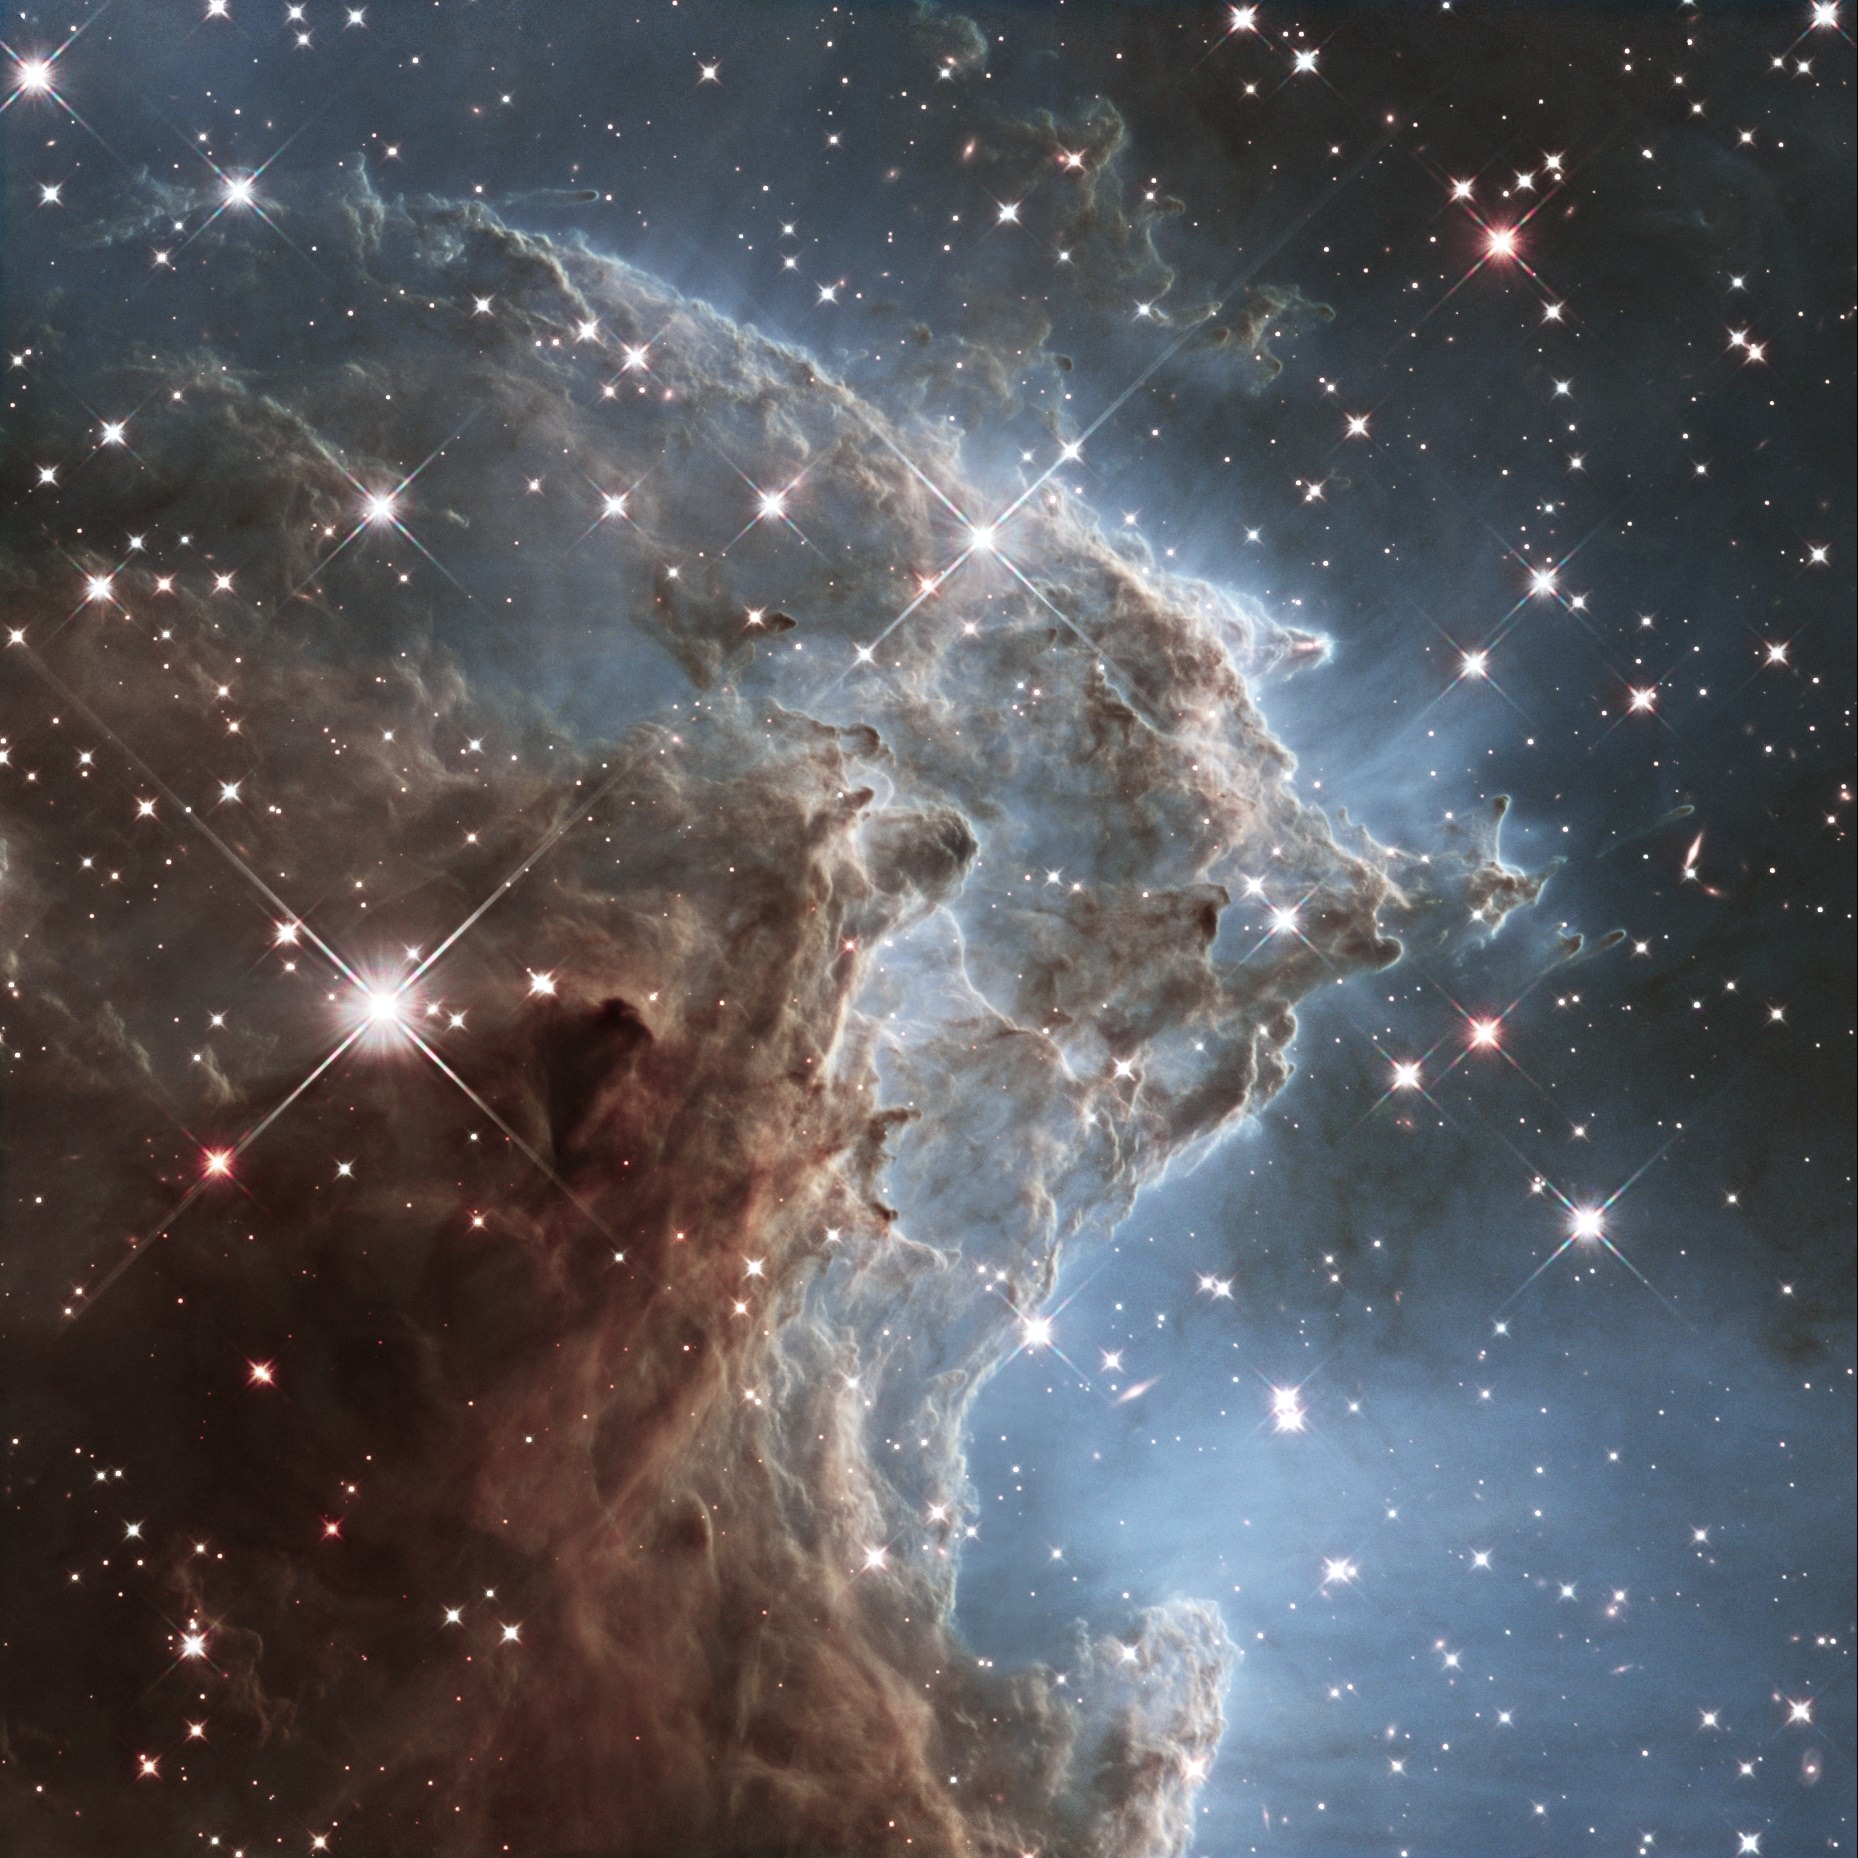
A 2014 image of NGC 2174 by the Hubble Space Telescope. Credit: NASA/ESA and the Hubble Heritage Team (STScI/AURA)

Billowing gas clouds and young stars feature in this February Hubble Space Telescope image, released as the telescope approaches its 24th birthday this coming April. The telescope has seen a lot of drama over the years, but in this case, thankfully the excitement is taking place 6,400 light-years away. Here you can see starbirth in action in the nebula NGC 2174, which is sometimes called the Monkey Head Nebula.

“This region is filled with young stars embedded within bright wisps of cosmic gas and dust. Dark dust clouds billow outwards, framed against a background of bright blue gas. These striking hues were formed by combining several Hubble images taken through different coloured filters, revealing a broad range of colours not normally visible to our eyes,” the European Space Agency wrote.

“These vivid clouds are actually a violent stellar nursery packed with the ingredients needed for building stars. The recipe for cooking up new stars is quite inefficient, and most of the ingredients are wasted as the cloud of gas and dust disperses. This process is accelerated by the presence of fiercely hot young stars, which triggers high-speed winds that help to blow the gas outwards.”

Hubble’s dramatic history includes a deformed mirror, a rescue mission, and a nearly last-minute decision to do a shuttle flight for repairs and upgrades when the shuttle program was wrapping up. You can read more about Hubble’s colorful history at the Space Telescope Science Institute.

And Hubble has captured this nebula before, as you can see in this 2011 release.

Sources: ESA and Space Telescope Science Institute

China’s Yutu Moon rover starts Lunar Day 4 Awake but Ailing

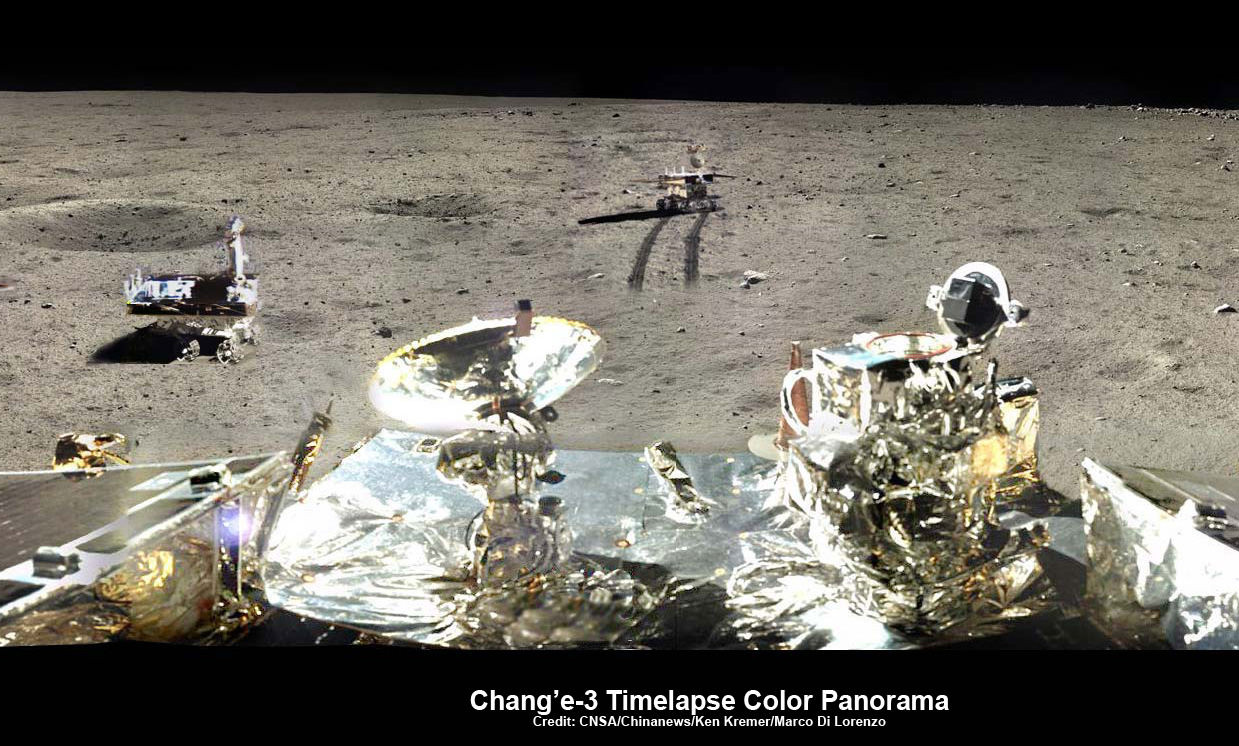
Chang’e-3/Yutu Timelapse Color Panorama This newly expanded timelapse composite view shows China’s Yutu moon rover at two positions passing by crater and heading south and away from the Chang’e-3 lunar landing site forever about a week after the Dec. 14, 2013 touchdown at Mare Imbrium. This cropped view was taken from the 360-degree timelapse panorama. See complete 360 degree landing site timelapse panorama herein and APOD Feb. 3, 2014. Chang’e-3 landers extreme ultraviolet (EUV) camera is at right, antenna at left. Credit: CNSA/Chinanews/Ken Kremer/Marco Di Lorenzo – kenkremer.com. See our complete Yutu timelapse pano at NASA APOD Feb. 3, 2014: http://apod.nasa.gov/apod/ap140203.htm

Chang’e-3/Yutu Timelapse Color Panorama
This newly expanded timelapse composite view shows China’s Yutu moon rover at two positions passing by crater and heading south and away from the Chang’e-3 lunar landing site forever about a week after the Dec. 14, 2013 touchdown at Mare Imbrium. This cropped view was taken from the 360-degree timelapse panorama. See complete 360 degree landing site timelapse panorama herein and APOD Feb. 3, 2014. Chang’e-3 landers extreme ultraviolet (EUV) camera is at right, antenna at left. Credit: CNSA/Chinanews/Ken Kremer/Marco Di Lorenzo – kenkremer.com.
See our complete Yutu timelapse pano at NASA APOD Feb. 3, 2014: http://apod.nasa.gov/apod/ap140203.htm[/caption]

KENNEDY SPACE CENTER, FL – China’s maiden moon rover Yutu awoke from her regular two week long slumber on Friday, March 14, to begin the 4th Lunar Day since the probes history making touchdown on the surface of Earth’s nearest neighbor in mid December 2013.

But the endearing robot is still ailing and suffering from mechanical control issues that popped up in late January 2014 according to Chinese space officials.

The Chang’e-3 mothership lander that deposited Yutu onto the pockmarked lunar surface also awoke two days earlier on Wednesday, March 12.

“Yutu and the lander have restarted their operations and are exploring as scheduled,” according to China’s State Administration of Science, Technology and Industry for National Defence (SASTIND), responsible for executing the Chang’e-3 mission.

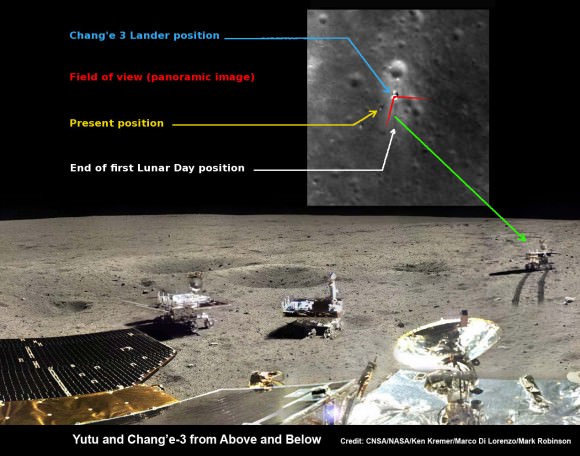
Yutu rover drives around Chang’e-3 lander  – from Above And Below. Composite view shows China’s Yutu rover and tracks driving in clockwise direction around Chang’e-3 lander from Above And Below (orbit and surface).  The Chang’e-3 timelapse lander color panorama (bottom) and orbital view (top) from NASA’s LRO orbiter shows Yutu rover after it drove down the ramp to the moon’s surface and began driving around the landers right side, passing by craters and heading south on Lunar Day 1.   It then moved northwest during Lunar Day 2.  Arrows show Yutu’s positions over time.    Credit: CNSA/NASA/Ken Kremer/Marco Di Lorenzo/Mark Robinson
Yutu rover drives around Chang’e-3 lander – from Above And Below. Composite view shows China’s Yutu rover and tracks driving in clockwise direction around Chang’e-3 lander from Above And Below (orbit and surface). The Chang’e-3 timelapse lander color panorama (bottom) and orbital view (top) from NASA’s LRO orbiter shows Yutu rover after it drove down the ramp to the moon’s surface and began driving around the landers right side, passing by craters and heading south on Lunar Day 1. It then moved northwest during Lunar Day 2. Arrows show Yutu’s positions over time. Credit: CNSA/NASA/Ken Kremer/Marco Di Lorenzo/Mark Robinson

Yutu is China’s first ever Moon rover and successfully accomplished a soft landing on the Moon on Dec. 14, 2013, piggybacked atop the Chang’e-3 mothership lander.

However, “the control issues that have troubled Yutu since January remain,” says China’s government owned Xinhua news agency.

The hugely popular ‘Yutu’ rover is still suffering from an inability to maneuver its life giving solar panels. It is also unable to activate its six wheels and move around the surface – as I reported here.

At the time that Yutu’s 2nd Lunar sleep period began on Jan. 25, 2014, Chinese space officials had announced that the robot’s future was in jeopardy after it suffered an unidentified “ mechanical control anomaly” due to the “complicated lunar surface.”

360-degree time-lapse color panorama from China’s Chang’e-3 lander. This new 360-degree time-lapse color panorama from China’s Chang’e-3 lander shows the Yutu rover at five different positions, including passing by crater and heading south and away from the Chang’e-3 lunar landing site forever during its trek over the Moon’s surface at its landing site from Dec. 15-22, 2013 during the 1st Lunar Day. Credit: CNSA/Chinanews/Ken Kremer/Marco Di Lorenzo – kenkremer.com.  See our Yutu timelapse pano at NASA APOD Feb. 3, 2014: http://apod.nasa.gov/apod/ap140203.htm
360-degree time-lapse color panorama from China’s Chang’e-3 lander
This new 360-degree time-lapse color panorama from China’s Chang’e-3 lander shows the Yutu rover at five different positions, including passing by crater and heading south and away from the Chang’e-3 lunar landing site forever during its trek over the Moon’s surface at its landing site from Dec. 15-22, 2013 during the 1st Lunar Day. Credit: CNSA/Chinanews/Ken Kremer/Marco Di Lorenzo – kenkremer.com. See our Yutu timelapse pano at NASA APOD Feb. 3, 2014: http://apod.nasa.gov/apod/ap140203.htm

Earlier this month, China announced that “Yutu suffered a control circuit malfunction in its driving unit.”

“The control circuit problem prevented Yutu from entering the second dormancy as planned,” said Ye Peijian, chief scientist of the Chang’e-3 program, in an exclusive interview with Xinhua.

A functioning control circuit is required to lower the rovers mast and protect the delicate components and instruments mounted on the mast from directly suffering from the extremely harsh cold of the Moon’s recurring night time periods.

“Normal dormancy needs Yutu to fold its mast and solar panels,” said Ye according to CCTV, China’s state run broadcaster.

Fortunately, the panoramic camera, radar and other sciene instruments and equipment are functioning normally, says SASTIND.

Yutu even snapped at least a pair new images of the lander during Lunar Day 3.

See our mosaic of Yutu’s Lunar Day 3 lander image as well as our the complete 360 degree timelapse color panorama from Lunar Day 1 herein and at NASA APOD on Feb. 3, 2014 – assembled by Marco Di Lorenzo and Ken Kremer.

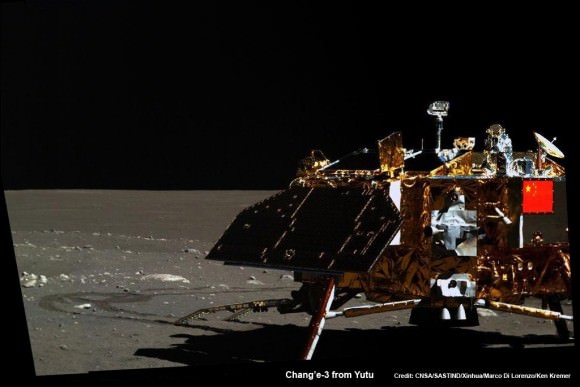
Mosaic of the Chang'e-3 moon lander and the lunar surface taken by the camera on China’s Yutu moon rover from a position south of the lander during Lunar Day 3.   Note the landing ramp and rover tracks at left.  Credit: CNSA/SASTIND/Xinhua/Marco Di Lorenzo/Ken Kremer
Mosaic of the Chang’e-3 moon lander and the lunar surface taken by the camera on China’s Yutu moon rover from a position south of the lander during Lunar Day 3. Note the landing ramp and rover tracks at left. Credit: CNSA/SASTIND/Xinhua/Marco Di Lorenzo/Ken Kremer

By reawakening on March 14, the 140 kg robot also survived for its three month design lifetime on the moon.

Yutu’s goal is to accomplish a roving expedition to investigate the moon’s surface composition and natural resources.

So far the 1200 kg Chang’e-3 lander is functioning as planned during its first three lunar days, says SASTIND.

“The lander’s optical telescope, extreme ultraviolet camera and lunar dust measurement device completed scheduled tasks and obtained a large amount of data,” says China’s government owned Xinhua news agency.

China is only the 3rd country in the world to successfully soft land a spacecraft on Earth’s nearest neighbor after the United States and the Soviet Union.

Stay tuned here for Ken’s continuing Chang’e-3, Orion, Orbital Sciences, SpaceX, commercial space, LADEE, Mars and more planetary and human spaceflight news. Learn more at Ken’s upcoming presentations at the NEAF astro/space convention on April 12/13.

Ken Kremer

Mercury Shrinking: the First Rock from the Sun Contracted More than Once Thought

MESSENGER image of Mercury from its third flyby (NASA/Johns Hopkins University Applied Physics Laboratory/Carnegie Institution of Washington)

Whatever Mercury’s did to trim down its waistline has worked better than anyone thought — the innermost planet in our Solar System has reduced its radius* by about 7 kilometers (4.4 miles), over double the amount once estimated by scientists.

Of course you wouldn’t want to rush to begin the Mercury diet — its planetary contraction has taken place over the course of 3.8 billion years, since the end of the Late Heavy Bombardment. Still — lookin’ good, Mercury!

These findings come thanks to the MESSENGER spacecraft, in orbit around Mercury since 2011. Now that MESSENGER has successfully mapped literally all of Mercury’s surface, detailed measurements of more than 5,900 landforms created by cooling and contraction of the planet’s crust have allowed researchers to more precisely determine its geologic history and answer some decades-old questions raised by Mariner 10 images.

“This discrepancy between theory and observation, a major puzzle for four decades, has finally been resolved,” said MESSENGER Principal Investigator Sean Solomon. “It is wonderfully affirming to see that our theoretical understanding is at last matched by geological evidence.”

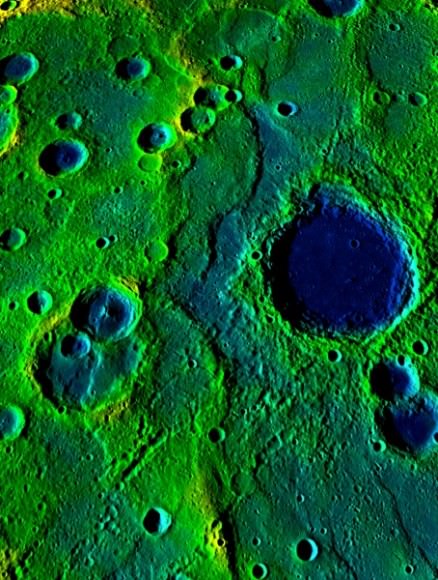
This image shows a long collection of ridges and scarps on the planet Mercury called a fold-and-thrust belt. The belt stretches over 336 miles (540 km). The colors correspond to elevation—yellow-green is high and blue is low. Image courtesy NASA/Johns Hopkins University Applied Physics Laboratory/Carnegie Institution of Washington.
This image shows a fold-and-thrust belt stretching over 540 km on Mercury. The colors correspond to elevation— yellow/green is high and blue is low. (Courtesy NASA/Johns Hopkins University Applied Physics Laboratory/Carnegie Institution of Washington.)

Using high-definition images acquired with MESSENGER’s MDIS (Mercury Dual Imaging System) instrument, planetary geologist at the Carnegie Institution of Washington and study lead author Paul Byrne and his colleagues identified 5,934 lobate scarps and wrinkle ridges on Mercury that are the result of contraction. From measurements of these features, the team determined that the planet’s radial contraction was much more than that estimated by models based on incomplete imaging from NASA’s Mariner 10 mission — the very first spacecraft to visit (but not orbit) Mercury.

Watch: Fly Across Mercury with MESSENGER!

“These new results resolved a decades-old paradox between thermal history models and estimates of Mercury’s contraction,” said Byrne. “Now the history of heat production and loss and global contraction are consistent.

“Interestingly, our findings are also reminiscent of now-obsolete models for how large-scale geological deformation occurred on Earth when the scientific community thought that the Earth only had one tectonic plate,” Byrne said. “Those models were developed to explain mountain building and tectonic activity in the nineteenth century, before plate tectonics theory.”

Unlike Earth, Mercury has only one global tectonic plate.

The findings were published in the Sunday, March 16 edition of the journal Nature Geoscience.

Source: MESSENGER press release. Read more about tectonic features on Mercury here.

*Mercury’s current radius is  2,440 kilometers (1,516 miles).

Rumors Flying Nearly as Fast as Their Subject: Have Gravitational Waves Been Detected?

This detailed map of the cosmic microwave background is created from seven years worth of data. It shows the "seed" structures of galaxies in the infant Universe. Image Credit: NASA

Last week the Harvard-Smithsonian Center for Astrophysics (CfA) stated rather nonchalantly that they will be hosting a press conference on Monday, March 17th, to announce a “major discovery.” Without a potential topic for journalists to muse on, this was as melodramatic as it got.

But then the Guardian posted an article on the subject and the rumors went into overdrive. The speculation is this: a U.S. team is on the verge of confirming they have detected primordial gravitational waves — ripples in the fabric of spacetime that carry echoes of the big bang nearly 14 billion years ago.

If there is evidence for gravitational waves, it will be a landmark discovery, ultimately changing the face of physics.

Not only are gravitational waves the last untested prediction of Albert Einstein’s General Theory of Relativity, but primordial gravitational waves will allow astronomers to glimpse the universe in its infancy.

“It’s been called the Holy Grail of cosmology,” Hiranya Peiris, a cosmologist from University College London, told the Guardian. “It would be a real major, major, major discovery.” Any convincing evidence would almost certainly lead to a Nobel prize.

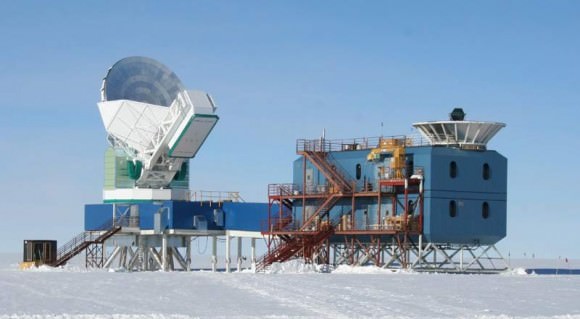
The signal is rumored to have been found by a telescope known as BICEP (Background Imaging of Cosmic Extragalactic Polarization), which scans the sky from the south pole, looking for a subtle effect in the cosmic microwave background (CMB): the radiation released 380,000 years after the big bang when space became transparent to light and photons were allowed to travel freely across the universe.

The South Pole Telescope (left) and BICEP (right). Image Credit: Dana Hrubes

While the CMB has been mapped in exquisite detail, astronomers think that hidden within the map is a second fingerprint, which would reveal gravitational waves. Its radiation was scattered toward us from the universe’s earliest atoms, similar to the way blue light is scattered toward us from the atoms in the sky. And just as the sky is slightly polarized — the waves have a preferred orientation — so is the CMB (on the level of a few percent).

Cosmologists are digging through the data, searching for a subtle twist in the polarized light, known as B-modes. If a gravitational wave moves through the fabric of spacetime, it will squeeze spacetime in one direction (the universe will look a little hotter) and stretch it in another (the universe will look a little cooler). The photons will scatter with a preferred direction, leaving a slightly polarized imprint on the CMB, due to the passing gravitational wave.

Not only will detecting this slight polarization pattern in the CMB allow astronomers to uncover evidence of primordial gravitational waves but they will provide proof that immediately after the big bang the universe expanded exponentially — inflated — by at least a factor of 1025. While the theory of inflation is a pillar of big bang cosmology and helps explain key features of the observable universe today (i.e. why the universe is outstandingly uniform on such massive scales), many physicists don’t buy it. It remains a theoretical framework because we can’t explain what physical mechanism would have driven such a massive expansion, let alone stop it.

Inflation is the only mechanism with the ability to amplify gravitational waves, born from quantum fluctuations in gravity itself, into a detectable signal.

“If a detection has been made, it is extraordinarily exciting,” Andrew Jaffe, a cosmologist from Imperial College, London, told the Guardian. “This is the real big tick-box that we have been waiting for. It will tell us something incredibly fundamental about what was happening when the universe was only 10-34 seconds old.”

But even if the rumors prove true, it’s crucial to remain skeptical. Extracting the signal is extremely tricky. The CMB’s temperature varies by a few parts in 100,000. In comparison, B-modes account for just one part in 10 million in the CMB temperature distribution.

The microwaves also travel across the entire observable universe first. Only last year the signal was detected in the CMB for the first time using the South Pole Telescope, but it was in fact distorted by intervening clusters of galaxies and not intrinsic to the CMB itself.

The announcement will be made on Monday at noon EST.

New Comet Jacques May Pass 8.4 million miles from Venus this July

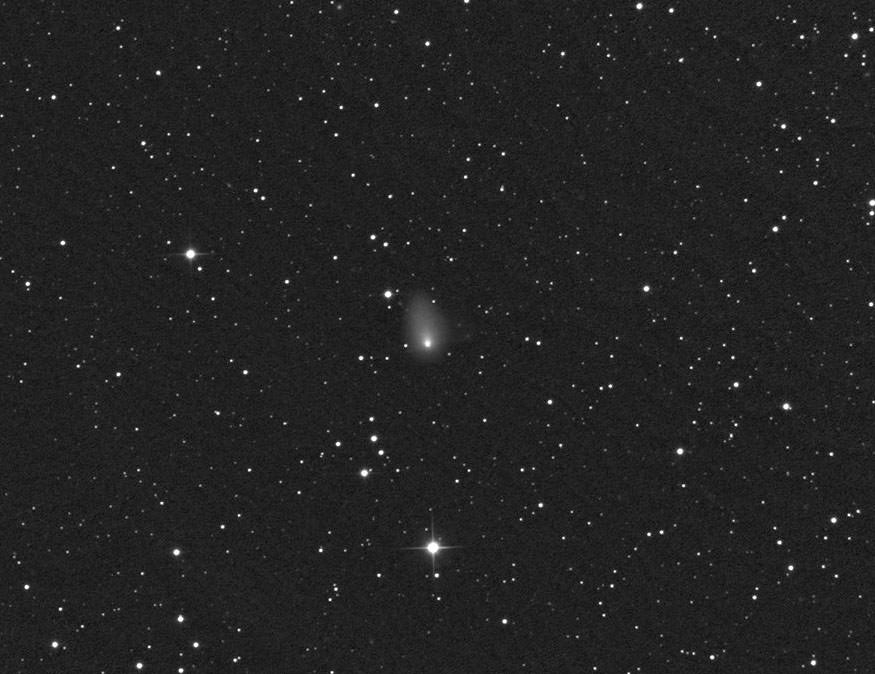
Comet C/2014 E2 Jacques photographed from Siding Spring Observatory on March 14, 2014. Credit: Rolando Ligustri

Congratulations to Cristovao Jacques and the SONEAR team!  On March 13 they snared C/2014 E2 (Jacques) in CCD images taken with a 0.45-meter (17.7-inch) wide-field reflector at the SONEAR (Southern Observatory for Near Earth Asteroids Research) observatory near Oliveira, Brazil. A very preliminary orbit indicates its closest approach to the sun will occur on June 29 at a distance of 56 million miles followed two weeks later by a relatively close flyby of Venus of 0.09 a.u. or  8.4 million miles (13.5 million km). If a comet approached Earth this closely so soon after perihelion, it would be a magnificent sight. Of course, watching from Venus isn’t recommended. Even if we could withstand its extreme heat and pressure cooker atmosphere, the planet’s perpetual cloud cover guarantees overcast skies 24/7.

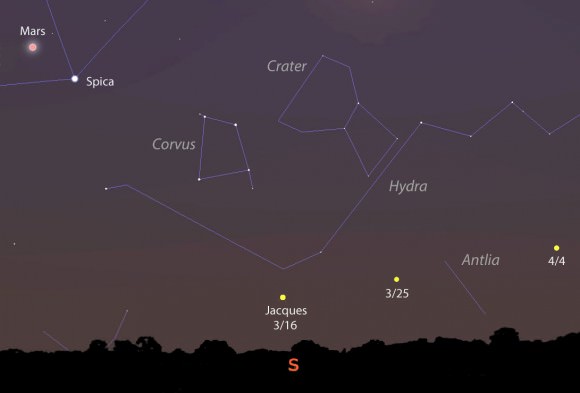
Comet Jacques travels across the deep southern sky in early spring as seen from mid-northern latitudes
Comet Jacques travels across the deep southern sky in early spring as seen from mid-northern latitudes. Approximate positions are shown through April 4. Stellarium

It’s the team’s second comet discovery this year after turning up C/2014 A4 (SONEAR) in January. Comet Jacques has been tracking across northern Centaurus since discovery. Over the next few nights, it straddles the border with Hydra where it will be visible low in the southern sky around for northern hemisphere observers from about midnight to 2 a.m. If you live on a Caribbean island and points south your view will be even better.


Steven Tilley’s animation of Comet C/2014 E2 Jacques over 35 minutes on March 13, 2014

Comet Jacques exhibits a dense, fairly bright 2-arc-minute coma or cometary atmosphere with a short northward-pointing tail. Brightness estimates have been hard to come by, but it appears the comet may be around magnitude +11.5 – 12 or within range of an 8-inch (20-cm) or larger telescope. One thing’s for certain. In the coming weeks, E2 will be approaching both the Earth and the sun and brightening as it slowly gains altitude in the evening sky.

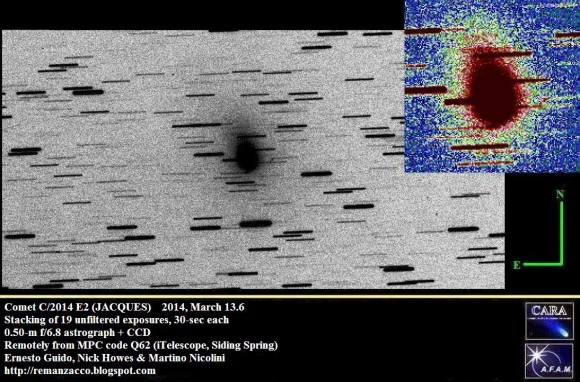
Another view of the comet on March 13 through a 0.5-meter (19.5-inch) telescope. Credit: Ernesto Guido, Nick Howes, Martino Nicolini

Shortly after perihelion, Comet Jacques will shine brightest at around magnitude +10-10.5 (though it could be brighter) and remain nearly this bright as it swings north from Orion into Perseus from mid-July to mid- August. Closest approach to Earth occurs on Aug. 29-30 at 54 million miles (87 million km). It will join Comet Oukameiden – predicted to reach binocular visibility in late August – to offer comet lovers much to look forward to as the summer wanes.

Check Out NASA’s New “Dashboard” for Spacecraft Communications

A screenshot of the new Deep Space Network visualization tool from NASA's 'Eyes on the Solar System' simulator.

How do scientists and engineers communicate with their spacecraft? All the robotic missions going to various points in our Solar System wouldn’t be possible if not for the Deep Space Network. And now there’s a fun new tool to watch how that communication works.

DSN Now is a live visualization of NASA’s Deep Space Network usage and which spacecraft the various antennae are talking to.

It shows realtime data of which of the three antenna complexes are being used to communicate with the various missions, how far away the spacecraft are, and various other details about data rates, speeds and modes. DSN Now is from NASA’s wonderful Eyes on the Solar System website (which uses real data to provide simulated 3-D views from of the Solar System). DSN Now came online today, March 14, 2014.

The Deep Space Network is not only used for sending commands and receiving data, but also for orbit determination, which is keeping track of where the spacecraft are with radiometric tracking data so that spacecraft navigators can get probes exactly where the scientists want them to go. The three 70-meter antennas, located at the DSN complexes at Goldstone, California, Madrid, Spain, and Canberra, Australia.

You can check out DSN Now here.

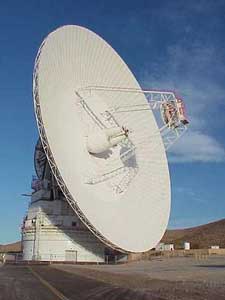
The Goldstone Antenna, part of the Deep Space Network.  Image Credit:  JPL
The Goldstone Antenna, part of the Deep Space Network. Image Credit: JPL

Watch Two Dark Moons Sneak Into Cassini’s Shots

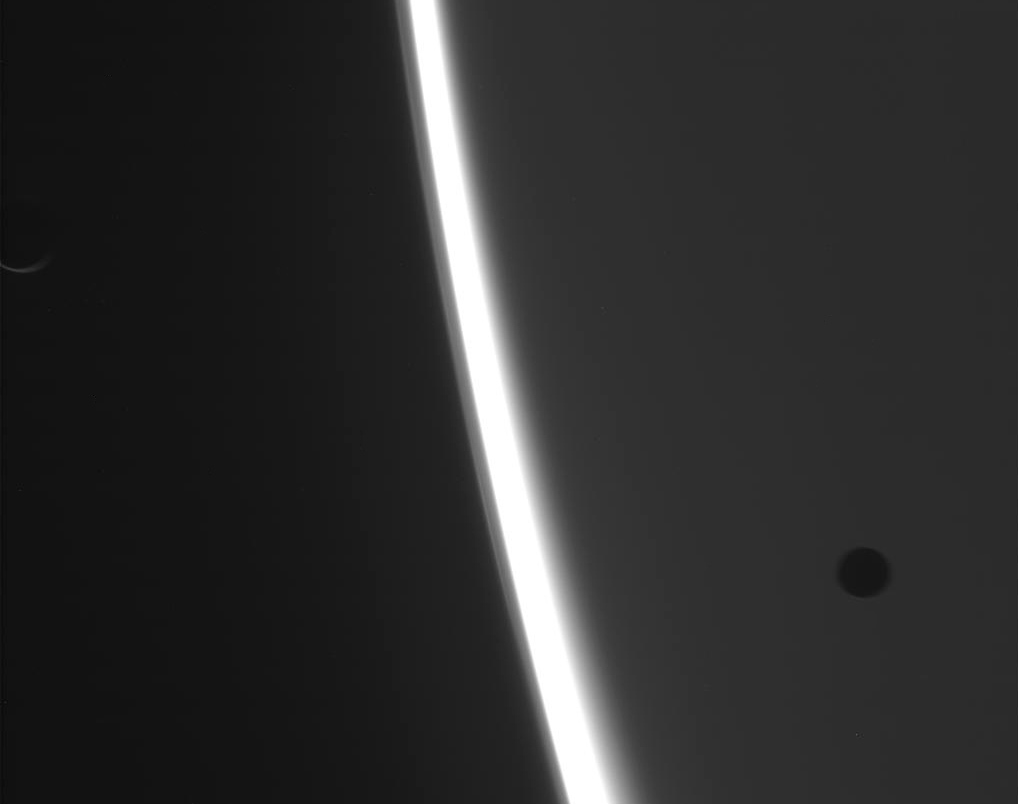
Raw image of Saturn with two moons acquired by Cassini on March 11, 2014 (NASA/JPL-Caltech/SSI)

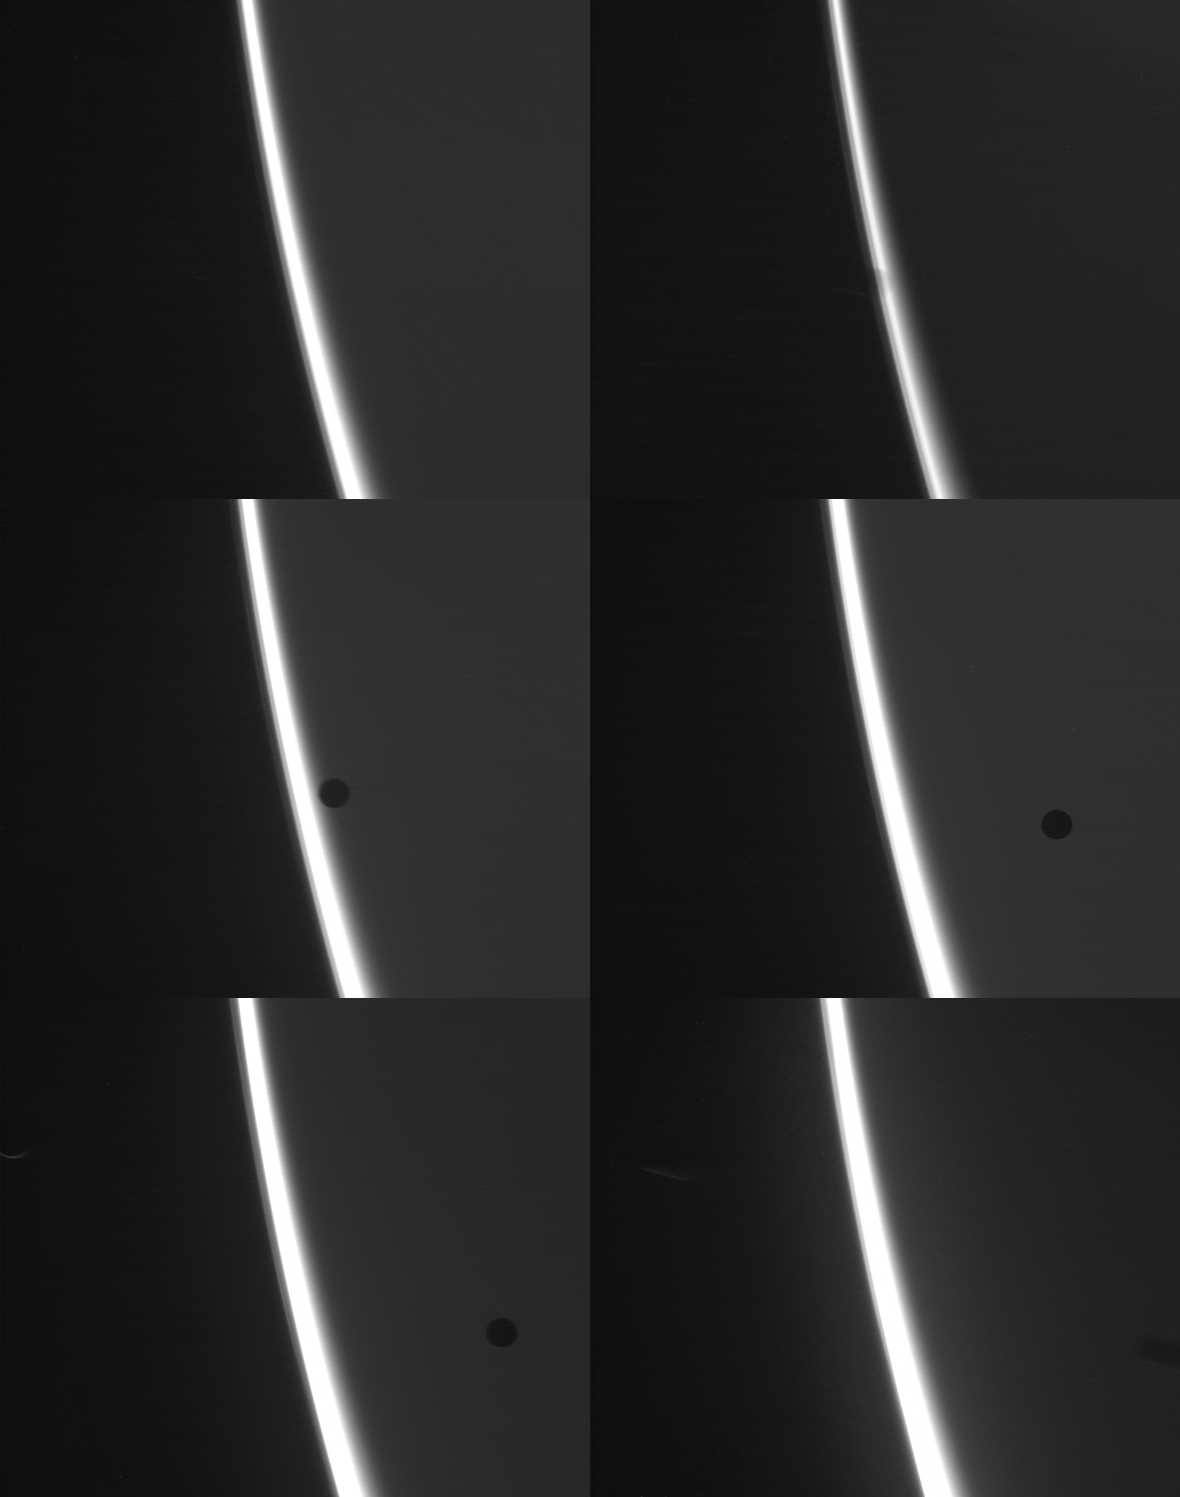
On March 11, NASA’s Cassini spacecraft was acquiring some images of Saturn’s back-lit limb when two of its moons decided to make an entrance. Like stage hands in a darkened theatre the moons quickly passed  across the scene, moving between Saturn and the spacecraft and, because of exposure time and spacecraft motion, getting a bit blurred in the process.

In the image above the silhouette of one moon can be seen at bottom right — Mimas, perhaps — while another’s crescent can be made out at upper left… possibly Enceladus. Very cool!

Watch an animation of the moons below:

Two of Saturn's moons drift into the scene on March 11, 2014 (NASA/JPL-Caltech/SSI. Animation by Jason Major.)
Two of Saturn’s moons drift into the scene on March 11, 2014 (NASA/JPL-Caltech/SSI. Animation by Jason Major.)

While I admit I’m not 100% sure which moons these are, based on their apparent shapes, positions, and relative sizes I’d make my guess that these are 318-mile (511-km) -wide Enceladus and the 246-mile (395-km) -wide Mimas.

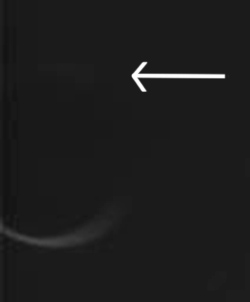
Possible location of icy spray, if this is Enceladus
Possible location of icy spray, if Enceladus is in fact this moon’s real name

Cassini was 843,762 miles (1,357,903 km) from Saturn when the images were acquired. And, if the larger moon at left is Enceladus, I’m thinking south in these images is up based on the barely-perceptible presence of a lighter area along its top edge that could be icy spray from its southern geysers. (See enlarged detail at right.)

Saturn, of course, is on the right. A small segment of the bright arc of its backlit limb is what’s running diagonally down across the image.

These images have not yet been calibrated or cataloged by NASA or the Cassini team.

See the latest raw images from Cassini on JPL’s mission page here.

*I say “dark moons” but actually Enceladus and Mimas are pretty bright, both being composed of a lot of ice. Enceladus is actually the most reflective world in the Solar System!