
Host: Fraser Cain
Astrojournalists: Morgan Rehnberg, David Dickinson, Elizabeth Howell, Jason Major, Casey Dreier, Mike Simmons
Continue reading “Weekly Space Hangout – February 28, 2014: Good NASA News and 715 Confirmed Planets!”
Astrophotographer’s Dream: Venus and Milky Way Galaxy Over Singapore

“My dream to capture the beautiful Milky Way galaxy in Singapore has finally come true this morning after the monsoon season is over,” said noted astrophotographer Justin Ng, who lives in this island country in South East Asia. Justin noted that since Singapore is known for its heavy light pollution, there are many people who believe it’s impossible to capture stars and the arc of the Milky Way under those conditions. Justin has been taking amazing deep sky and night sky photos for quite some time, but he said with this particular image he’s hoping to prove the naysayers wrong.
“Plus, I hope to inspire more astrophotographers residing in heavily light polluted city to try to capture these ‘impossible’ images,” Justin added.
UPDATE: Below is a new timelapse video from Justin Ng.
This is a single exposure shot of planet Venus and Milky Way Galaxy in Singapore. However, the light pollution near the horizon is also visible.
Justin has now created a timelapse of his Milky Way photography from the same night he took this image, and he says a timelapse like this never been attempted by any photographers in Singapore, this is is the first:
Rise of Milky Way and Venus in Singapore from Justin Ng Photo on Vimeo.
You can see more of Justin’s fantastic astrophotography at his website, on G+, Facebook and Twitter.
Want to get your astrophoto featured on Universe Today? Join our Flickr group or send us your images by email (this means you’re giving us permission to post them). Please explain what’s in the picture, when you took it, the equipment you used, etc.
Did An Icy Collision Produce The Odd Shape Of Asteroid 624 Hektor?
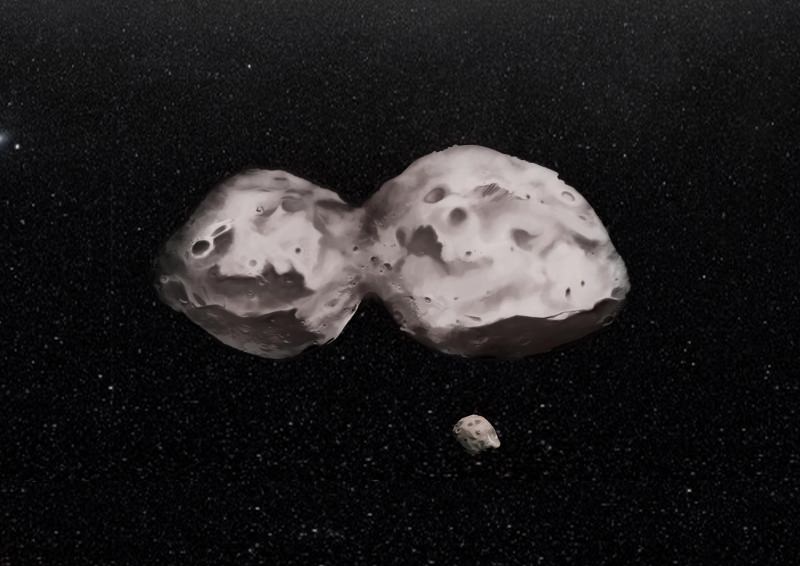
Two icy asteroids could have crashed into each other early in the solar system’s history to form the strange-looking 624 Hektor, new research reveals. The 155-mile (250-kilometer) asteroid is the largest known Trojan asteroid, or space rock that follows along with Jupiter in the gas giant’s orbital path.
Hektor also has a moon, which was first discovered in 2006 by another team led by the same lead author, the SETI Institute’s Franck Marchis. It’s taken the astronomers about eight years to get a handle on the complex orbit of the system, a topic that the new research examines in detail. That was partly because the path was so “bizarre”, the team stated, and also because time on the W.M. Keck Observatory telescopes (used to perform the observations) is limited. There are few other observatories that could do the same work, the team added.
The moon, which is about 7.5 miles or 12 kilometers in diameter, orbits its parent asteroid every three days. The moon’s path is about 373 miles (600 km) distant and inclined almost at 45 degrees to the asteroid’s equator.

“The orbit of the moon is elliptical and tilted relative to the spin of Hektor, which is very different from other asteroids with satellites seen in the main-belt,” stated Matija Cuk, a paper co-author who is a scientist at the Carl Sagan Center of the SETI Institute. “However, we did computer simulations, which include Hektor being a spinning football shape asteroid and orbiting the Sun, and we found that the moon’s orbit is stable over billions of years.”
While the artist’s conception above shows Hektor as a peanut, the exact shape is still not known for sure. The models and the adaptive optics suggest that it is likely a dual-lobe asteroid. What is better known, however, is that the asteroid is “extremely elongated” and spins in less than seven hours.
The origin of the moon is unclear, but the researchers suggested it could be because of ejecta associated with the collision that formed the asteroid. They said more simulations are needed on that point. What’s more, Hektor has another mystery associated with its composition.
“We also show that Hektor could be made of a mixture of rock and ices, similar to the composition of Kuiper belt objects, Triton and Pluto. How Hektor became a Trojan asteroid, located at only 5 times the Earth–Sun distance, is probably related to the large scale reshuffling that occurred when the giant planets were still migrating,” stated Julie Castillo-Rogez, a researcher at NASA’s Jet Propulsion Laboratory who participated in the research.
You can read more about the research in Astrophysical Journal Letters. By the way, the moon does not have a name yet, and the researchers said they are looking for any ideas as long as it fulfills a couple of ideas: “the satellite should receive a name closely related to the name of the primary and reflecting the relative sizes between these objects.” Feel free to share your suggestions in the comments.
Source: W.M. Keck Observatory
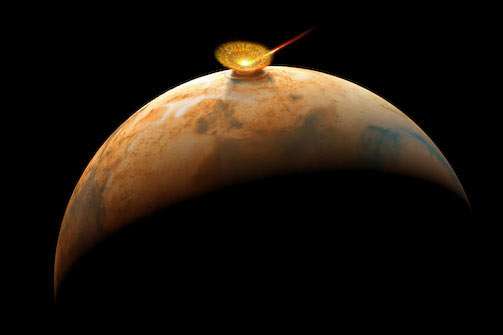
Martian Meteorite Could Have Contained Ancient Water And Life, NASA Paper Says

Could this meteorite show evidence of ancient water and life on Mars? That’s one possibility raised in a new paper led by NASA and including members of a team who made a contentious claim about Martian microfossils in another meteorite 18 years ago.
“This is no smoking gun,” stated lead author Lauren White, who is based at NASA’s Jet Propulsion Laboratory, of the findings released this week. “We can never eliminate the possibility of contamination in any meteorite. But these features are nonetheless interesting and show that further studies of these meteorites should continue.”
The new, peer-reviewed work focuses on tunnels and microtunnels the scientists said they found in a meteorite called Yamato 00593. The meteorite is about 30 pounds (13.7 kilograms) and was discovered in Antarctica in 2000. The structures were found deep within the rock, NASA stated, and “suggest biological processes might have been at work on Mars hundreds of millions of years ago.”
Scientists believe the 1.3-billion-year-old rock left Mars about 12 million years ago after an impact threw it off the surface. It reached Antarctica 50,000 years ago and after it was found in 2000, was analyzed and believed to be a “nakhlite”, or a kind of Martian meteorite. “Martian meteoritic material is distinguished from other meteorites and materials from Earth and the moon by the composition of the oxygen atoms within the silicate minerals and trapped Martian atmospheric gases,” NASA stated.
There are two things in the meteorite that caught the attention of scientists. One is the aforementioned tunnels and microtunnels, which they say are similar to those altered by bacteria in basalt on Earth. The second is tiny, carbon-enriched spherules (in the nanometer to micrometer range) between layers in the rock — structures similar to another Martian meteorite (Nakhla) that struck Egypt in 1911. In that case, the rock was recovered quickly after landing and still had the same spherules, the researchers noted.
The authors said it’s possible that these structures could be explained by other mechanisms besides life, but said the similarities to what they have found on Earth “imply the intriguing possibility that the Martian features were formed by biotic activity.”
The research team includes NASA’s David McKay (who died a year ago), Everett Gibson and Kathie Thomas-Keptra. In 1996, these same scientists (then led by McKay) found “biogenic evidence” in a meteorite called Allen Hills 84001, but other science teams have disagreed with the findings. There have been a lot of papers about this particular meteorite, and you can read more about the controversy in this 2011 Universe Today article.
Of note, since 1996 NASA and other agencies have found plenty of evidence for past water on Mars, which might throw the findings in a different light. What do you think? You can read the full paper on the new research in the journal Astrobiology.
Source: NASA
“Climate Change is Now More Certain Than Ever,” New Report Says

Climate change is one of the defining issues of our time. So begins the latest report by the U.S. National Academy of Sciences and the United Kingdom’s Royal Society. The two institutions agree: climate change is not only indisputable, it’s largely the result of human activities.
The bulk of the 36-page report is presented in a question-and-answer format, making it a good bed-side read. But in case you don’t want to have nightmares about surging temperatures or polar bears alone on breaking ice caps, we’ll leaf through the intriguing points here.
In a forward to the report, Dr. Ralph J. Cicerone, president of the National Academy of Sciences, and Sir Paul Nurse, president of the Royal Society argue that multiple lines of evidence show that humans are changing Earth’s climate. This is now more certain than ever.
They are careful to include a caveat: “The evidence is clear. However, due to the nature of science, not every single detail is ever totally settled or completely certain. Nor has every pertinent question yet been answered.” Areas of active debate include how much warming to expect in the future and the connections between climate change and extreme weather events such as the frequency and intensity of hurricanes, droughts and floods.

But the first question: is the climate warming? goes without debate. Yes. Earth’s average surface air temperature has increased by about 0.8 degrees Celsius since 1900, and the last 30 years have been the warmest in 800 years. It’s the most rapid period of sustained temperature change in the scale of global history, trumping every ice age cycle.
Recent estimates of the increase in global temperature since the end of the last ice age are four to five degrees Celsius. While this is much greater than the 0.8 degree Celsius change recorded over the last 100+ years, this change occurred over a period of about 7,000 years. So the change in rate is now 10 times faster.
Of course an increase in temperature goes hand in hand with an increase in carbon emissions. Greenhouse gases such as carbon dioxide absorb heat (infrared radiation) emitted from the Earth’s surface. Increases in the atmospheric concentrations of these gases trap most of the outgoing heat, causing the Earth to warm. Human activities, especially the burning of fossil fuels have increased carbon dioxide concentrations by 40 percent between 1880 and 2012. It is now higher than at any time in at least 800,000 years.
And if the rise in carbon emissions continues unchecked, warming of the same magnitude as the increase out of the last ice age can be expected by the end of this century.
The report continues to ask more controversial questions. Take as an example the question: Does the recent slowdown of warming mean that climate change is no longer happening? The short answer is no. Decades of slow warming and accelerated warming occur naturally in the climate system. Despite the slower rate of warming the 2000’s were still warmer than the 1990’s
The new report builds upon the long history of climate-related work from the United Nations’ Intergovernmental Panel on Climate Change. So while some have argued it doesn’t add anything new to the wealth of climate science data available, it does help make that data more succinct and available to the public. Its goal is to help inform decision makers, policy makers, educators and all other individuals.
The report concludes by noting available options to citizens and governments. They can simply wait and accept the losses, they can change their pattern of energy production, they can attempt to adapt to environmental changes as much as possible, or they can seek as yet unproven geoengineering solutions.
No matter which option we choose, one thing remains certain: the Earth is warming at a tremendous rate and we are the cause.
The paper is available for download here.
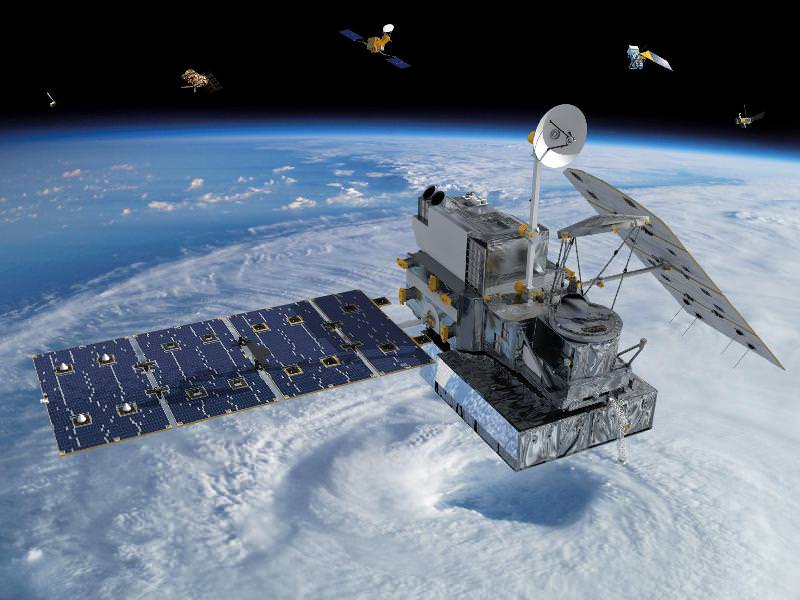
Next Generation NASA/JAXA Global Weather Research Satellite thunders aloft from Japanese Spaceport
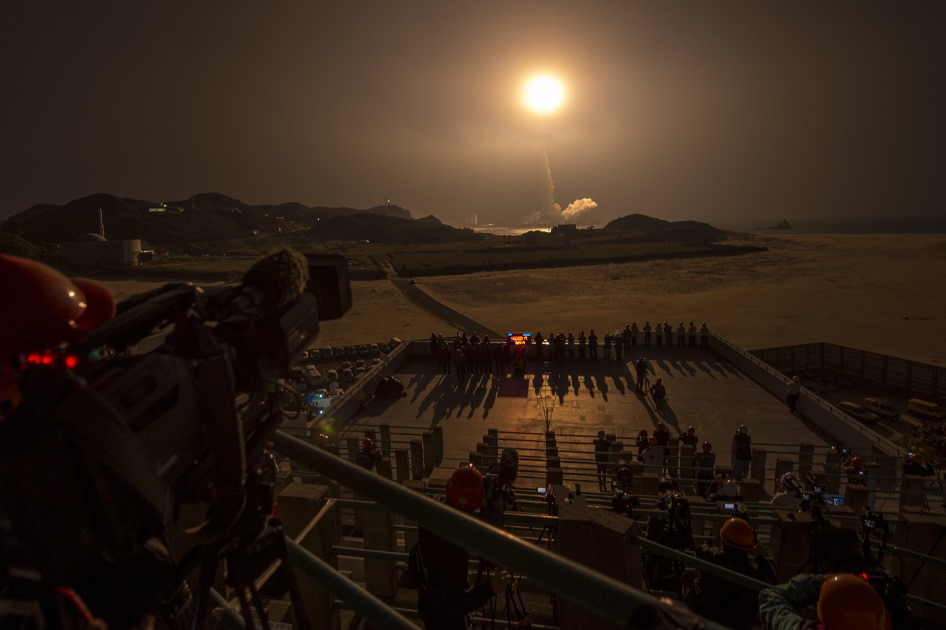
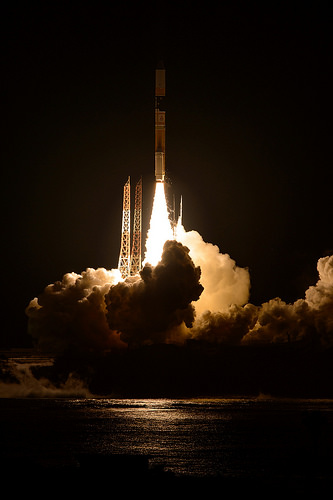
GPM Launch Seen From the Tanegashima Space Center
A Japanese H-IIA rocket with the NASA-Japan Aerospace Exploration Agency (JAXA), Global Precipitation Measurement (GPM) Core Observatory onboard, is seen launching from the Tanegashima Space Center on Friday, Feb. 28, 2014 (Japan Time), in Tanegashima, Japan; Thursday, Feb. 27, EST. Credit: NASA/Bill Ingalls[/caption]
NASA GODDARD SPACE FLIGHT CENTER, MARYLAND – A powerful, next generation weather observatory aimed at gathering unprecedented 3-D measurements of global rain and snowfall rates – and jointly developed by the US and Japan – thundered to orbit today (Feb. 27 EST, Feb. 28 JST) ) during a spectacular night time blastoff from a Japanese space port.
The Global Precipitation Measurement (GPM) Core Observatory was launched precisely on time at 1:37 p.m. EST, 1837 GMT, Thursday, Feb. 27 (3:37 a.m. JST Friday, Feb. 28) atop a Mitsubishi Heavy Industries H-IIA rocket from the Tanegashima Space Center on Tanegashima Island off southern Japan.
Viewers could watch the spectacular liftoff live on NASA TV – which was streamed here at Universe Today.
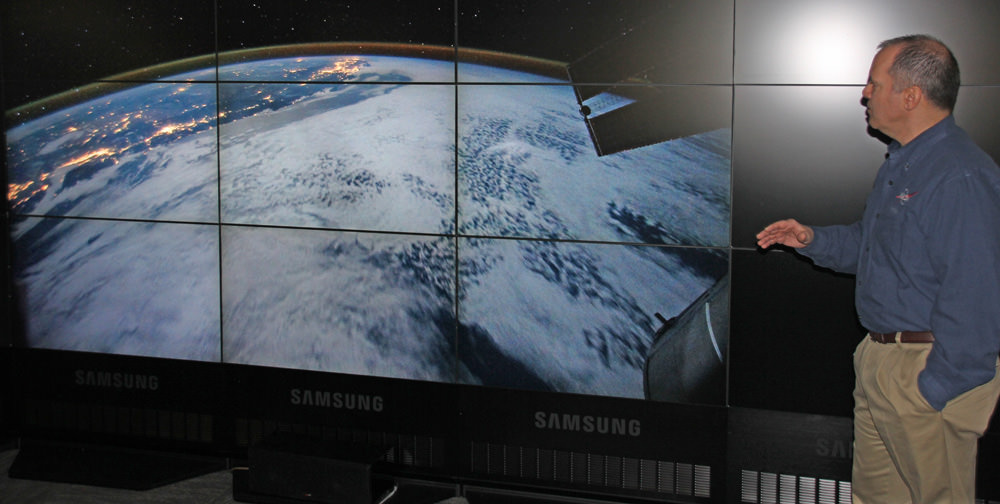
“GPM’s precipitation measurements will look like a CAT scan,” Dr. Dalia Kirschbaum, GPM research scientist, told me during a prelaunch interview with the GPM satellite in the cleanroom at NASA’s Goddard Space Flight Center in Greenbelt, Md.
“The radar can scan through clouds to create a three dimensional view of a clouds structure and evolution.”
GPM is the lead observatory of a constellation of nine highly advanced Earth orbiting weather research satellites contributed by the US, Japan, Europe and India.
Indeed GPM will be the first satellite to measure light rainfall and snow, in addition to heavy tropical rainfall.
It will collect a treasure trove of data enabling the most comprehensive measurements ever of global precipitation every three hours – and across a wide swath of the planet where virtually all of humanity lives from 65 N to 65 S latitudes.
GPM orbits at an altitude of 253 miles (407 kilometers) above Earth – quite similar to the International Space Station (ISS).
The global precipitation data will be made freely available to climate researchers and weather forecasters worldwide in near real time – something long awaited and not possible until now.
Water and the associated water and energy cycles are the basis of all life on Earth.
Yet scientists lack a clear and comprehensive understanding of key rain and snow fall amounts on most of the globe – which is at the heart of humanity’s existence and future well being on the home planet.
Having an accurate catalog of the water and energy cycles will direct benefit society and impact people’s lives on a daily basis with improved weather forecasts, more advanced warnings of extreme weather conditions, aid farmers, help identify and determine the effects of global climate change.
Researchers will use the GPM measurements to study climate change, freshwater resources, floods and droughts, and hurricane formation and tracking.
“With this launch, we have taken another giant leap in providing the world with an unprecedented picture of our planet’s rain and snow,” said NASA Administrator Charles Bolden, in a NASA statement.
 “GPM will help us better understand our ever-changing climate, improve forecasts of extreme weather events like floods, and assist decision makers around the world to better manage water resources.”
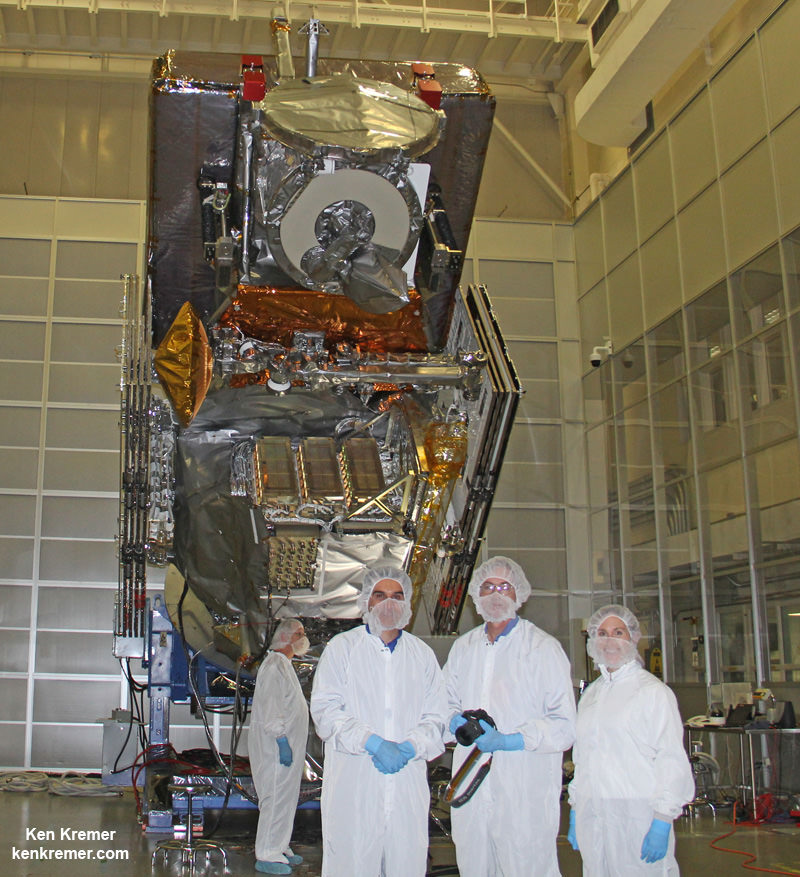
“The GPM spacecraft has been under development for a dozen years,” said GPM Project Manager Art Azarbarzin of NASA’s Goddard Space Flight Center in Greenbelt, Md., in a prelaunch interview with Universe Today conducted inside the clean room with GPM before it’s shipment to Japan.
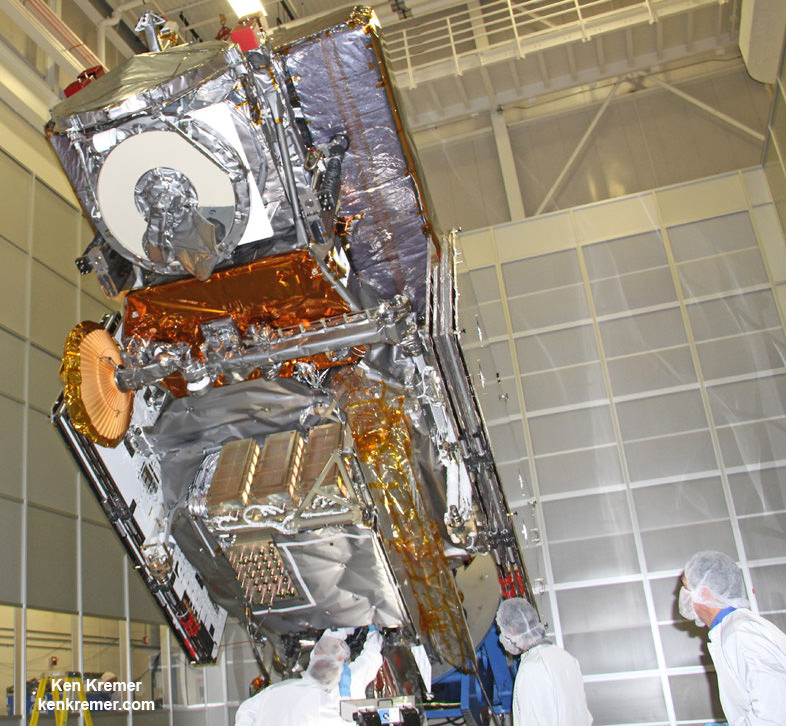
“The GPM satellite was built in house by the dedicated team at NASA’s Goddard Space Flight Center in Maryland,” Azarbarzin told me.
“It’s the largest satellite ever built at Goddard.”
Following the flawless blastoff, the nearly four ton GPM spacecraft separated from the Japanese rocket some 16 minutes later at an altitude of 247 miles (398 kilometers).
10 minutes later both of the spacecrafts life giving solar arrays deployed as planned.
“It is incredibly exciting to see this spacecraft launch,” said Azarbarzin, in a NASA statement. He witnessed the launch in Japan.
“This is the moment that the GPM Team has been working toward since 2006.”
“The GPM Core Observatory is the product of a dedicated team at Goddard, JAXA and others worldwide.”
“Soon, as GPM begins to collect precipitation observations, we’ll see these instruments at work providing real-time information for the scientists about the intensification of storms, rainfall in remote areas and so much more.”
The $933 Million observatory is a joint venture between the US and Japanese space agencies, NASA and the Japan Aerospace Exploration Agency (JAXA).
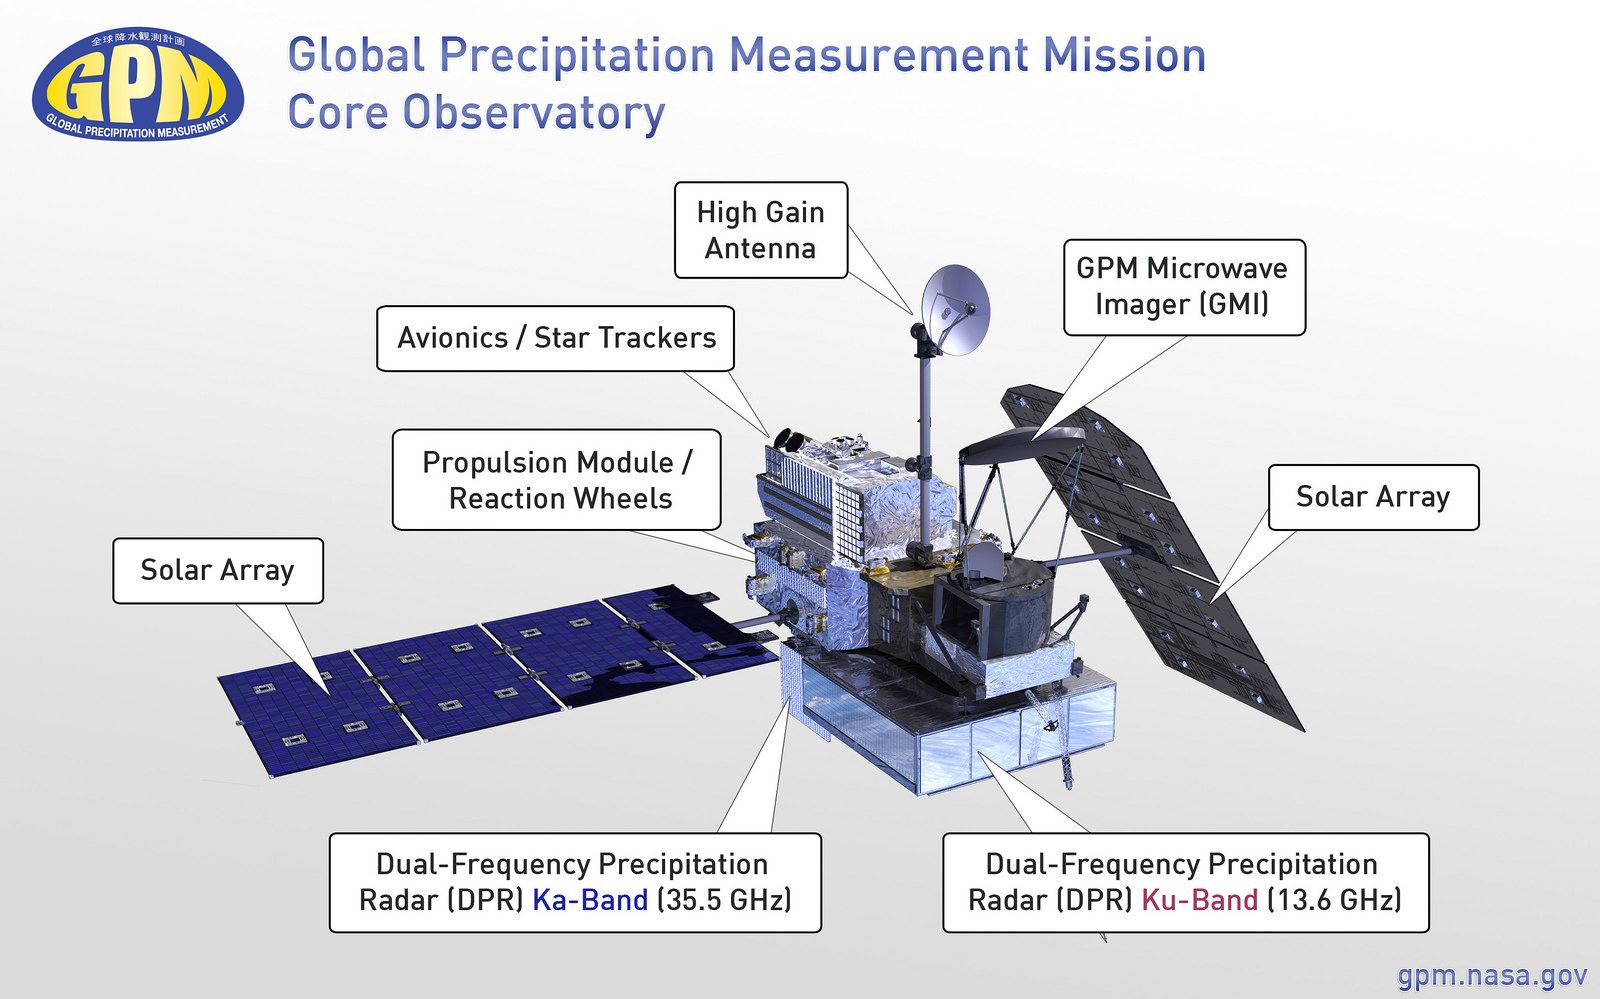
The 3850 kilogram GPM satellite is equipped with two instruments – an advanced, higher resolution dual -frequency precipitation (DPR) radar instrument (Ku and Ka band) built by JAXA in Japan and the GPM microwave imager (GMI) built by Ball Aerospace in the US.
The GPM observatory will replace the aging NASA/JAXA Tropical Rainfall Measuring Mission (TRMM) satellite launched back in 1997 and also jointly developed by NASA and JAXA.
“GPM is the direct follow-up to the currently orbiting TRMM satellite,” Azarbarzin explained to me.
“TRMM is reaching the end of its usable lifetime. After GPM launches we hope it has some overlap with observations from TRMM.”
GPM is vital to continuing the TRMM measurements. It will help provide improved forecasts and advance warning of extreme super storms like Hurricane Sandy and Super Typhoon Haiyan.
“TRMM was only designed to last three years but is still operating today. We hope GPM has a similar long life,” said Azarbarzin.
Stay tuned here for Ken’s continuing GPM reports and on-site coverage at NASA Goddard Space Flight Center in Maryland.
And watch for Ken’s continuing planetary and human spaceflight news about Curiosity, Opportunity, Chang’e-3, SpaceX, Orbital Sciences, LADEE, MAVEN, MOM, Mars, Orion and more.
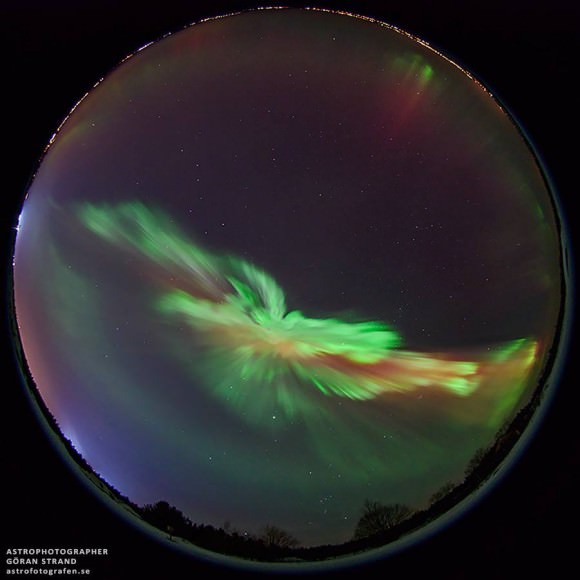
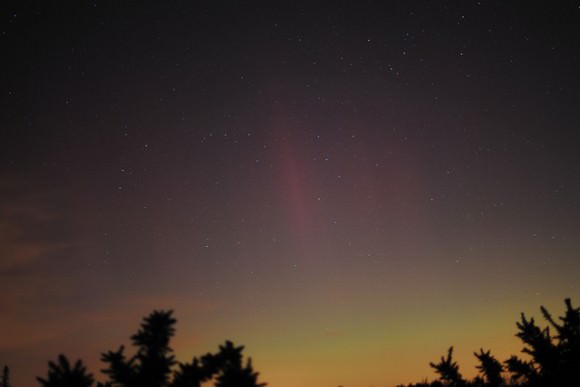
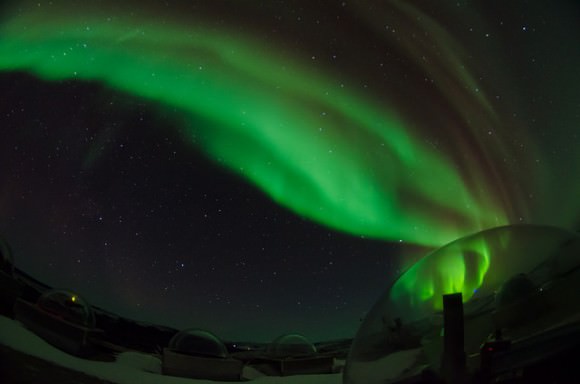
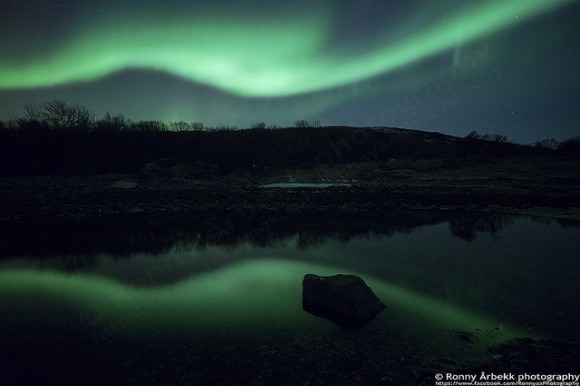
Incredible Aurora Outburst From Recent X-Class Flare

Our Twitter feeds just exploded with pictures of an auroral outburst in the UK, Scandinavia, Iceland and even from the International Space Station! Thanks to the X4.9 class solar flare on on Feb. 25, the resulting CME hit Earth’s magnetic field today and triggered geomagnetic storms. Take a look at some of the images pouring in, featuring dancing curtains of reds, greens, purples and pinks:

Southern lights were absolutely stunning tonight! pic.twitter.com/y20Rkkc2uv
— Mike Hopkins (@AstroIllini) February 27, 2014

This timelapse shows the aurora display over Swordale, Isle of Lewis, Scotland on Feb. 27, 2014:
Here are a few notable tweets:
Wow aurora from your bedroom window in North Wales #bucketlist pic.twitter.com/H1MXZ90VqZ
— Pete Wood (@PeteWood1981) February 27, 2014
I cried tonight… #aurora #orkney @VirtualAstro #merriedancers pic.twitter.com/VJDkOF75ck
— Alison Moore (@AlisonMooreDesi) February 27, 2014
Lost for words. An hour and a half spent looking up at the most incredible aurora display I have ever seen.
— Nick Bramhall (@nickbramhll) February 27, 2014
“@Jordan_Crosby: Got treated to an awesome display of #AuroraBorealis tonight in Seaham." @VirtualAstro pic.twitter.com/gML6Bj5LDO
— Jordan Crosby (@Jordan_Crosby) February 27, 2014
Here are more images that came in overnight:

To see more images, take a look at the Twitter feed of @VirtualAstro, or see the aurora gallery at SpaceWeather.com.
Want to get your astrophoto featured on Universe Today? Join our Flickr group or send us your images by email (this means you’re giving us permission to post them). Please explain what’s in the picture, when you took it, the equipment you used, etc.
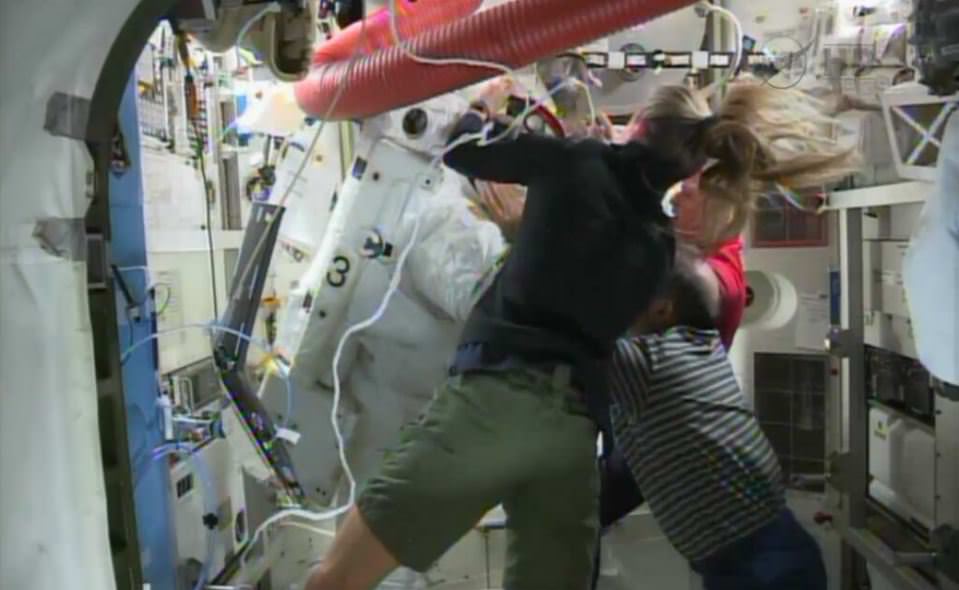
NASA Sparked Fire Risk While Drying Sodden Spacesuit On Station, Report Says
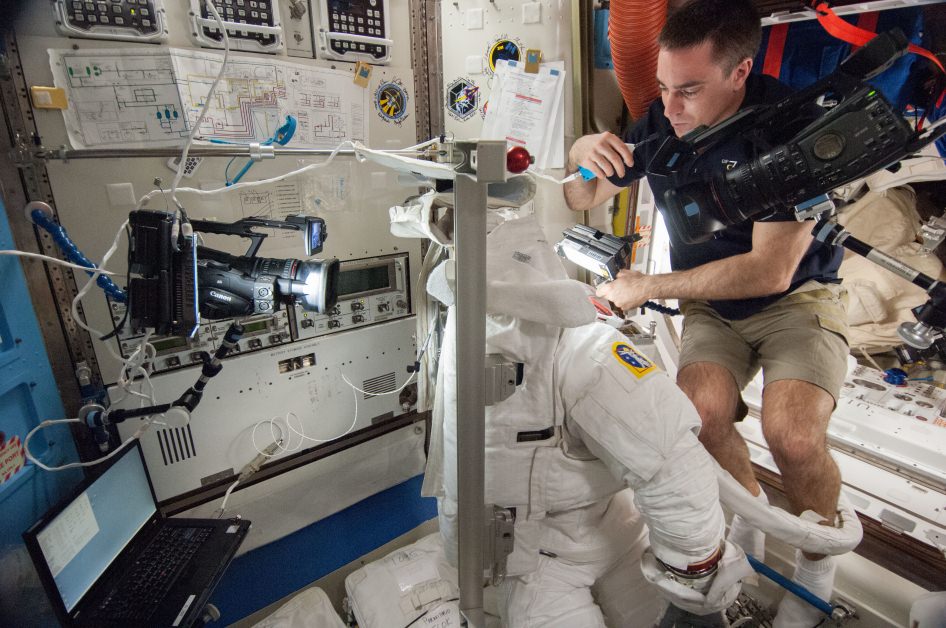
Astronauts on the International Space Station “could have ignited flammable materials” on station while drying out a spacesuit that experienced a major leak during a spacewalk in July 2013, a new report reveals.
NASA Mission Control directed the Expedition 36 crew to use a vacuum cleaner to suction out the water, a procedure that inadvertently sucked up oxygen from the suit’s secondary high pressure oxygen tank, says a mishap report into the spacesuit leak incident. This “potentially hazardous risk” of electricity and pure oxygen created a fire hazard, the report added.
In a phone call with reporters yesterday (Feb. 27), report chair Chris Hansen added that the “levels of oxygen were perfectly safe” in this particular incident and that the “the risk to the crew in the end was none”, but said the incident still warranted attention in the 222-page report, which mainly deals with the spacesuit leak.
The incident occurred on July 17, 2013, one day after a “life-threatening” amount of water leaked into a spacesuit helmet used by Luca Parmitano, the report said. The astronauts and NASA were doing looking for the source of the leak. Astronauts reported no damage to the water bag and no water in the suit (which had been cleaned up after the spacewalk).
Next, they turned on the fan to the portable life support system (or backpack) with a secondary oxygen pack (SOP) check-out fixture. The fixture covered a vent port and oxygen switch for about 14 minutes. All appeared to be running normally, with no water detected. When the crew then removed the fixture (following procedure), they heard a “sucking” noise and the fan ceased moving, the report said.
“The crew was directed to turn off the suit fan and move the O2 Actuator to OFF. The crew then turned the suit fan back ON and again set the O2 Actuator to [the] IV [setting]. The fan briefly began spinning and then shut down almost immediately, with the crew reporting a water “sucking” or “gurgling” sound,” the report added.
The crew found “a few drops” of water in a canister outlet and “about a spoonful” of water in the suit inlet ports, as well as a few drops of water in a neck vent port. As the ground decided what to do, an infrared carbon-dioxide transducer in the suit “began to show an increase in its reading and eventually went off-scale high, most likely due to moisture in the vent loop near the CO2 [carbon dioxide] transducer,” the report stated.

With water in the suit, Mission Control then asked the crew to remove the water with a vacuum (one that is designed for wet or dry cleanup) as soon as the astronauts had the chance. Everything was normal until after the station emerged from a routine loss of signal, at which point controllers saw the secondary oxygen pack was turned on and reading 500 pounds per square inch lower than before the loss of communication.
“They quickly realized that their procedure had resulted in the EMU releasing 100% oxygen from the SOP into the vent loop, which was then sucked into the vacuum cleaner. This was a potentially dangerous situation involving unintended consequences,” the report said.
“During interviews, system experts indicated that they should have been able to anticipate SOP activation due to the reduced pressure created by the vacuum cleaner. The procedure was immediately stopped. No fire occurred and the crew was not harmed.”
In interviews after the incident, individuals spoke of “perceived pressure” to do the dry-out procedure quickly instead of first testing it on the ground with similar hardware. They instead used a non-functional spacesuit before directing the crew to do the procedure.
There were at least three factors contributing to that pressure, the report added: the desire to avoid corrosion in the suit, limited crew time, and the impending loss of signal.
The report did not identify any “additional causes, findings, or observations” from this event, noting that it is not technically an anomaly and was not classified as such in the NASA literature.
You can read the full report here. As for the spacewalk mishap investigation, some of the major findings showed it took 23 minutes to order Parmitano back to the airlock, and that water was seen as a normal thing in spacesuit helmets.
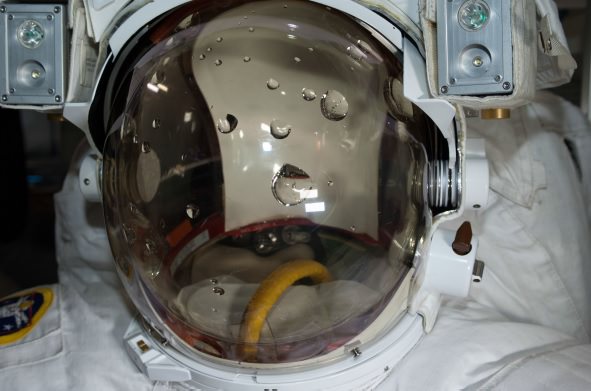
As Astronaut’s Helmet Filled With Water, He Told NASA 3 Times It Wasn’t From Drinking Bag

While NASA’s Mission Control “performed admirably” during a spacewalk water leak crisis in July, a report on the incident showed that controllers did not send astronaut Luca Parmitano back to the airlock until after he made three calls saying the water didn’t appear to be from a drinking bag.
There are several reasons this happened, the mishap report says, such as inadequate training, the crew members and ground misunderstanding the severity of the situation, and a (false) perception that any water leak is likely due to a problem with the drinking bag.
Another big problem was the “normalization of deviance”, similar language to what was used during in reports describing the Challenger and Columbia incidents. In this case, small amounts of water in the helmet was expected, and controllers also misunderstood the cause of a carbon dioxide alarm (a fairly regular occurrence during spacewalks).
The report pulls no punches when it describes how bad things were: “The presence of this water created a condition that was life threatening.”
While talking about what is in the report, it’s also important to point out what the investigators did not find. There was no evidence that contractors were afraid to bring up problems (such as what happened during the 1986 Challenger explosion), chair Chris Hanson told reporters yesterday. Also, while the suits are 35 years old, no aging problem was detected.
Another couple of cautions: the report is preliminary (the exact cause of the leak is under investigation), it’s lengthy (222 pages) and much of the technical information is unavailable to the public due to export control restrictions. Any news story will just scratch the surface of what happened and the recommendations to fix it.
That said, here are a few key points we found in the report.

Parmitano warned controllers multiple times. The transcript shows three separate calls from Parmitano saying it wasn’t the drinking bag at cause: (1) “I feel a lot of water on the back of my head, but I don’t think it is from my bag.” (2) “The leak is not from the water bag and it is increasing.” (3) “I’m thinking that it might not be the water bag.” (In between 1 and 2, he also sent another call saying his “only guess” was it was the drinking bag, but the report adds that Parmitano may have softened his stance after speaking to controllers). Misunderstanding about the severity, lack of training, “cognitive overload” of controllers, and space-to-ground-to-space communication difficulties are all cited as contributing factors.
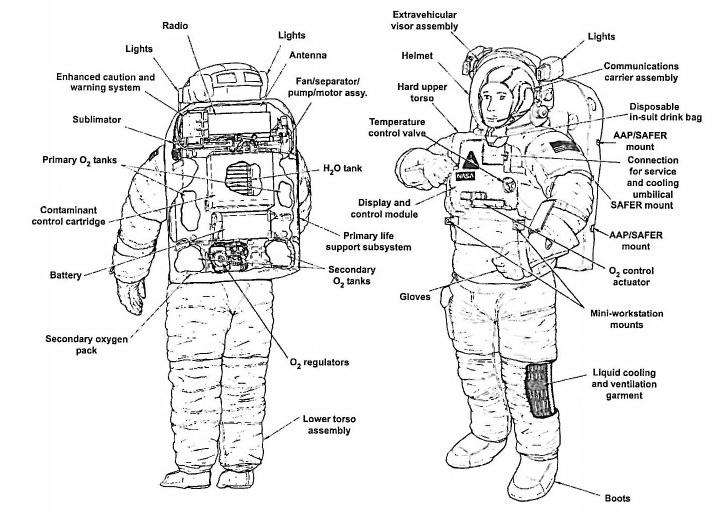
Drink bags don’t actually leak as much as people think they did. Unequivocally, the mishap investigation board says “the perception that drink bags leak, especially as a frequent occurrence, is false.” There has never been an instance of a bag leaking substantially during a spacewalk, the report says. After the crisis passed and investigators had the luxury of time, they in fact identified seven separate possible sources of water: (1) the bag; (2) the waste collection garment; (3) cooling water from the sublimator heat rejection component of the suit; (4) the Liquid Cooling Ventilation Garment connector or the tubing itself; (5) transfer lines through the Hard Upper Torso; (6) water storage tankage through the pressurizing bladders; (7) the water separator circuit (which is where the problem was eventually found).
It was a risky decision to send Parmitano back alone. Twenty-three minutes after Parmitano warned of water in his helmet, NASA terminated the spacewalk and as per procedure, had the astronaut head to the airlock while crewmate Chris Cassidy performed cleanup tasks before doing the same. (“Terminate” has a specific meaning as opposed to “abort”, which means both crew members leave immediately.) By this time, water was in Parmitano’s eyes and the station had passed into the shadow of the Earth, forcing him to feel his way back to the airlock along the tether. (This was only his second spacewalk on station, too.) Also, the water affected his communications equipment, as he made several calls “in the blind” that were not heard. At this time, Cassidy and the ground controllers did not know how severe the situation was. “Additional risk exposure that the team could have considered was the aspiration of water, failure of comm equipment, and impaired visibility,” the report said.

The emphasis on science on station can hinder with maintenance tasks. NASA and other space station partners are eager to demonstrate how great the station is to science, but crew time is divided between that and doing maintenance tasks. “Due to this knowledge, team members felt that requesting on-orbit time for anything non-science related was likely to be denied and therefore tended to assume their next course of action could not include on-orbit time,” the report states. To give a specific example of how this affected Parmitano’s suit: After water was found in the suit during a previous spacewalk, the crew and ground essentially determined it was due to the drink bag and did not probe further, partly because of the perception that doing an investigation would take an inordinate amount of time for little return (as they believed they knew the cause). On a related note, there was also the concern that investigating this occurrence (which happened on July 9) would delay the July 16 spacewalk. (Again, this sounds a bit like Challenger, where time pressure was cited as a reason to launch despite icy conditions.)
More needs to be done to understand the physics of water in a spacesuit. A few examples: it was believed the fan would have failed if water got through the separator unit, which did not occur. It was also believed that any water in the helmet would cling to the helmet, and not the crew member’s face. Not only that, the training for crew and ground was inadequate to seek out water causes on the fly. “Had this been done, the crew and ground team may not have attributed water in the helmet to just the drink bag,” the report stated.
Water in the helmet was normalized. If you’ve read Chris Hadfield’s An Astronaut’s Guide to Life On Earth, there’s an account in there about how Hadfield (who also was a junior spacewalker in 2001) became temporarily blind due to an anti-fog agent on the helmet getting into his eyes. This has happened during other spacewalks, too, which meant that the ground team was used to small amounts of water in the helmet — even though this wasn’t a normal condition. Another aspect: a carbon dioxide alarm went off in Parmitano’s suit after it became saturated with water. This happened six minutes before he felt the dampness. The team attributed this to “nominal accumulation of moisture in the vent loop,” which can happen at the end of the spacewalk. Having it happen less than an hour in, however, did not trigger a fault-finding process.
While there are many, many causes in the report (with aspects ranging from the technical to the procedural to the training), members identified three main ones to the incident: (1) inorganic materials in the water separator drum holes, for reasons still unknown (2) a lack of understanding that meant the team’s response took longer than usual (3) a misdiagnosis of the water found during the July 9, 2013 spacewalk.
There are 49 separate recommendations ranging from “Level 1” priority to “Level 3”, which are still important but less urgent. NASA has pledged it will clear all “Level 1” and “Level 2” items before doing any normal spacewalks, although contingency ones are still possible. They expect this to be finished by June, but say they will take as long as needed to get the investigation done. There are no pressing spacewalk tasks on station right now.
Looking to the long run, the report noted that there should be more backups available if a fault is found in the spacesuits, as NASA is relying on these devices to perform essential station maintenance as far as 2028. Also, the investigators say that the six-year certification of these suits for orbital tasks is likely inadequate, and calls for a review of that. So although aging was not identified as an issue, maintenance and backups of the spacesuits could be key features of NASA thinking in the months and years to come.
Nearby Stream of Stars Reveals Past Cosmic Collision
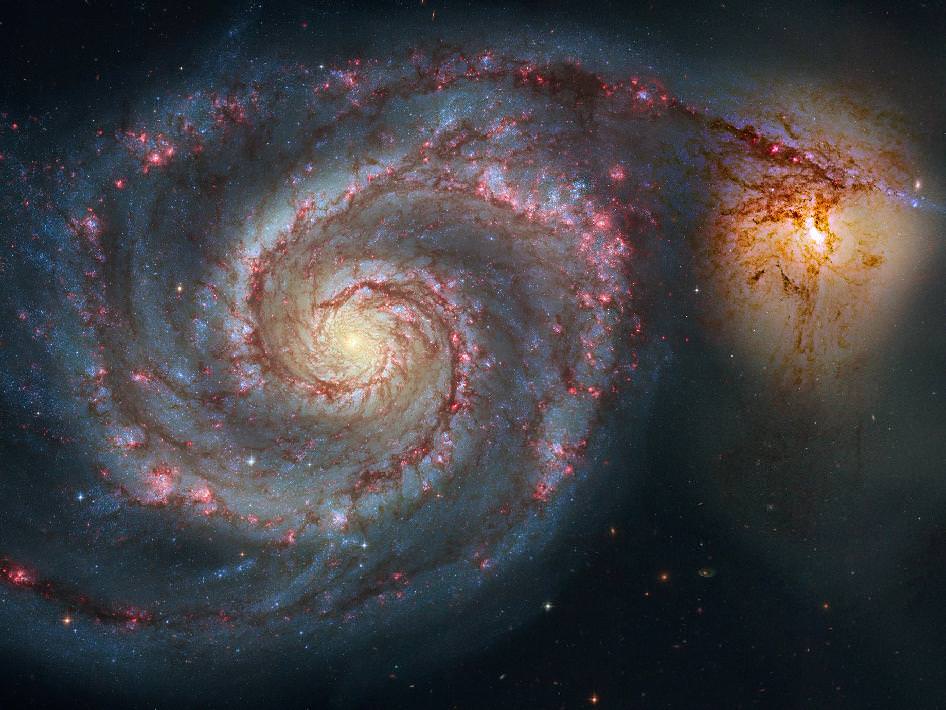
The tangled remains of vast cosmic collisions can be seen across the universe, such as the distant Whirlpool Galaxy’s past close encounter with a nearby galaxy, which resulted in the staggering beauty we see today.
Such colossal collisions between galaxies appear to be common. It’s likely giant galaxies, such as our own, originated long ago after smaller dwarf galaxies crashed together. Unfortunately, Hubble has yet to peer into the early Universe and catch two dwarf galaxies merging by chance. And they’re extremely rare to catch in the present nearby universe.
But for the first time, astronomers have uncovered evidence of a similar collision much closer to home.
The Milky Way is part of a large cosmic neighborhood. A collection of more than 35 galaxies compose the Local Group. While the largest and heavier members are the Milky Way and the Andromeda galaxy, there are many smaller satellite galaxies orbiting the two. Anyone who has looked at the southern sky should be familiar with the Large and Small Magellanic Clouds: two satellite galaxies of the Milky Way less than 200,000 light years away.
Andromeda has over 20 satellite galaxies circling its nearly a trillion stars. A team of European astronomers has analyzed measurements of the stars in the dwarf galaxy Andromeda II — the second largest dwarf galaxy in the Local Group — and made a surprising discovery: an odd stream of stars that simply doesn’t belong.
The team led by Dr. Nicola C. Amorisco from the Dark Cosmology Centre at the Niels Bohr Institute in Copenhagen used the Deep Imaging Multi-Object (DEIMOS) spectrograph onboard the Keck II telescope in Hawaii in order to measure the velocities of more than 700 stars in the Andromeda II dwarf galaxy.
Stars in a large spiral galaxy will move, on average, with the rotation of the galaxy. On one side of the galaxy’s spinning disk, the stars will be moving away from the Earth, and their light waves will be stretched to redder wavelengths. On the opposite side, the stars will be moving toward the Earth, and their light waves will be compressed to bluer wavelengths.
But the stars in dwarf galaxies don’t exhibit such a pattern. Instead they move around entirely at random.
Amorisco and colleagues, however, found a rather different case present in Andromeda II. They observed a stream of stars — roughly 16,000 light years in length and 980 light years in thickness — that didn’t exhibit random motions at all. They orbit the center of the galaxy in a very coherent fashion.
But it gets better: the stars in this stream are also much colder than the stars outside the stream. In astronomy this is the equivalent of saying that the stars in this stream are much older. Amorisco’s team now believes they once belonged to a different galaxy entirely and remain only as a remnant of the past collision, which likely occurred over 3 billion years ago.
Streams of stars often result from collisions. As two galaxies begin to interact, the stars nearest the approaching galaxy feel a much stronger gravitational pull than the stars further away. Eventually the gravitational pull on the closer side of the galaxy will pull the stars from their initial galaxy, creating a stream of stars, dust and gas.
This is the smallest known example of two galaxies merging. The finding adds further evidence that mergers between dwarf galaxies plays a fundamental role in creating the large and beautiful galaxies we see today.
The paper has been published in Nature and is available for download here.