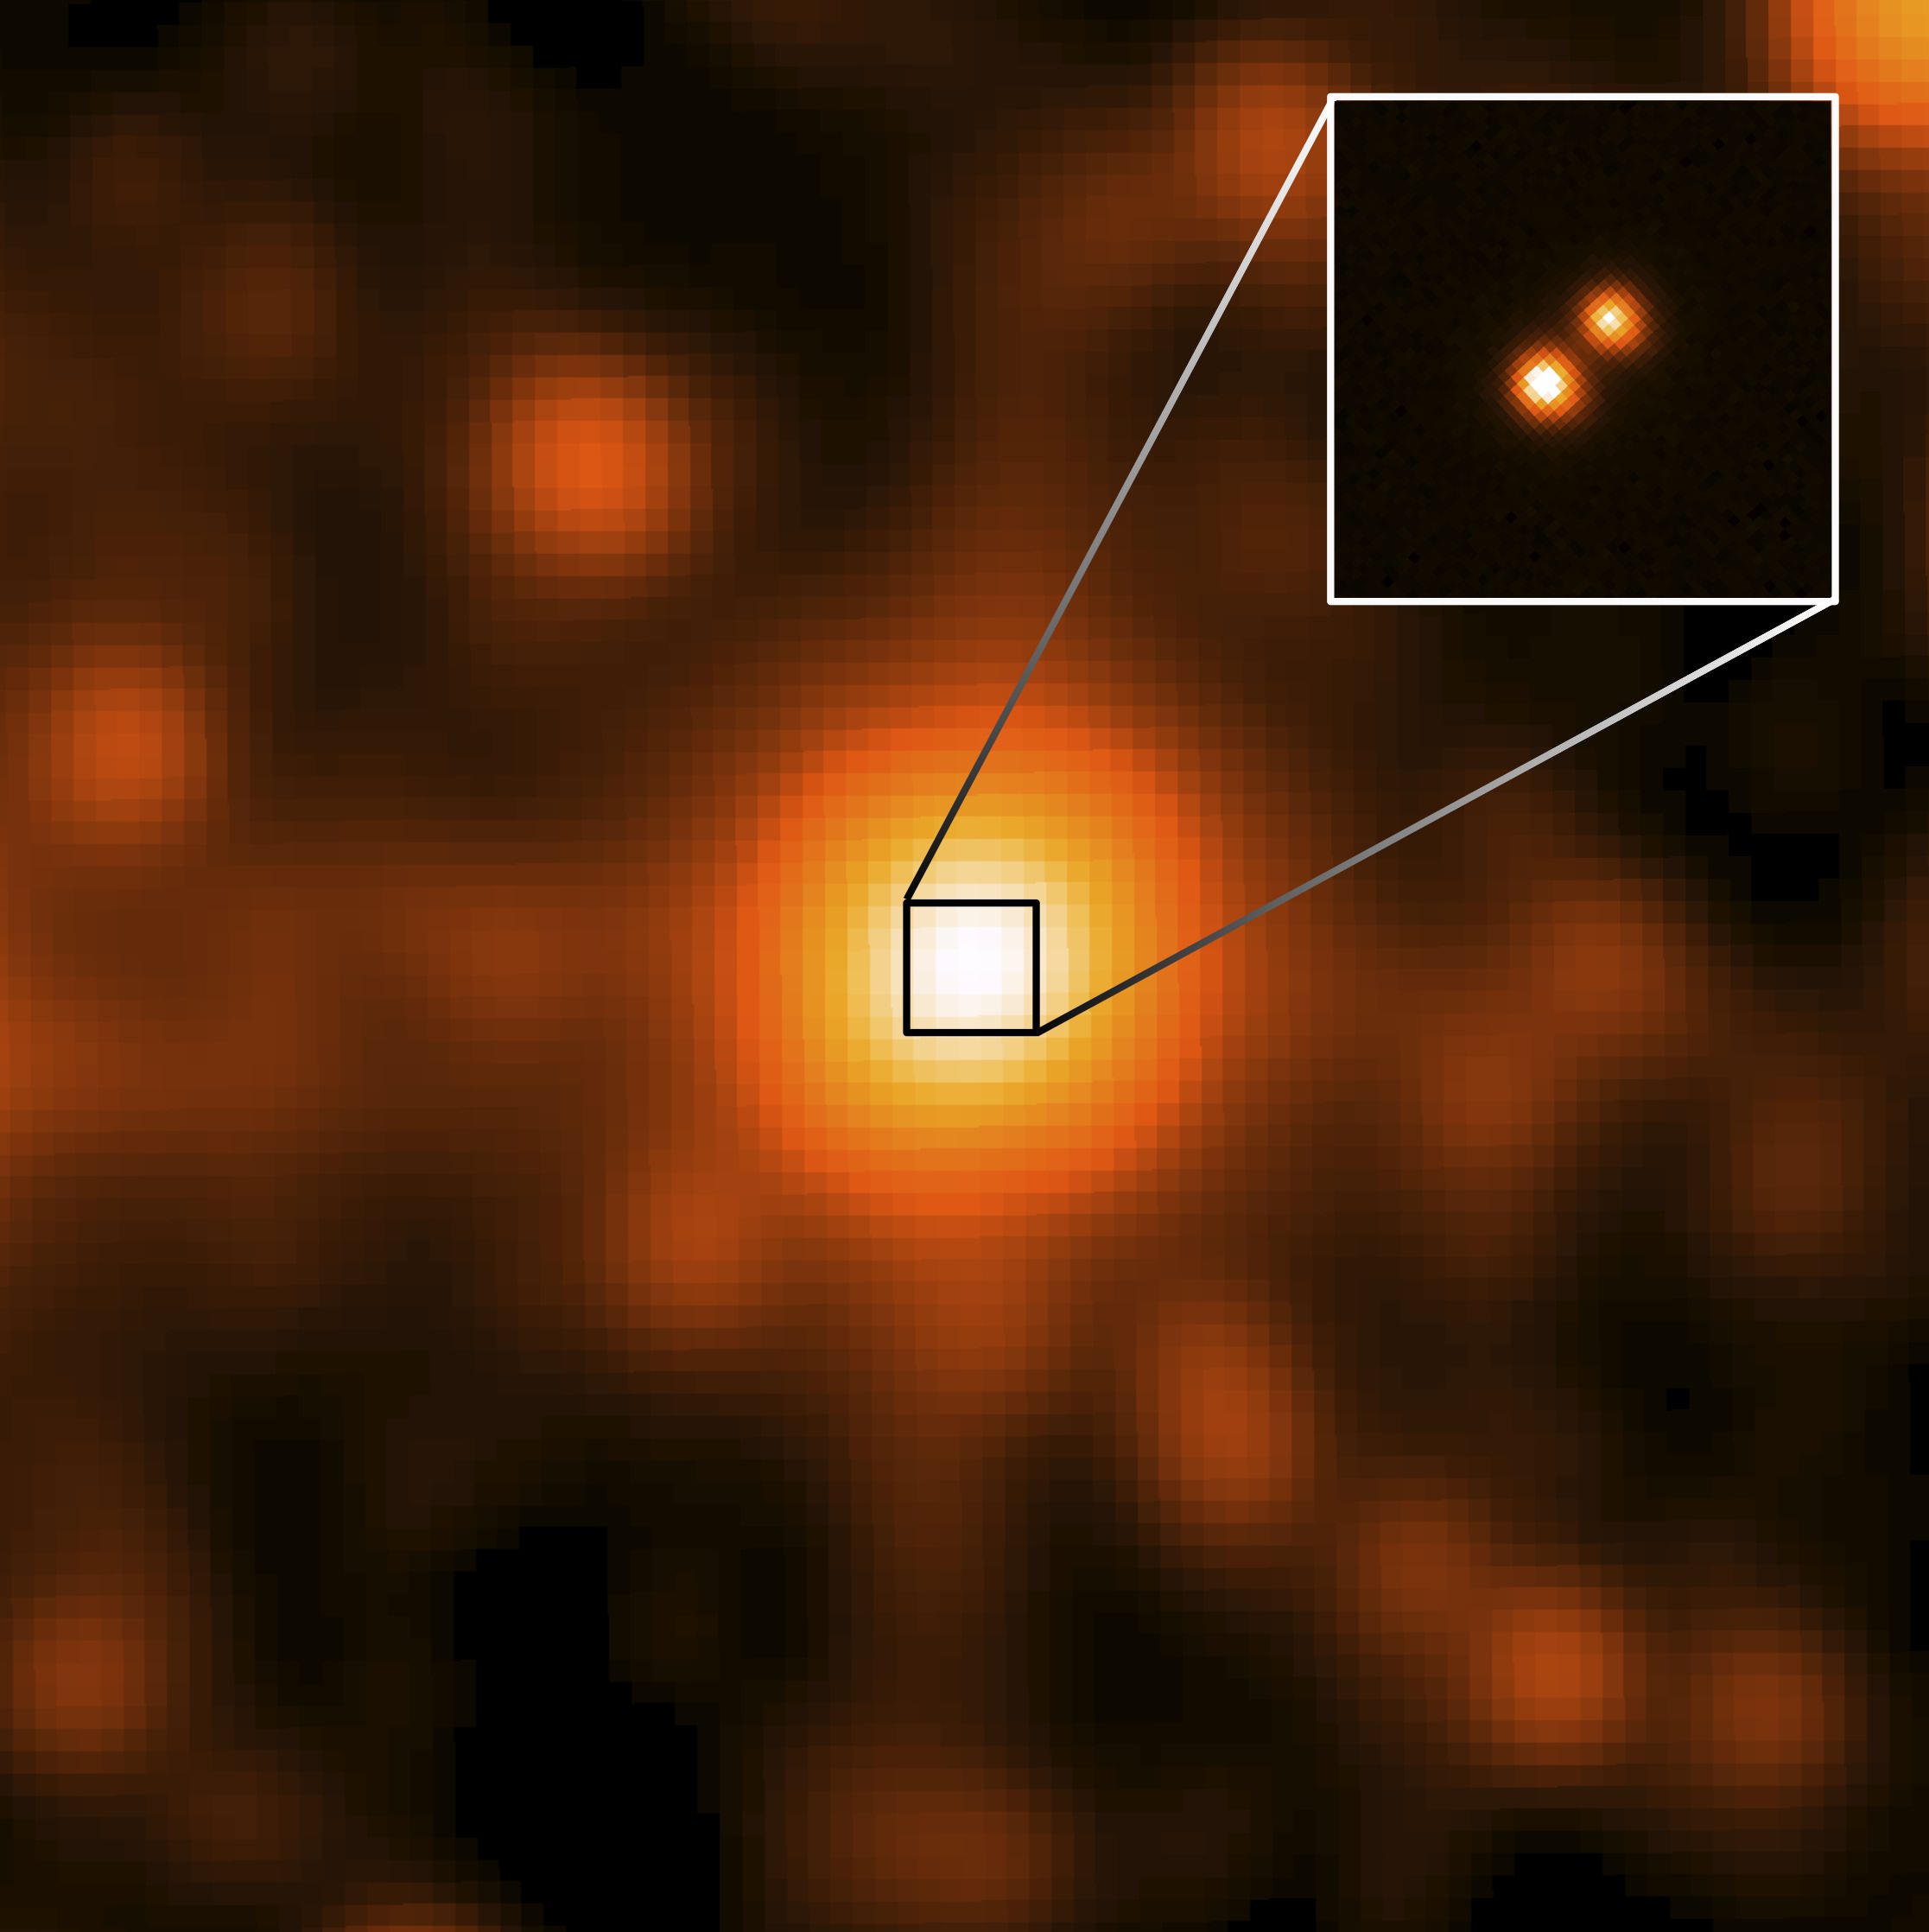
WISE J104915.57-531906 as seen in NASA’s All-WISE survey (centered) and resolved to show its binary nature by the Gemini Observatory (inset). (Credit: NASA/JPL/Gemini Observatory/AURA/NSF).
In 2012 astronomers announced the discovery of an Earth-like planet circling our nearest neighbor, Alpha Centauri B, a mere 4.3 light-years away. But with such a discovery comes heated debate. A second group of astronomers was unable to confirm the exoplanet’s presence, keeping the argument unresolved to date.
But not to worry. One need only look 2.3 light-years further to see tantalizing — although yet unconfirmed — evidence of an exoplanet circling a pair of brown dwarfs: objects that aren’t massive enough to kick-off nuclear fusion in their cores. There just may be an exoplanet in the third closest system to our Sun.
Astronomers only discovered the system last year when the brown dwarfs were spotted in data from NASA’s Wide-field Infrared Explorer (WISE). Check out a past Universe Today article on the discovery here. They escaped detection for so long because they are located in the galactic plane, an area densely populated by stars, which are far brighter than the brown dwarfs.
Henri Boffin at the European Southern Observatory led a team of astronomers on a mission to learn more about these newly found dim neighbors. The group used ESO’s Very Large Telescope (VLT) at Paranal in Chile to perform astrometry, a technique used to measure the position of the objects precisely. This crucial data would allow them to make a better estimate of the distance to the objects as well as their orbital period.
Boffin’s team was first able to constrain their masses, finding that one brown dwarf weighs in at 30 times the mass of Jupiter and the other weighs in at 50 times the mass of Jupiter. These light-weight objects orbit each other slowly, taking about 20 years.
But their orbits didn’t map out perfectly — there were slight disturbances, suggesting that something was tugging on these two brown dwarfs. The likely culprit? An exoplanet — at three times the weight of Jupiter — orbiting one or even both of the objects.
“The fact that we potentially found a planetary-mass companion around such a very nearby and binary system was a surprise,” Boffin told Universe Today.
The next step will be to monitor the system closely in order to verify the existence of a planetary-mass companion. With a full year’s worth of data it will be relatively straightforward to remove the signal caused by the exoplanet.
So far only eight exoplanets have been discovered around brown dwarfs. If confirmed, this planet will be the first to be discovered using astrometry.
“Once the companion is confirmed, this will be an ideal target to image using the upcoming SPHERE instrument on the VLT,” Boffin said. This instrument will allow astronomers to directly image planets close to their host star — a difficult technique worth the challenge as it reveals a wealth of information about the planet.
Once confirmed, this planet will stand as the closest exoplanet to the Sun, until the debate regarding Alpha Centauri Bb is resolved.
The paper has been accepted for publication as an Astronomy & Astrophysics Letter and is available for download here. For more information on Alpha Centauri Bb please read a paper available here and published in the Astrophysical Journal.
Dark matter in the Bullet Cluster. Otherwise invisible to telescopic views, the dark matter was mapped by observations of gravitational lensing of background galaxies. Credit: X-ray: NASA/CXC/CfA/ M.Markevitch et al.; Lensing Map: NASA/STScI; ESO WFI; Magellan/U.Arizona/ D.Clowe et al. Optical: NASA/STScI; Magellan/U.Arizona/D.Clowe et al.;
Roughly eighty percent of all the mass in the Universe is made of dark matter – a mysterious invisible substance responsible for the structure of galaxies and the patterns of the cosmos on the very largest scales. But how do we know that?
Astronomical images are beautiful, but that’s not their primary purpose from a scientist’s point of view. How can we take those images and infer things about what they are?
We only know of one planet harboring life: Earth. But that doesn’t mean we don’t know anything about the possibility of life elsewhere in the cosmos. How can we infer things about possible alien organisms when we can’t see them (yet)?
These classes are short, four-hour courses designed for curious but busy people. All CosmoAcademy classes are offered online through Google+ Hangouts, a type of video chat. Part of the reason we do that is to limit the size of courses to eight students. That allows us to provide individual instruction in a way no other kind of online class is able to do – you aren’t a faceless student, but part of every discussion. In fact, if there’s a topic you want to discuss, there’s a good chance your instructor will take the time to talk about it.
Roughly eighty percent of all the mass in the Universe is made of dark matter – a mysterious invisible substance responsible for the structure of galaxies. But how do we know that? In this course, we’ll examine the evidence in favor of dark matter’s existence, from the rotation of galaxies to the radiation left over from the infancy of the cosmos. After that, we’ll examine what we can infer about the identity of dark matter and sketch out some of the experiments designed to detect it. This class assumes no background except a strong interest in astronomy and cosmology.
Instructor:Matthew Francis Course structure: Two weeks, four 60-minute meetings Meeting times: Tuesdays and Thursdays, 9–10 PM US Eastern time (6-7 PM US Pacific time) Coursedates: January 28—February 6, 2014
When astronomers look at a star, nebula or galaxy for the first time, they see some unreachably distant object acting in some unknown way. What does it have to be made of and how does it have to be acting to look like that? In this class we will be looking at how we use the visual appearance of astronomical objects to figure out what they are. We will examine this problem by making our own color images from the sources provided by observatories from real research projects. From the subtle hues of stars in a distant galaxy to the eerie neon colors of nebulae to the chaotic Sun, by looking at objects in the right light, we can find out what makes them tick.
Instructor: Peter Dove Course structure: Two weeks, four 60-minute meetings Meeting times: Tuesdays and Thursdays, 8–9 PM US Eastern time (5-6 PM US Pacific time) Course dates: Tuesday, February 25—Thursday, March 6
What will it take to find extraterrestrial life? Frank Drake penned his famous “equation” to determine the instances of life in the Galaxy over 50 years ago. Meant more as a discussion guideline than a rigorous mathematical formula, it will guide our discussion on the science of astronomy, biology, and astrobiology as we consider the possibility of life in the Universe.
Instructor: Nicole Gugliucci Course structure: Two weeks, four 60-minute meetings Meeting times: Mondays and Thursdays, 9–10 PM US Eastern time (6-7 PM US Pacific time) Course dates: Monday, March 17 — Thursday, March 27
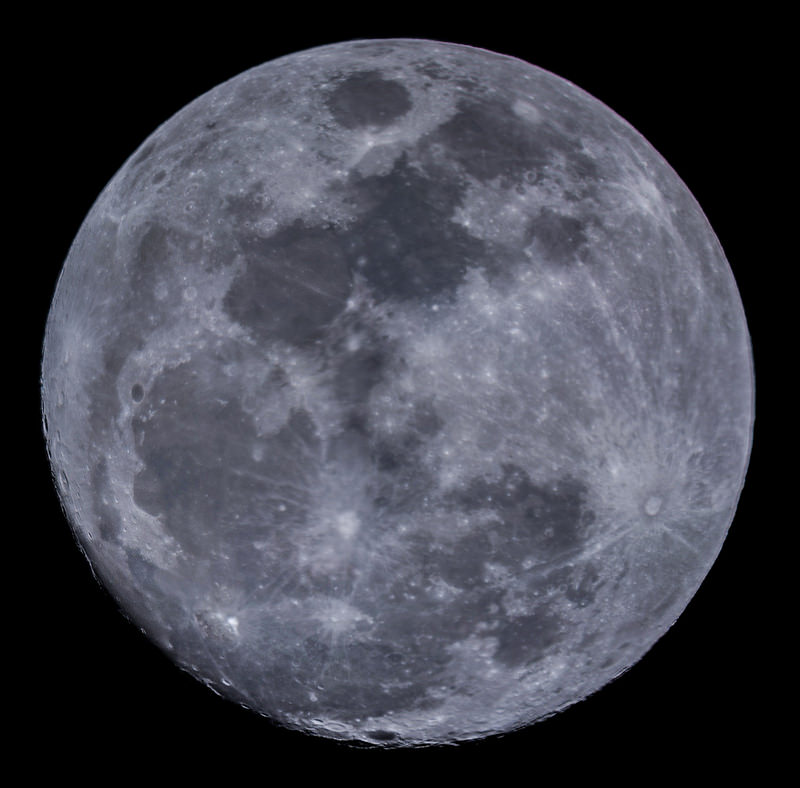
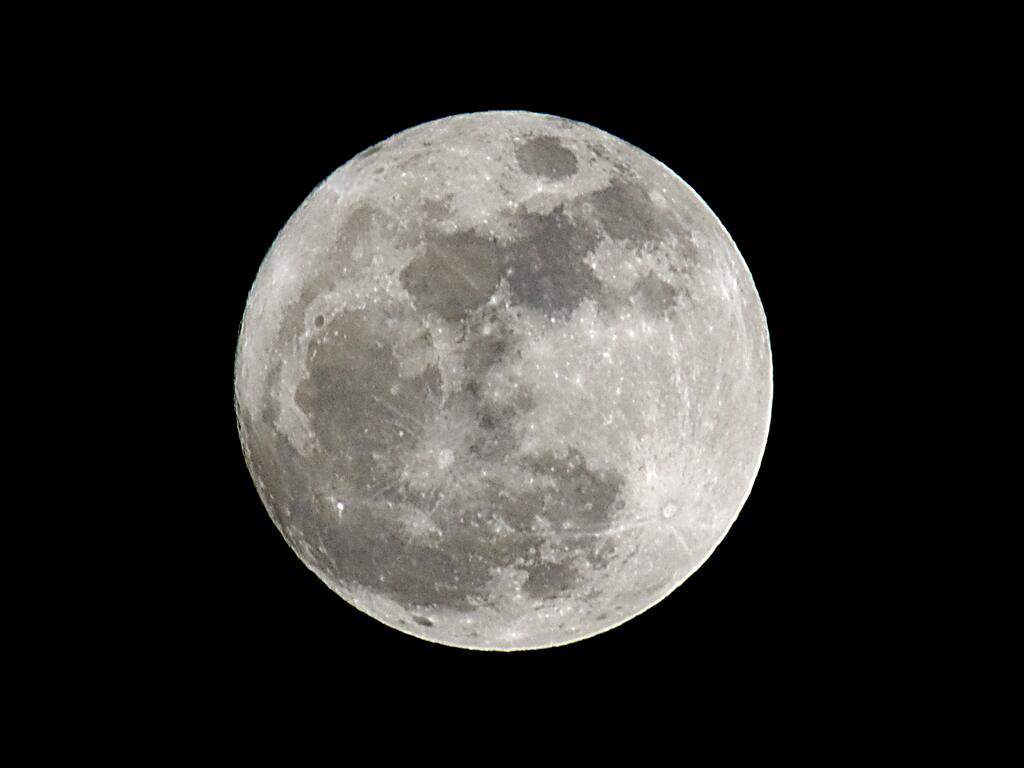
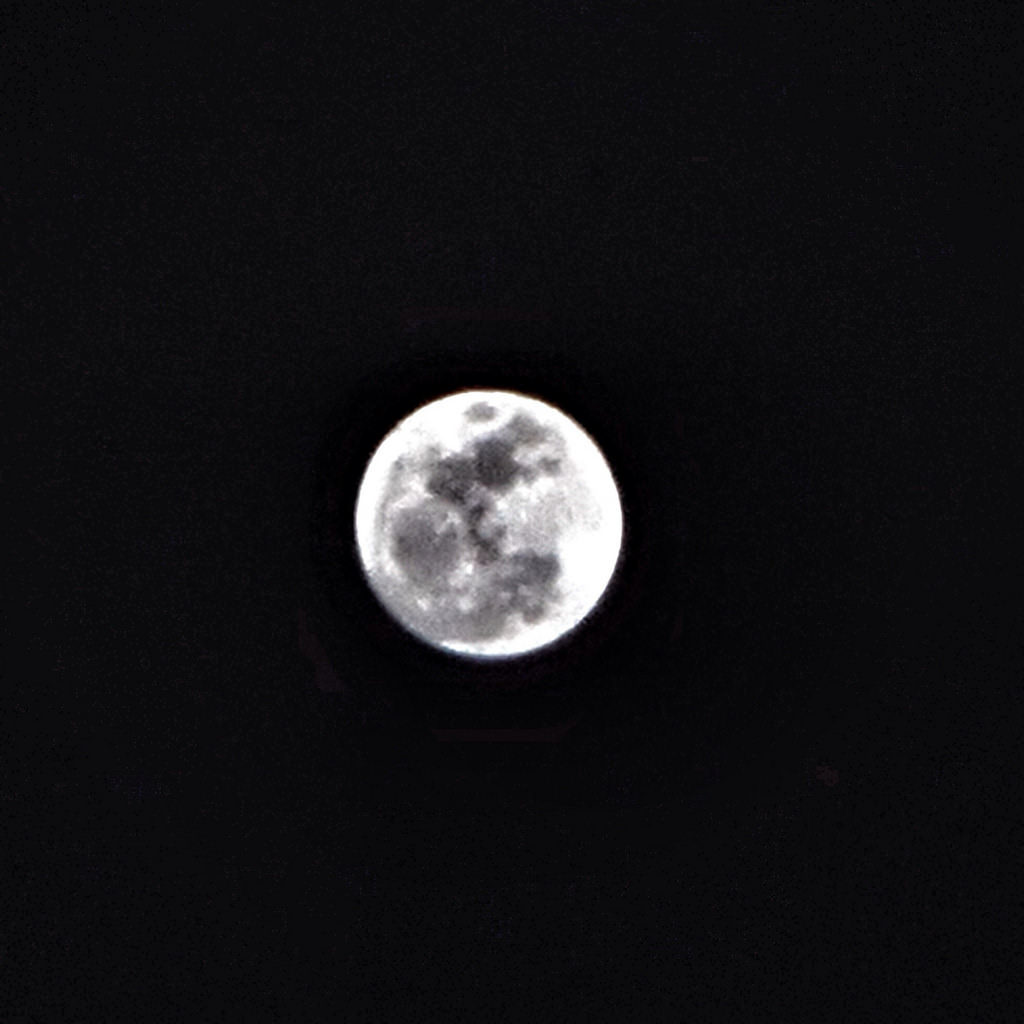
A 99% illuminated Moon within 24 hours of Full. Image Credit: Stephen Rahn.
So, did last night’s Full Wolf Moon seem a bit tinier than usual? It was no illusion, as avid readers of Universe Today know. As we wrote earlier this week, last night’s Full Moon was the most distant for 2014, occurring just a little under three hours after apogee.
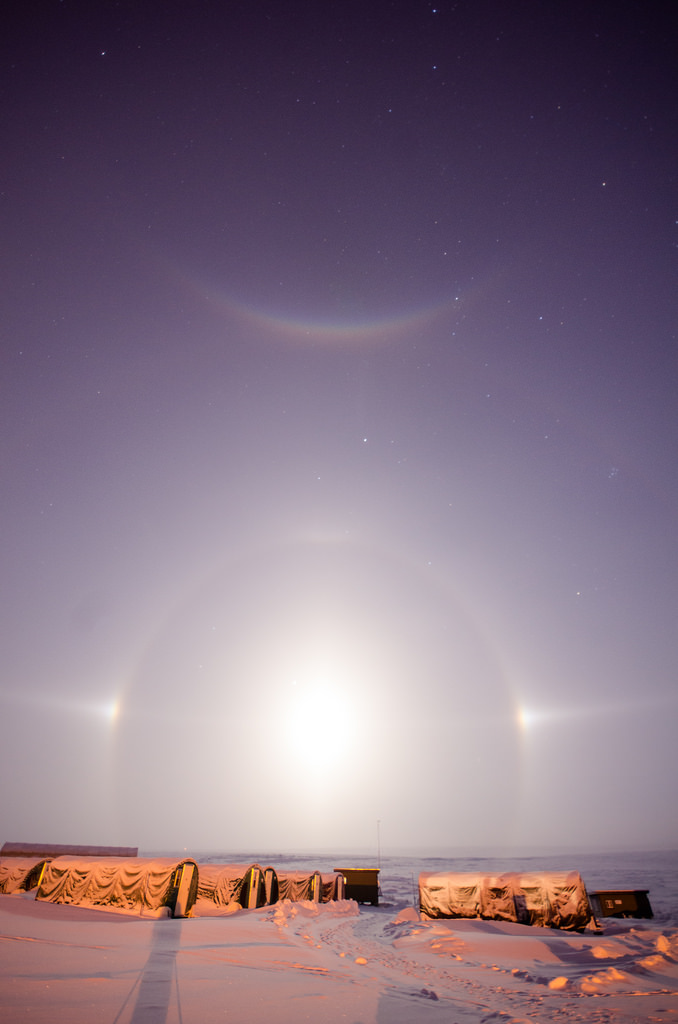
The Full Moon, a “Moon Dog” halo, and a rare parhelic (or do you say Palunic?) arc as seen from North Slope Borough County, Alaska. Credit-Jason Ahrns.
Sure, the Moon reaches apogee every lunation, at a distance nearly as far. In fact, the Moon at apogee can be as far as 406,700 kilometres distant, and last night’s apogee, at 406,536 kilometres, is only the second farthest for 2014. The most distant apogee for 2014 falls on July 28th at 3:28 Universal Time (UT) at just 32 kilometres farther away from our fair planet at 406,568 kilometres distant.
A 20 image composite shot using a Canon 60Da camera and a a 10″ Newtonian telescope. Credit-Stephen Rahn.
What made last night’s MiniMoon special was its close proximity in time to the instant of Full phase. The July 2014 apogee, for example, will occur just a day and four hours from New phase.
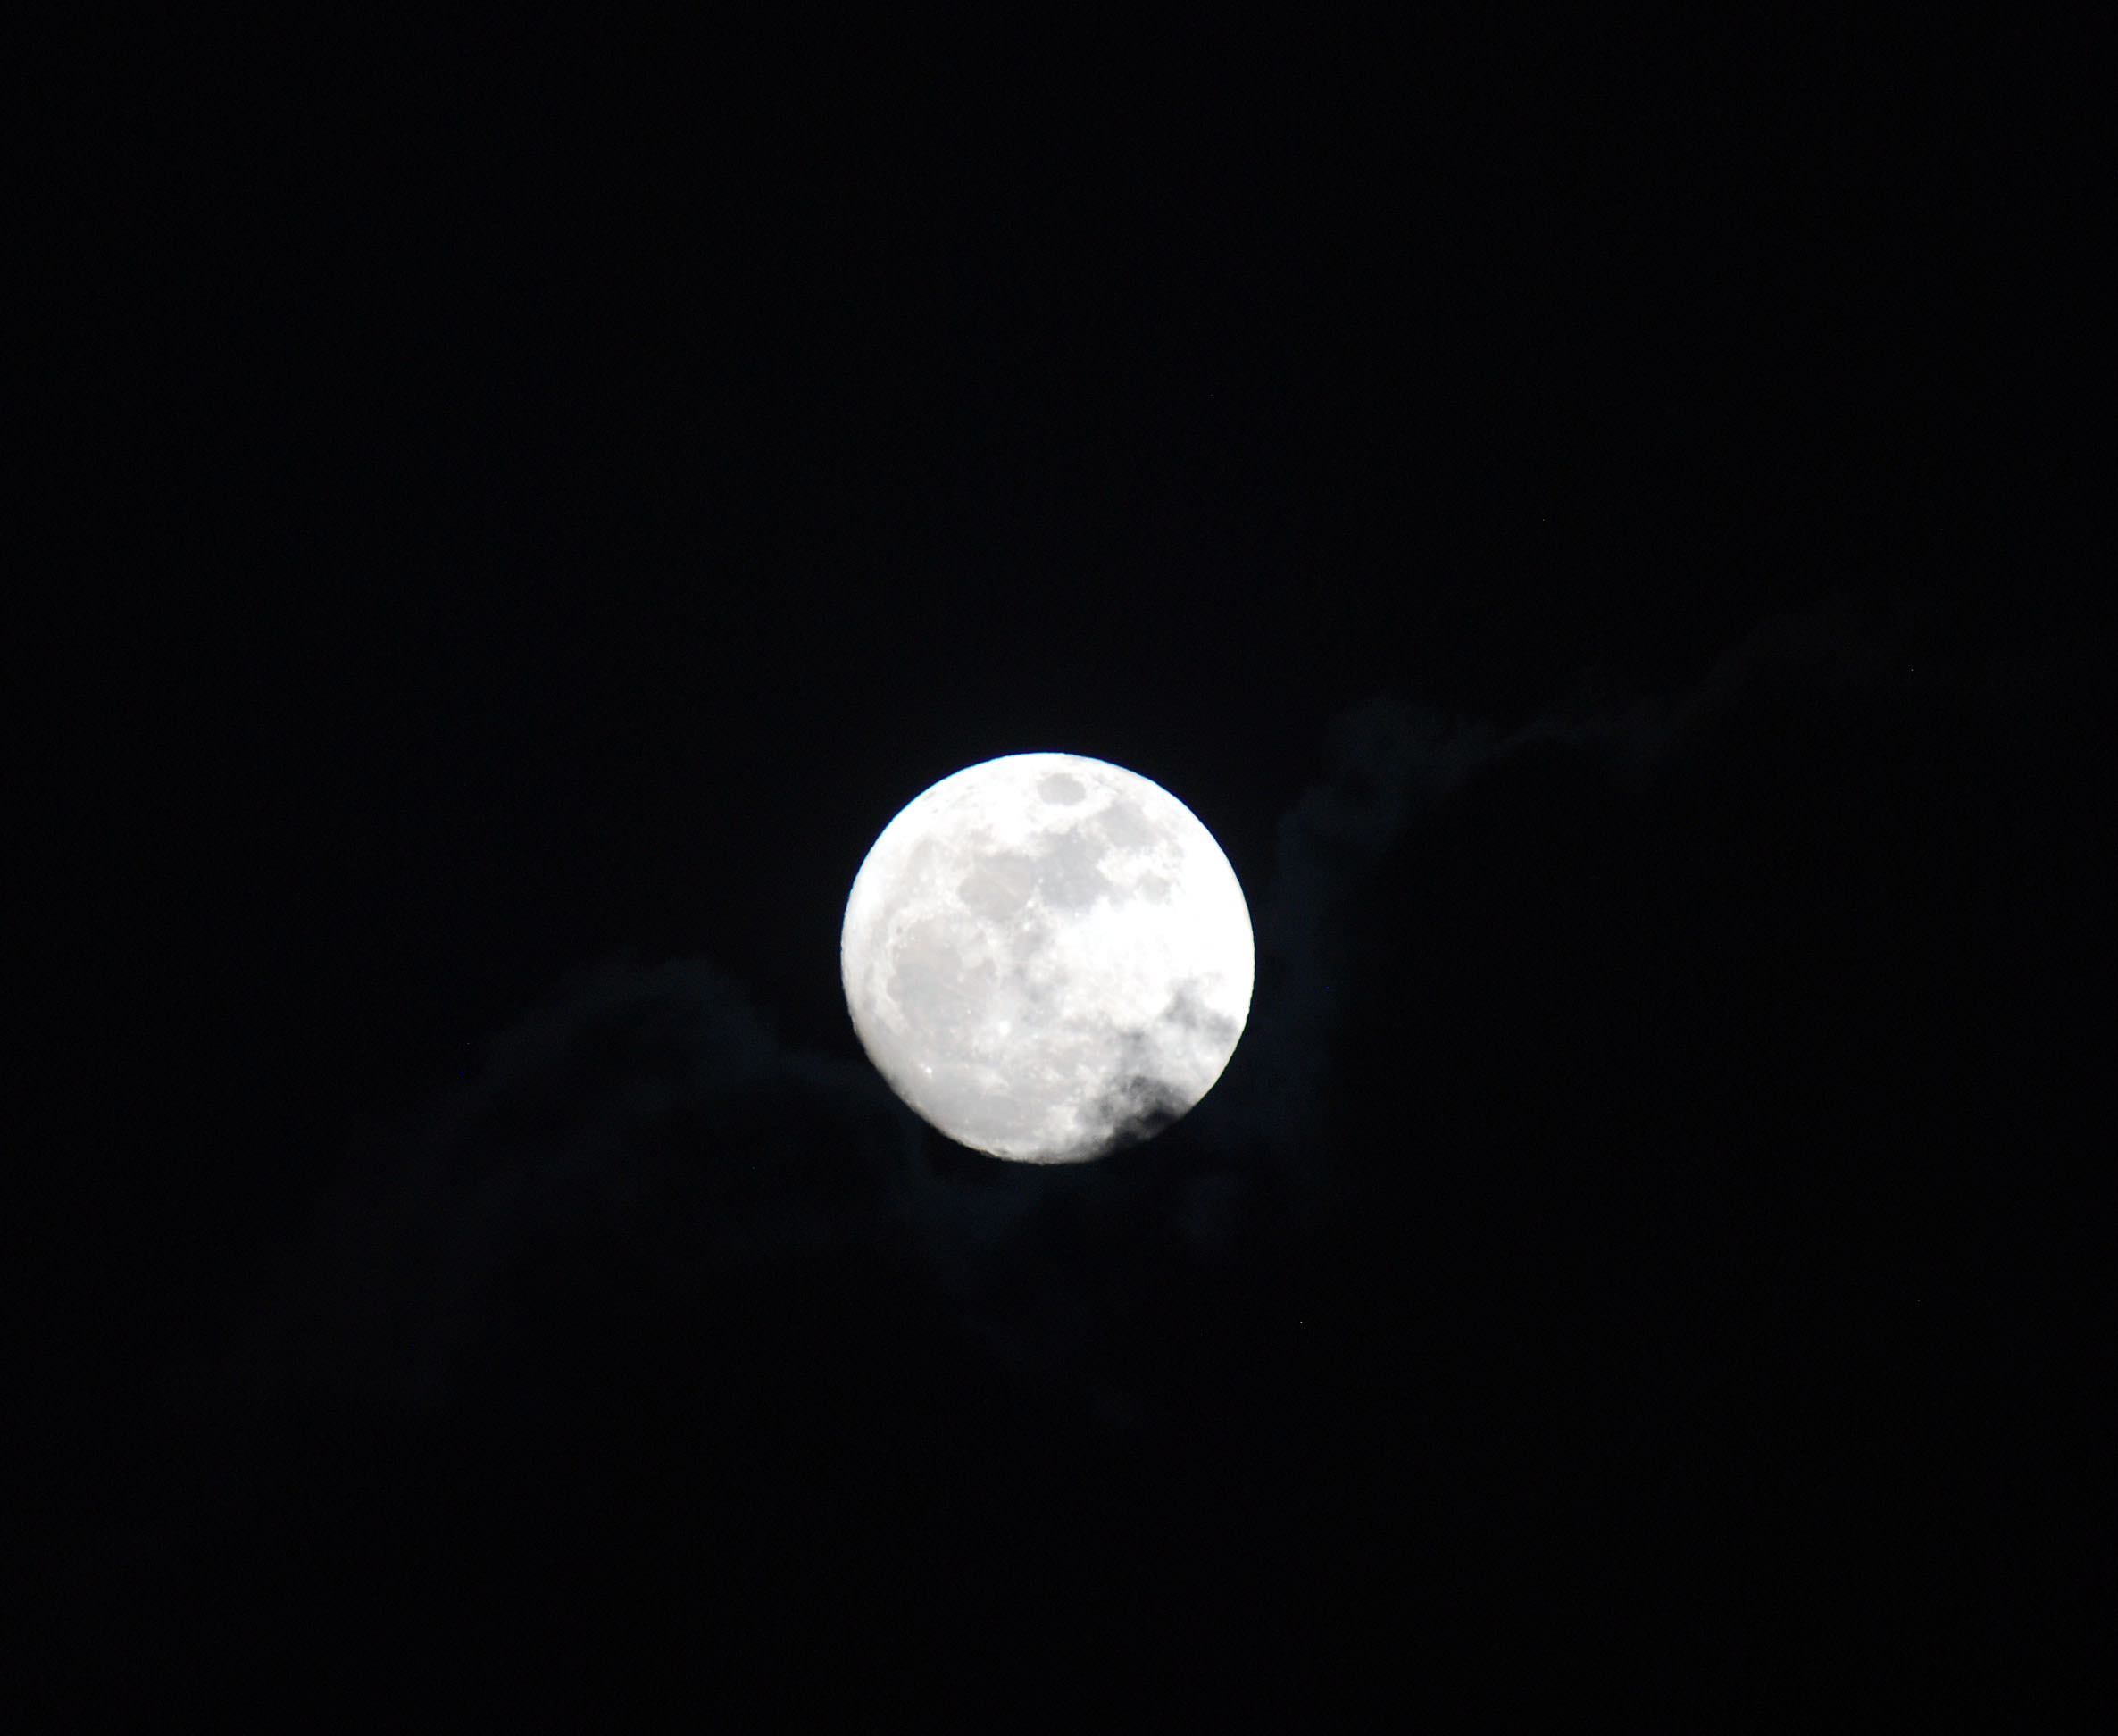
The 2014 MiniMoon rising behind clouds from Hudson, Florida. Photo by author.
Of course, it isn’t the Moon that’s doing the shrinking, though you’d be surprised the stuff we’ve seen around ye ole Web even on reputable news sites over the past week. The variation of the apparent size of the Full Moon does make for an interesting study in perception. The Moon varies in size from apogee to perigee from about 29.3’ across to 34.1’. This is variation amounts to 14% in apparent diameter.
The Full MiniMoon, clouds, and Jupiter. Credit– Shaun Reynolds (@shaunreylec), Bungay UK.
Here’s an interesting challenge that you can do for a one year period, requiring just a working set of eyes: observe the Full Moon for 12 successive lunations. Can you judge which one was the “SuperMoon” and which one was the “MiniMoon” without prior knowledge?
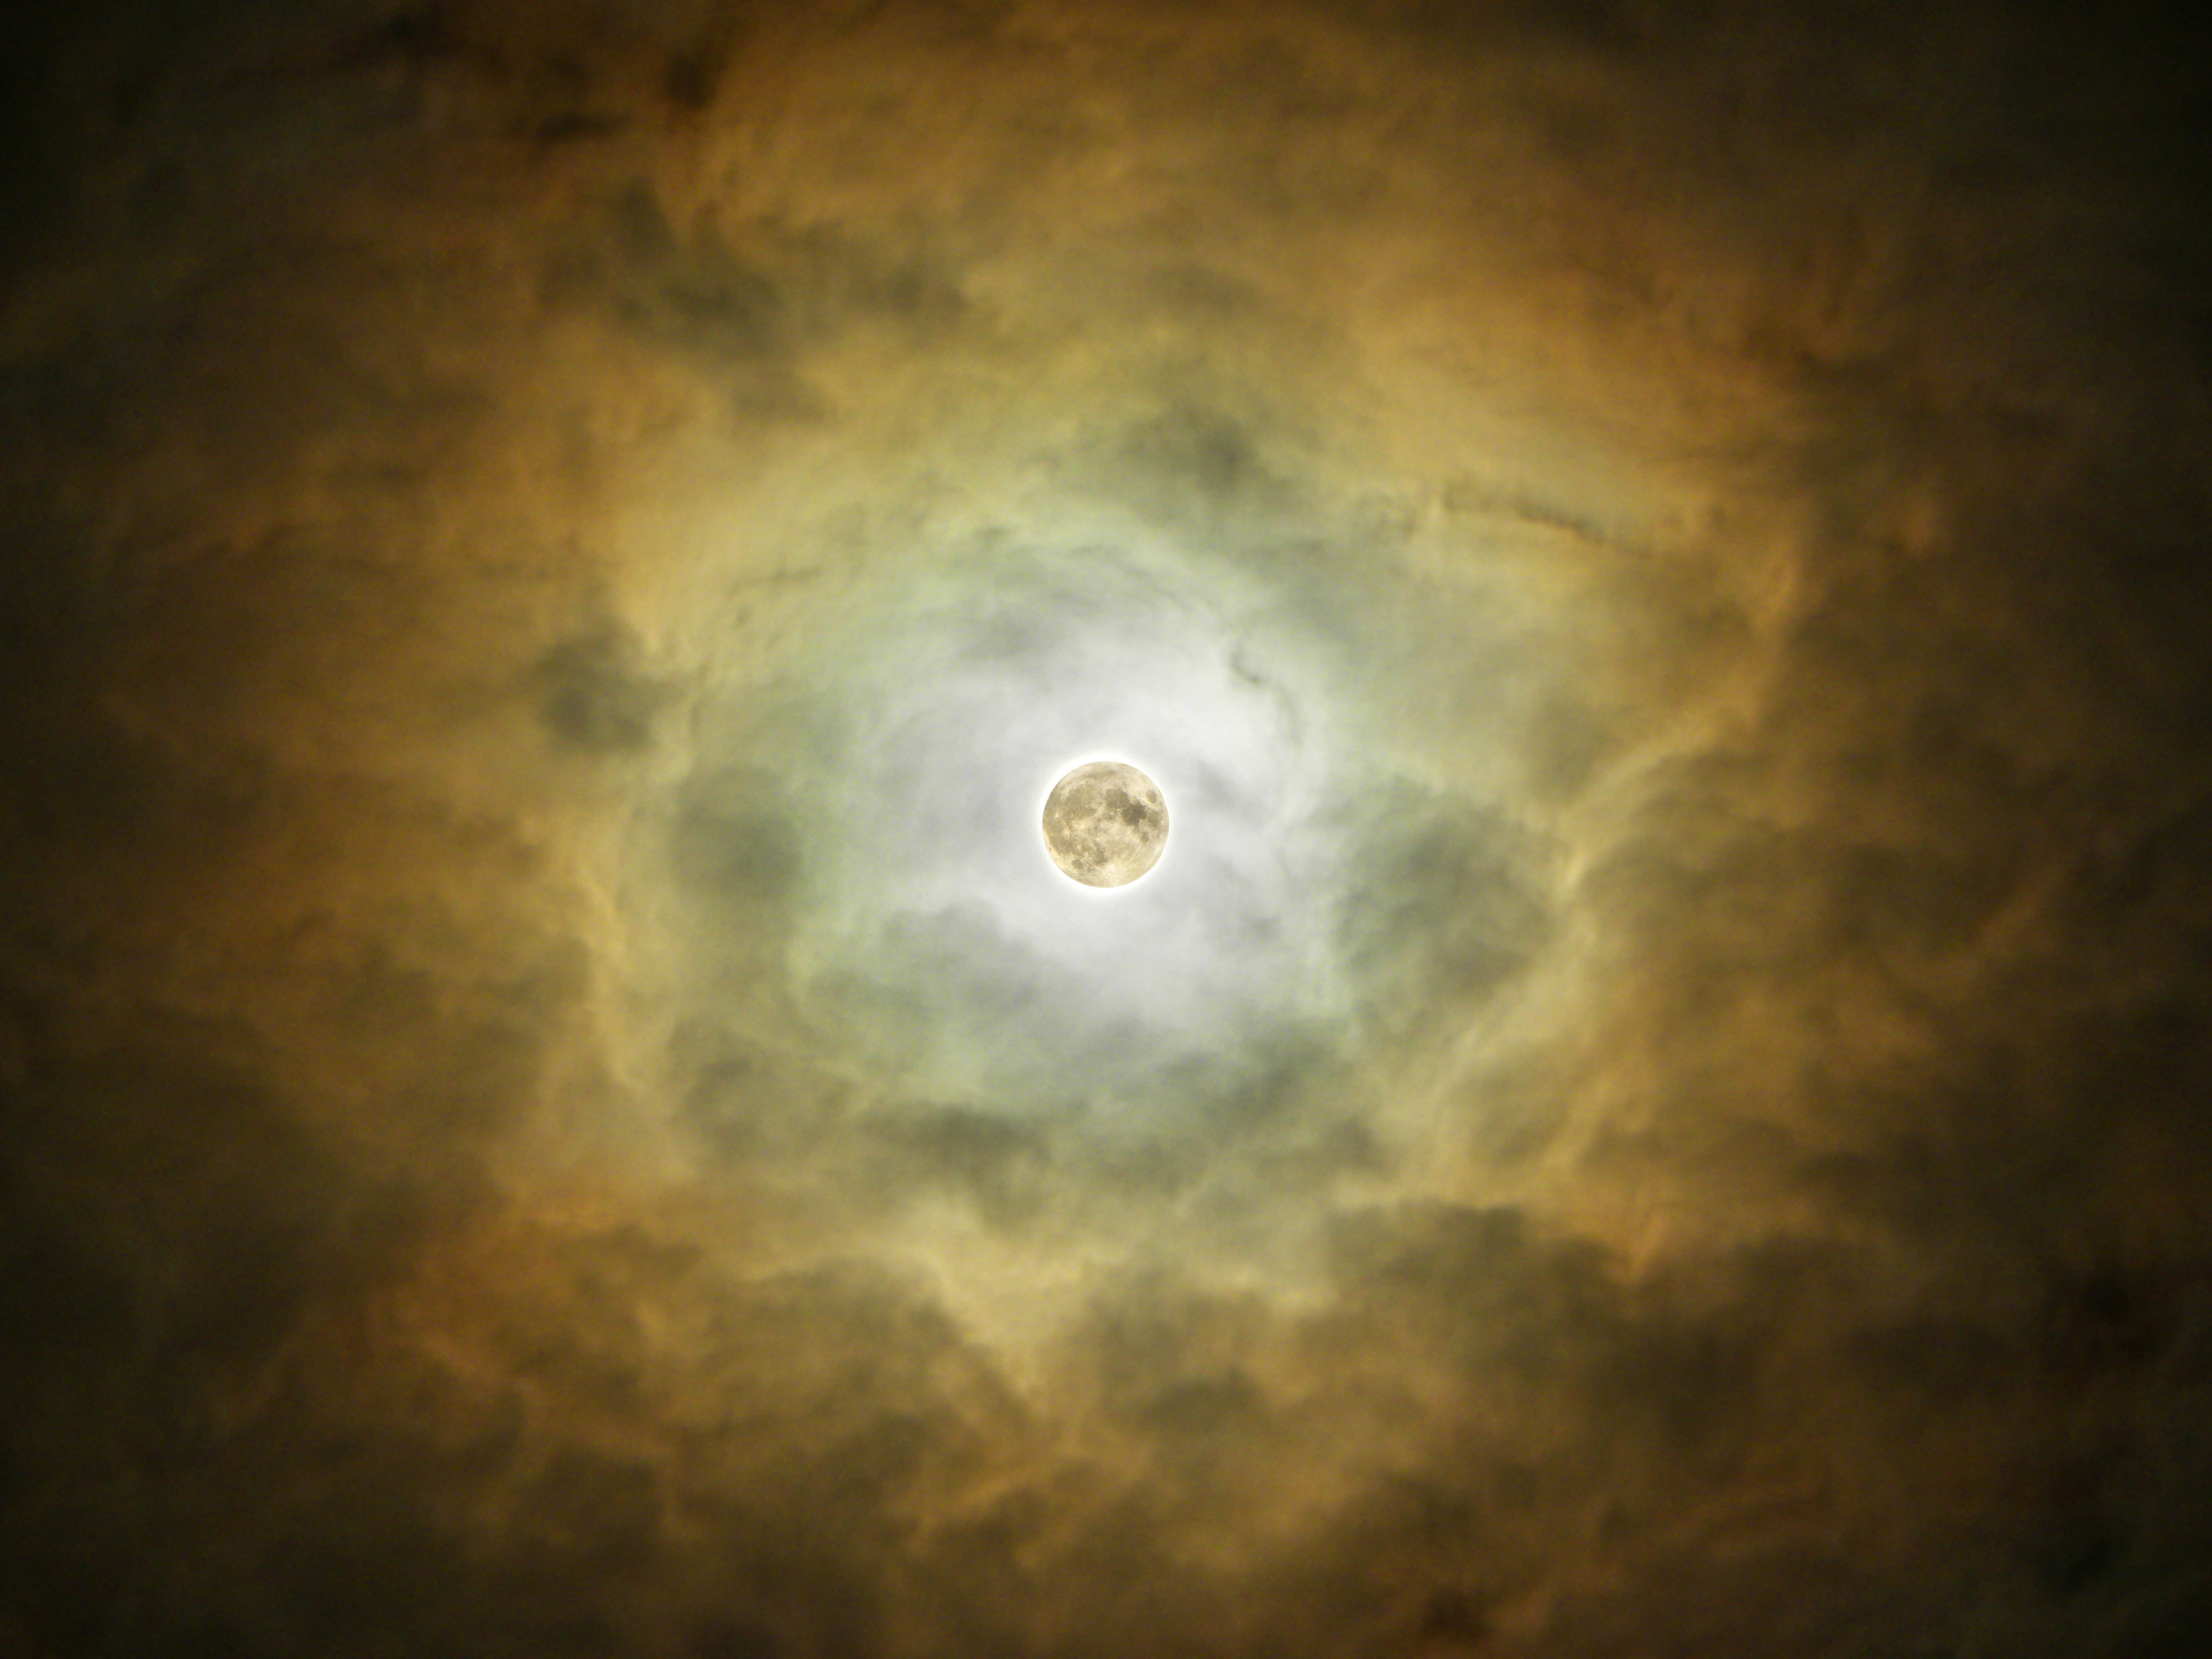
A “MiniMoon Nebula…” The Full Moon illuminating foreground clouds. The HDR visualization of the Moon was added for context. Taken with a tripod mounted Nikon P90 Bridge camera. Credit: Giuseppe Petricca of Sulmona, Abruzzo, Italy.
And as you can see, we also got plenty of pictures here at Universe Today from readers of the Mini-Moon from worldwide.
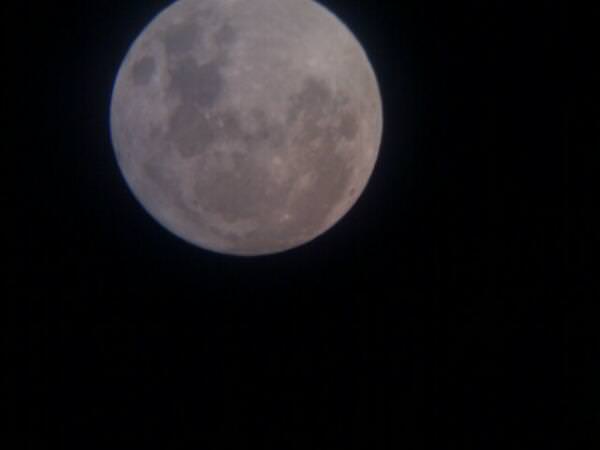
The MiniMoon shot using a mobile phone held up to the eyepiece of a telescope. Credit-Andrew Millarkie (@Millarkie) Glasgow, Scotland.
The rare occurrence of an “Extreme-MiniMoon” — or do you say “Ultra?” — also sparked a lively discussion about the motion of the Moon, how rare this event is, and when it was last and will next be surpassed. A fun online tool to play with is Fourmilab’s Lunar Apogee and Perigee Calculator. Keep in mind, the motion of the Moon is complex, and accuracy for most planetarium programs tends to subside a bit as you look back or forward in time. The distances used in Fourmilab’s calculations are also geocentric, accounting for the center-to-center distance of the Earth-Moon system.
The MiniMoon versus streetlights as seen from Nueva Casarapa, Venezuela. Credit: Jose Mauricio Rozada (@jmrozada)
Suffice to say, this year’s Full MiniMoon was the most distant for several decades before 2014 or after.
Anthony Cook of the Griffith Observatory notes that JPL’s Horizons web interface gives a max distance for the Moon of 406,533 kilometres at 1:35 UT earlier today, 3 hours and 19 minutes prior to Full.
The Full MiniMoon glimpsed between clouds as seen from central Illinois. Credit-Matt Comerford, (@kb9uwu)
The next closest spread of apogee versus perigee occurs on November 18th, 1994 at 1 hour and 51 minutes apart, and 2014’s Mini-Moon won’t be surpassed in this regard until May 13th, 2052. Looking at the distances for the Moon on these dates using Starry Night, however, we get an slightly closer occurrence of 406,345 kilometres for 1994 and 406,246 kilometres for 2052.
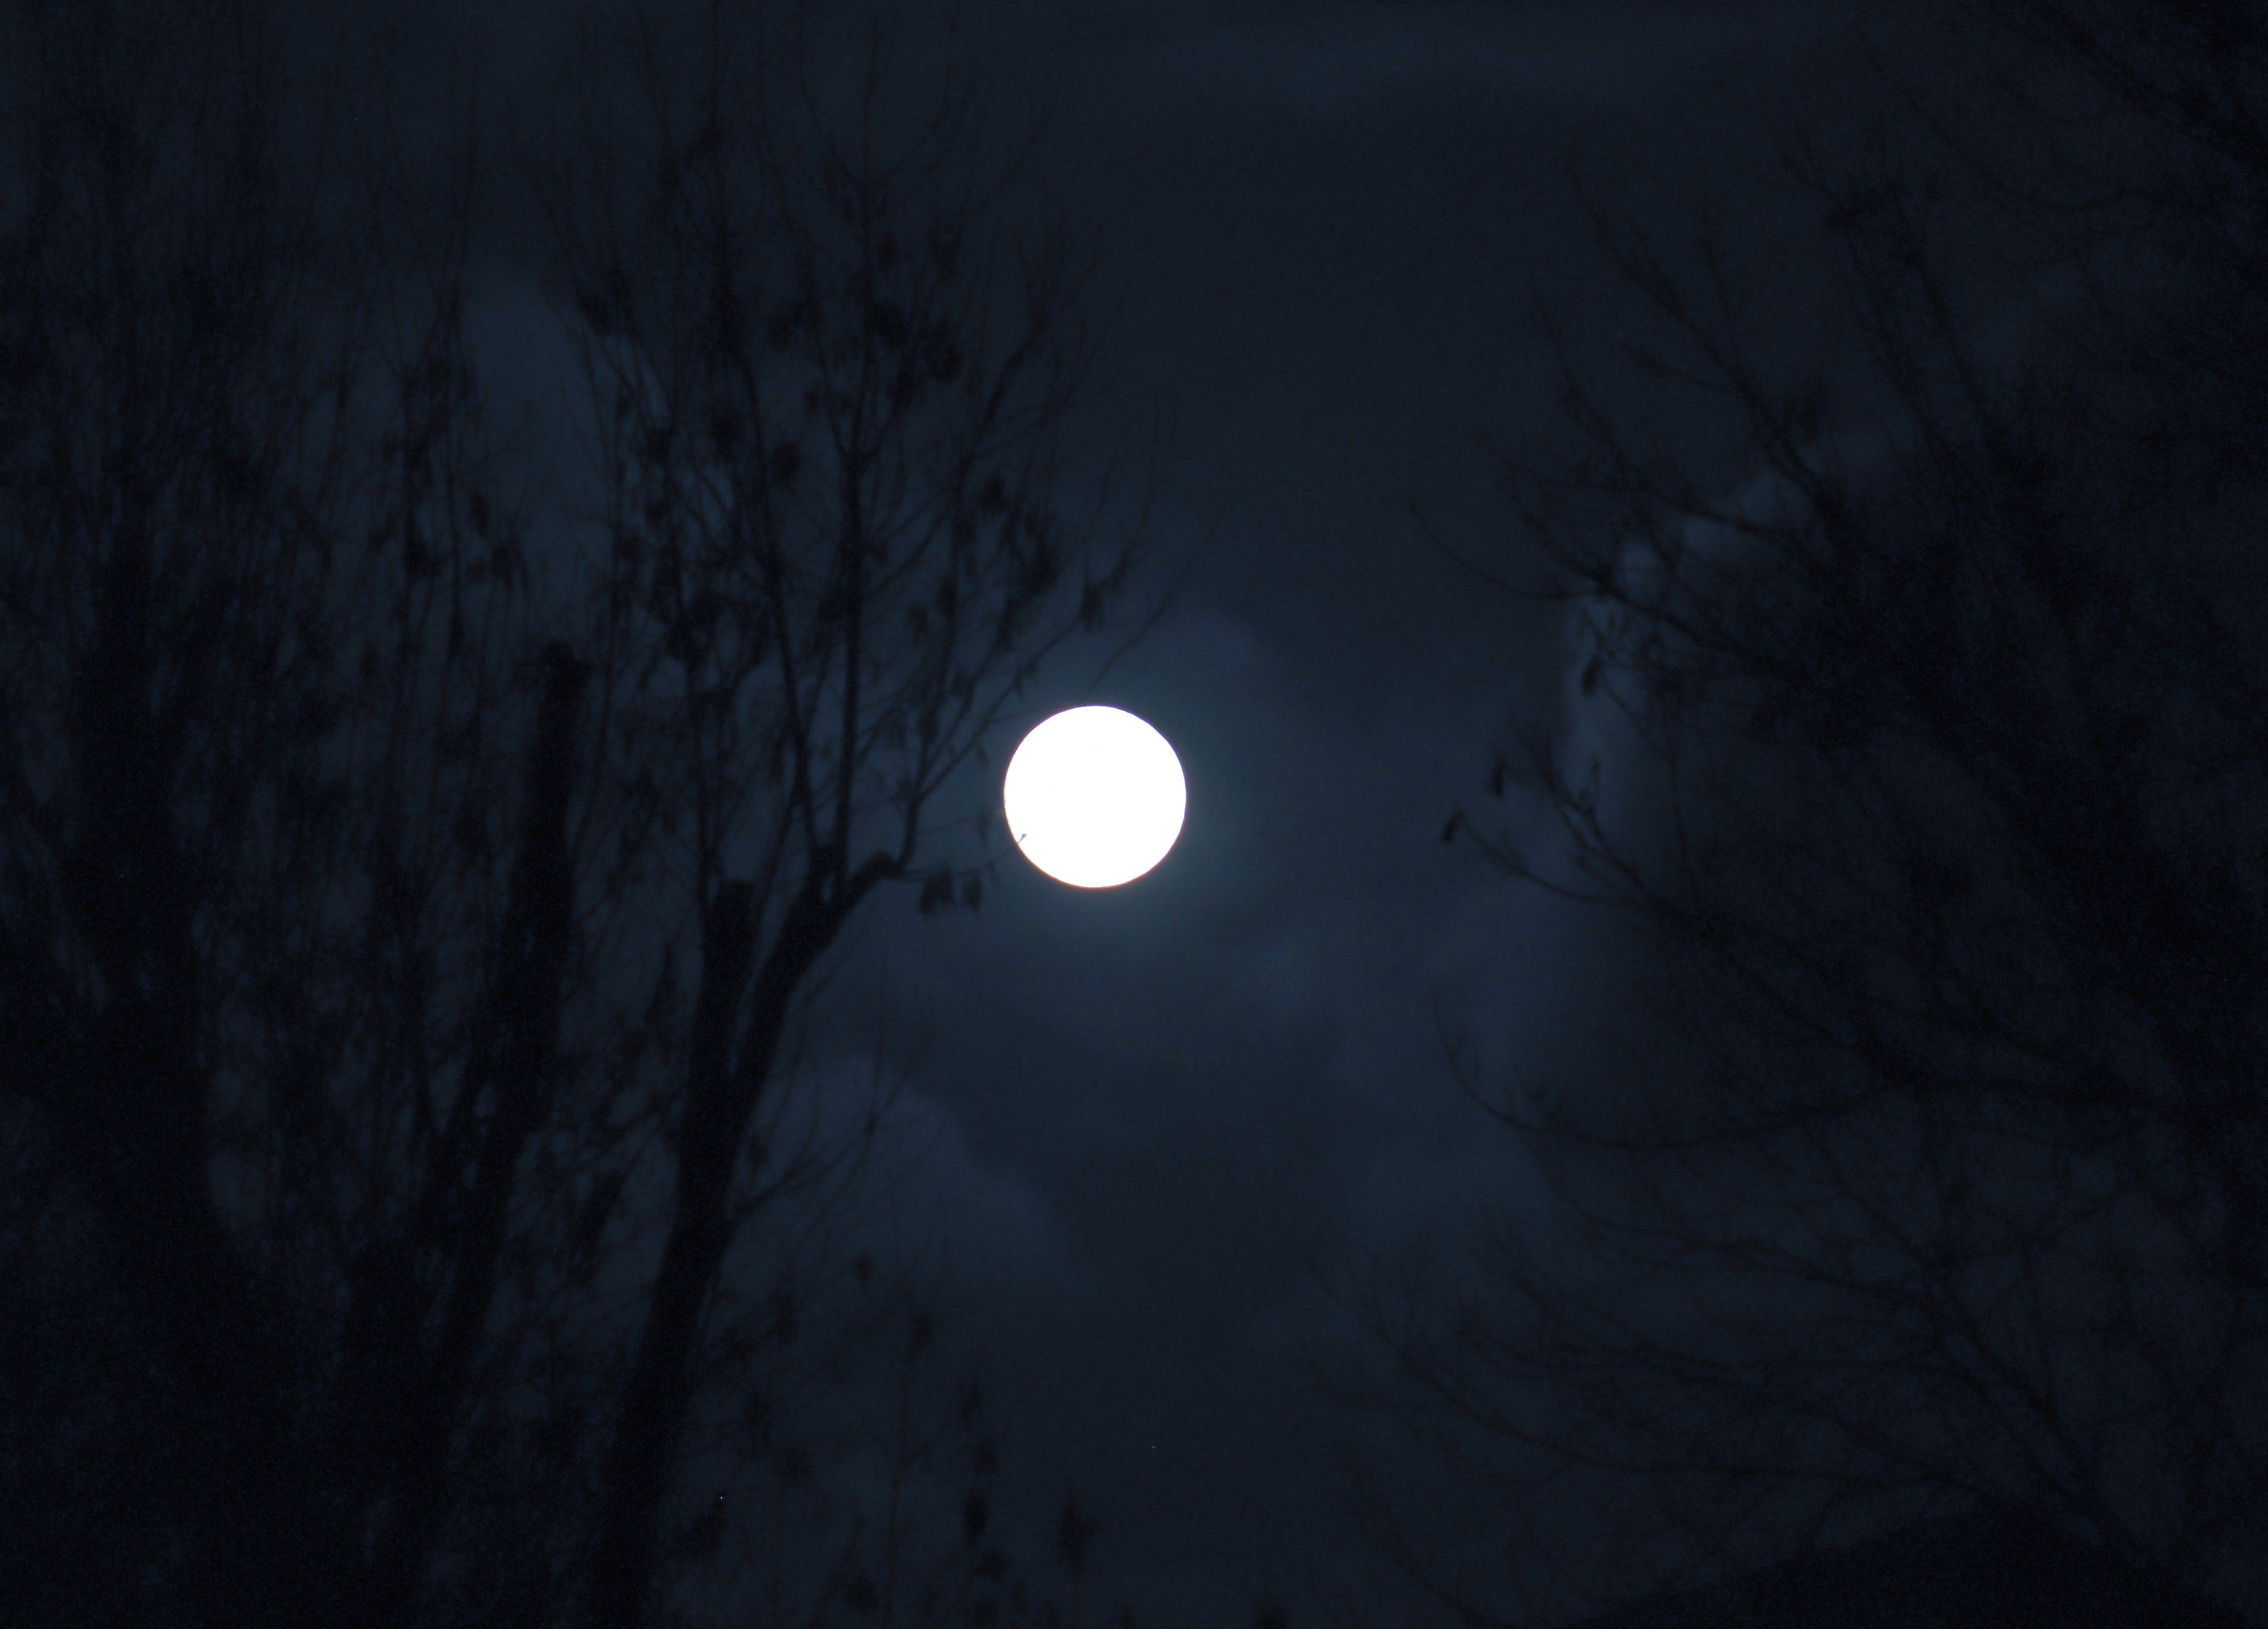
The Full MiniMoon rising behind a stand of trees. Credit– Sculptor Lil.
And to top it off, the 1994 Mini-Moon was during a partial penumbral eclipse as well… we’ll leave that as a homework assignment for the astute readers of Universe Today to calculate how often THAT occurs. It should be fairly frequent over the span of a century, as the Moon has to be at Full phase for a total lunar eclipse to occur.
Looking over a larger span of time, @blobrana notes on Twitter that closer occurrences of apogee versus Full Moon with the same approximate circumstances as 2014 also occurred on October 29th 817 AD (with a 1 hour and 38 minute difference) and won’t occur again until December 20th, 2154. If research can prove or disprove that these events were even more distant, then the 2014 Extreme MiniMoon was a millennial rarity indeed…
Perhaps this won’t be the last we’ve heard on the subject!
John Dobson, amateur astronomer and astronomy popularizer, died Jan. 14 at 98 in Burbank, Calif. Credit: Wikipedia
The cosmos lost a good soul Wednesday. John Dobson, famous as the creator of the simple, low-cost Dobsonian telescope, passed away on Jan. 15, 2014. His obituary appeared on the website of the Sidewalk Astronomers:
“It is with heavy hearts that we must report the passing of John Dobson. He died peacefully this morning, Wednesday, January 15th, in Burbank, California. He was 98 years old. He leaves behind a son, numerous close friends, and fans and admirers worldwide.
On March 8th, in honor of John, this year’s ISAN (International Sidewalk Astronomy Night) will be dedicated to his memory. Amateur astronomers around the globe can join in and celebrate John’s life and continue to carry the torch that he lit back in 1968 when he co-founded the San Francisco Sidewalk Astronomers.”
John Dobson tugs on his ear to make a point during a lecture as guest speaker during Northwoods Starfest near Eau Claire, Wis. U.S. in August 2000. Credit: Bob King
Dobson was born in Beijing, China but moved with his parents to San Francisco in 1927. After spending 23 years in a monastery, some of which time was spent sneaking out to build telescopes and observe the night sky, he left to co-found the San Francisco Sidewalk Astronomers in 1968, a group dedicated to showing people on the street the wonders of the night sky using large (for the time) telescopes.
Dobson’s interest in astronomy started in the early 1950s when he built a small telescope using spare parts found in a junk store. He wanted to see for himself what the universe looked like. By 1956, John got a hold of a 12-inch slab of porthole glass and ground it into a mirror following instructions from Allyn J. Thompson’s classic book Making Your Own Telescope. His first look at the last quarter turned him into an astro-evangelist:
“It looks like you’re coming in for a landing,” he wrote in his own telescope making book many years later. From that moment on Dobson felt “that everybody who lives in this world has to see that.”
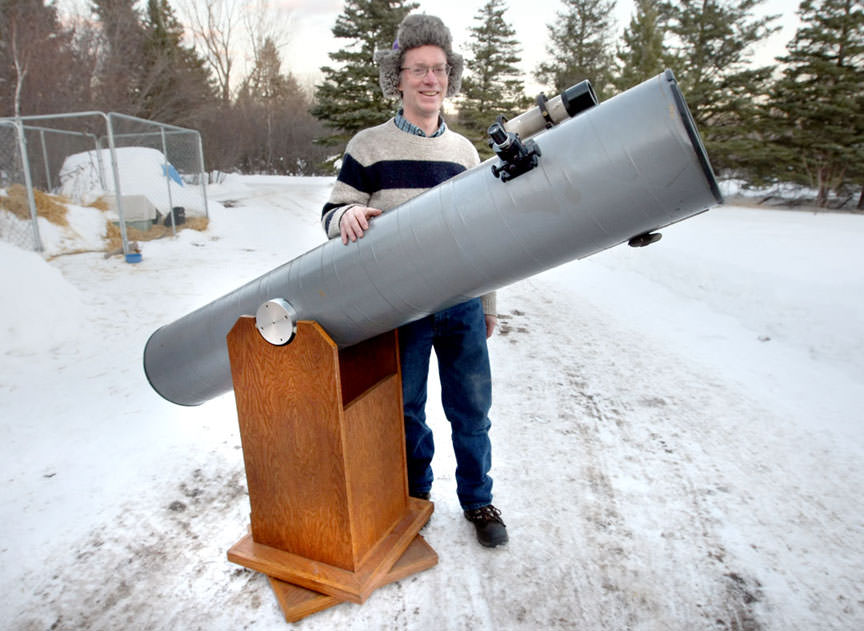
The writer with his 10-inch Dobsonian reflecting telescope. The scope breaks down into two pieces like John Dobson’s original design – a cardboard tube with the optics and a cradle. See photo below to see how a “Dob” works. Credit: Bob King
Toting beat-up, monster telescopes everywhere from downtown San Francisco and to national parks across the country, Dobson made good on his promise. He lectured widely on astronomy and cosmology, rejecting the Big Bang Theory for his own Recycling Steady State Theory.
Agree or not with his cosmology, Dobson shook up the amateur telescope making universe with an innovative telescope design based on simplicity. Most telescopes of his day were small refracting telescopes or small to modest-sized reflectors with metal tubes and heavy equatorial mounts. Neither was exactly user-friendly nor offered much light gathering ability.
The mount is a simple altitude-azimuth or “alt-az” design. The scope moves up and down (altitude) against teflon pegs (right) and turns through in a circle (azimuth) on teflon pads against a laminate surface on the base. Credit: Bob King
John used simple materials like porthole glass, cardboard tubes and wooden altitude-azimuth (alt-az) mounts to build incredibly easy to use large telescopes. However primitive, his instruments delivered bright and satisfying images of all the cool, faint stuff in the sky to the average Joe and Jane. Each telescopes had its own name: Little Bertha, Delphinium, Stellatrope, Little One (an 18-incher).While alt-az mounts were nothing new, Dobson combined cheap materials, large mirrors and a simpler approach to mountings that made his telescope style unique. Too unique for some.
Get to know John Dobson a little better in this video titled “Have Telescopes, Will Travel”
In the summer of 1969 Dobson pitched his simple ideas to Sky and Telescope magazine. Then-editor Charles Federer wrote back a polite rejection, stating that Dobson’s techniques weren’t up to standards and “could hardly lead to satisfactory instruments in the kind most amateurs want in these large sizes.”
How wrong this early assessment would turn out to be! His ideas became widely adopted starting in the early 1980s, when Coulter Opticalbegan manufacturing 13.1-inch and 17.5-inch large reflecting telescopes with inexpensive mirrors and simple alt-azimuth mounts that soon were called “Dobsonian” because they were based on John’s original designs.
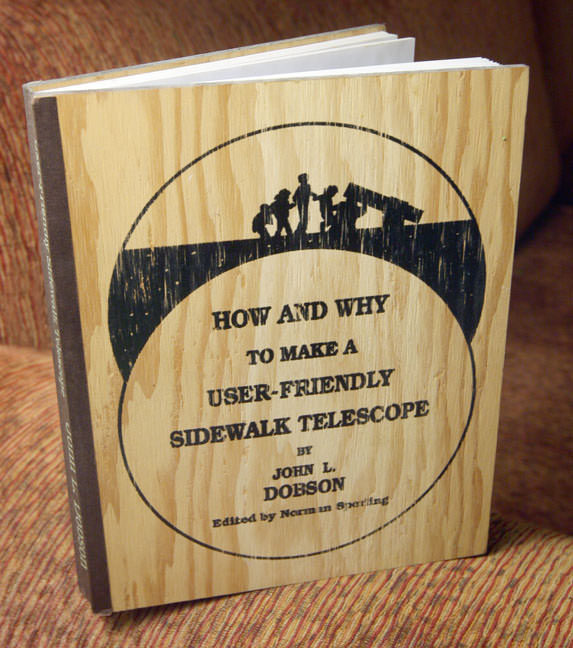
John Dobson’s book on how to build your own telescope featured a unique cover made of plywood, a favorite material for building Dobsonian mounts. Credit: Bob King
These days, Dobsonian reflecting telescopes have gone viral. There are how-to books on how to build everything from simple to sophisticated Dobsonsians , including Dobson’s own unique plywood-bound How and Why to Make a User-Friendly Sidewalk Telescope. Don’t want to build one yourself? Most telescope outlets sell several lines of Dobsonians. Heck, my 10-inch and 15-inch reflectors, the most used of my instruments, originate from John’s genius.
When someone asks me to recommend a telescope, I always say “Get a Dobsonian!” They’re extremely portable, very stable, quick to set up and take down and the least expensive per inch of aperture of any scope out there.
John Dobson’s signature in his book on telescope making. Click image for more on Dobson’s life and writings. Credit: Bob King
Dobson wanted everyone to share in the universe’s bounty, the better to appreciate our lives and our world. The next clear night tilt your head back, gaze up at the stars and imagine John up there smiling. What an incredible view he must have.
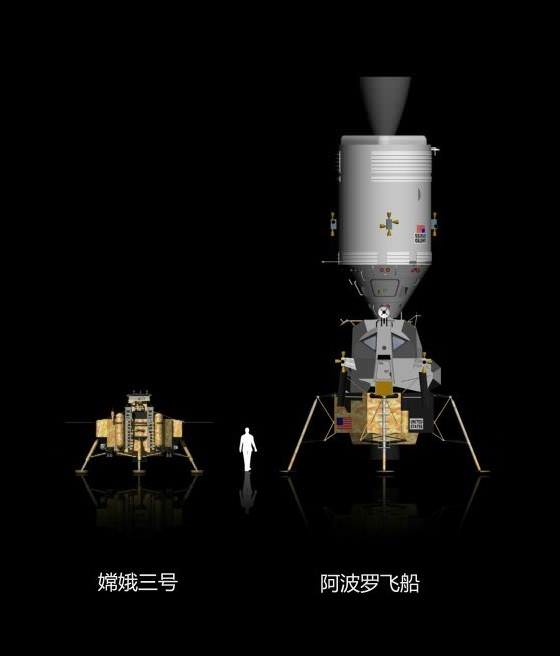
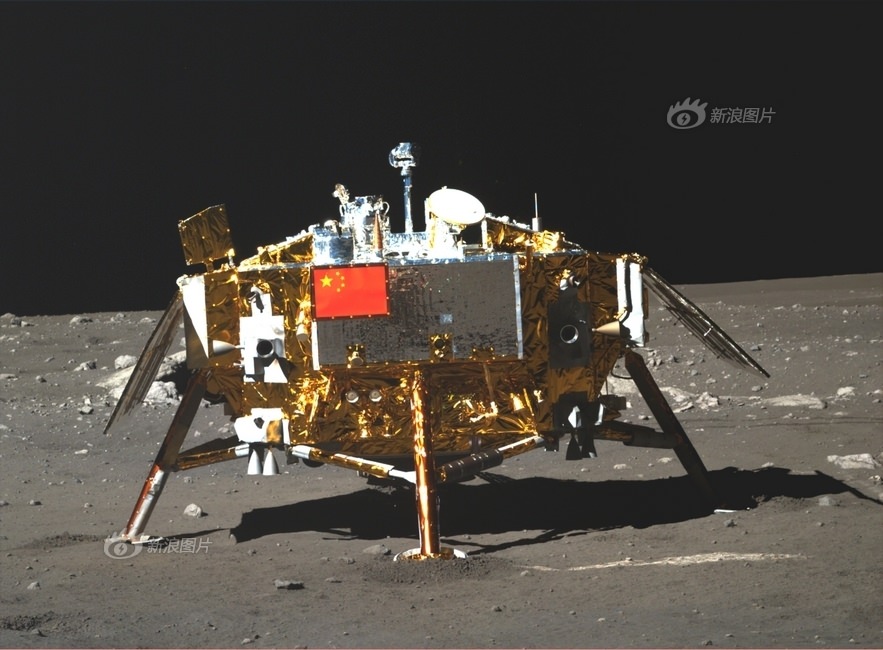
Comparison of China’s Chang’e-3 unmanned lunar lander of 2013 vs. NASA’s Apollo manned lunar landing spacecraft of the 1960?s and 1970?s
Comparison of China’s Chang’e-3 unmanned lunar lander of 2013 vs. NASA’s Apollo manned lunar landing spacecraft of the 1960’s and 1970’s
Story updated[/caption]
Is China’s Chang’e-3 unmanned lunar lander the opening salvo in an ambitious plan by China to land people on the Moon a decade or so hence?
Will China land humans on the Moon before America returns?
It would seem so based on a new report in the People’s Daily- the official paper of the Communist Party of China – as well as the express science goals following on the heels of the enormous breakthrough for Chinese technology demonstrated by the history making Chang’e-3 Mission.
The People’s Daily reports that “Chinese aerospace researchers are working on setting up a lunar base,” based on a recent speech by Zhang Yuhua, deputy general director and deputy general designer of the Chang’e-3 probe system.
No humans have set foot on the moon’s surface since the last US lunar landing mission when Apollo 17 astronauts Gene Cernan and Harrison ‘Jack’ Schmitt departed 41 years ago on Dec. 14, 1972.
For context, the landing gear span of Chang’e-3 is approximately 4.7 meters vs. 9.07 meters for NASA’s Apollo Lunar Module (LM).
Photo of Chang’e-3 moon lander emblazoned with Chinese national flag taken by the panoramic camera on the Yutu moon rover on Dec. 22, 2013. Credit: CNSA
When will the US flag return?
Right now China is actively at work on the critical technology required to conduct a manned landing on the Moon, perhaps by the mid-2020’s or later, and scoping out what it would accomplish.
“In addition to manned lunar landing technology, we are also working on the construction of a lunar base, which will be used for new energy development and living space expansion,” said Zhang at a speech at the Shanghai Science Communication Forum. Her speech dealt with what’s next in China’s lunar exploration program.
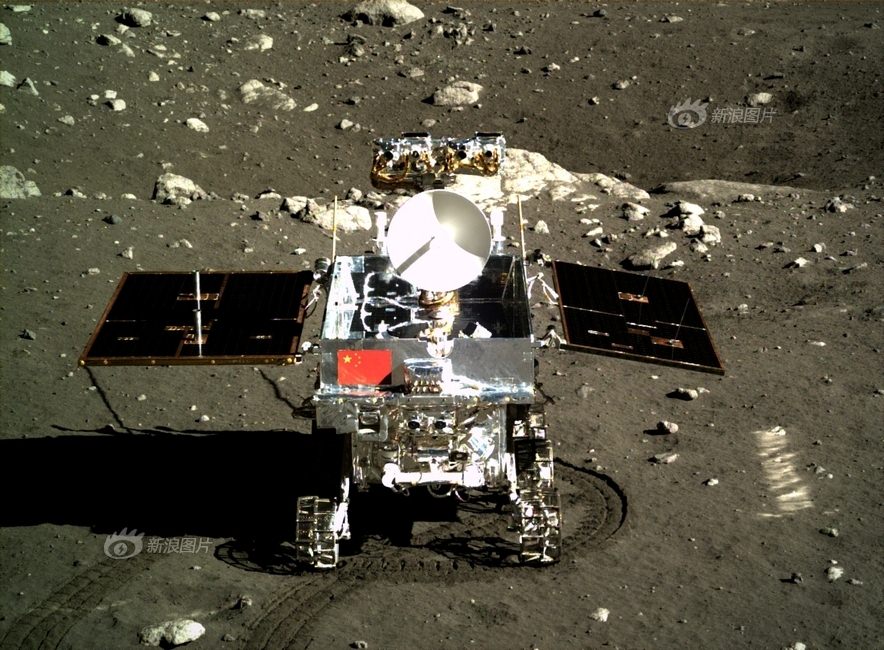
China’s Yutu lunar rover, deployed by the Chang’e-3 lander, is equipped with a suite of science instruments and a ground penetrating radar aimed at surveying the moon’s geological structure and composition to locate the moon’s natural resources for use by potential future Chinese astronauts.
Portrait photo of Yutu moon rover taken by camera on the Chang’e-3 moon lander on Dec. 15, 2013 shortly after rolling all 6 wheels onto lunar surface. Credit: Chinese Academy of Sciences
But the Chinese government hasn’t yet made a firm final decision on sending people to the Moon’s surface.
“The manned lunar landing has not yet secured approval from the national level authorities, but the research and development work is going on,” said Zhang.
Meanwhile the US has absolutely no active plans for a manned lunar landing any time soon.
President Obama cancelled NASA’s manned Constellation “Return to the Moon” program shortly after he assumed office.
And during the 2012 US Presidential campaign, the Republican presidential candidate Mitt Romney famously declared “You’re fired” to anyone who would propose a US manned lunar base.
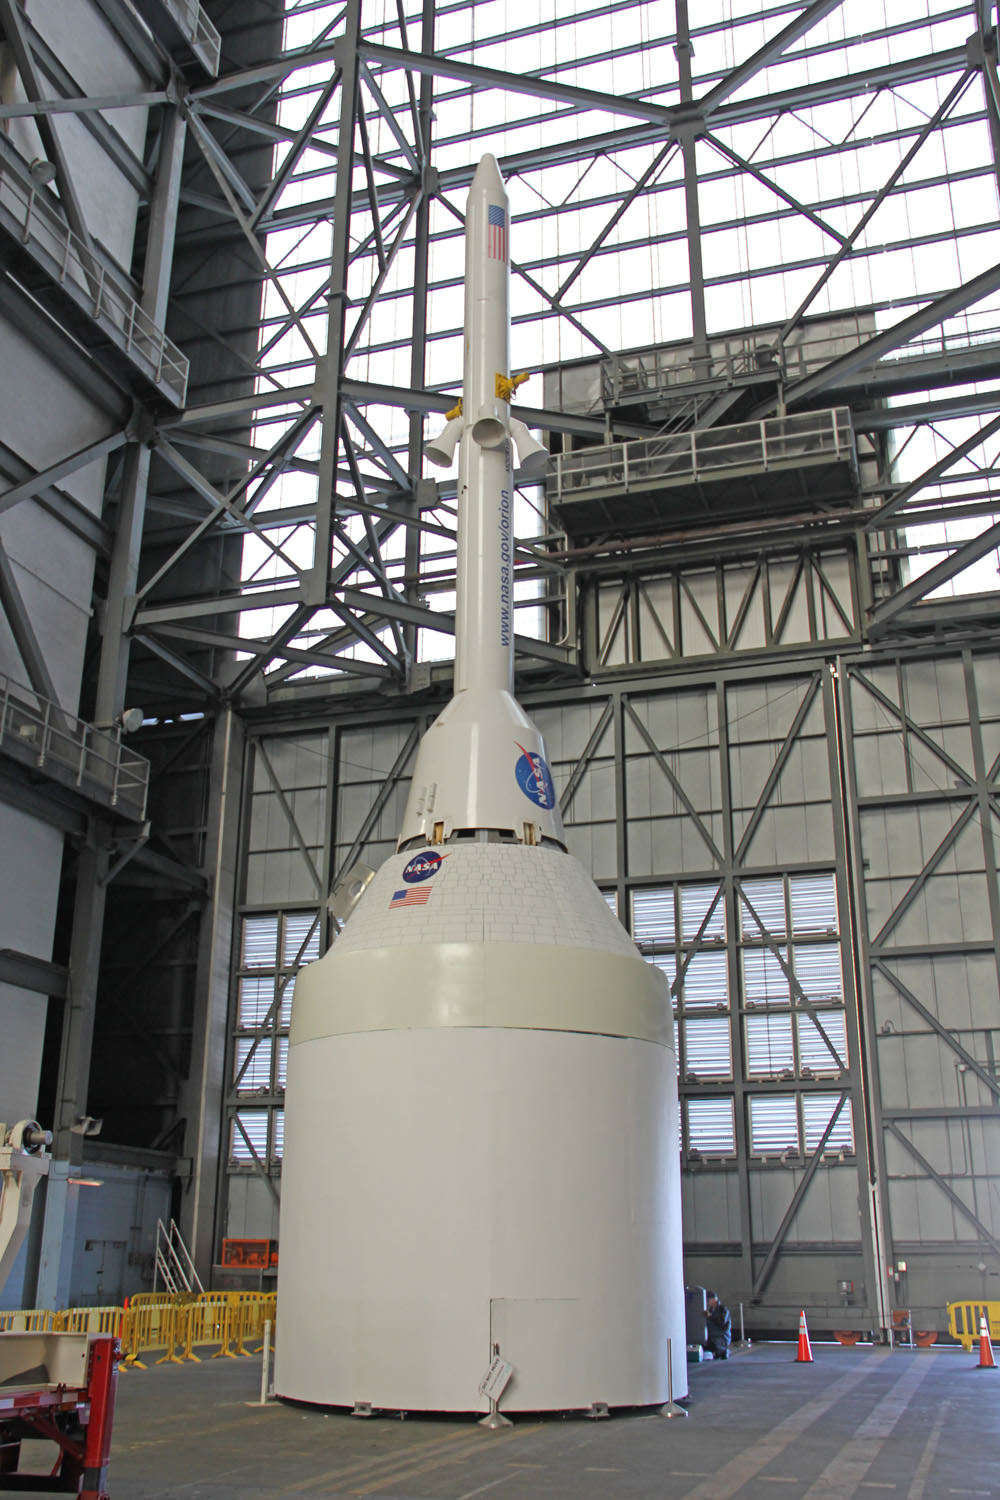
Orion crew capsule, Service Module and 6 ton Launch Abort System (LAS) mock up stack inside the transfer aisle of the Vehicle Assembly Building (VAB) at the Kennedy Space Center (KSC) in Florida. Credit: Ken Kremer/kenkremer.com
All that remains of Constellation is the Orion crew module – which was expressly designed to send US astronauts to the Moon and other deep space destinations such as Asteroids and Mars.
NASA hopes to launch a manned Orion capsule atop the new SLS booster on a flight to circle the moon as part of its first crewed mission around 2021 – depending on the budget.
The first Orion capsule will launch on an unmanned Earth orbiting test flight dubbed EFT-1 in mid-September 2014.
However, given the near total lack of reaction from the US political establishment to China’s extremely impressive Chang’e-3 feat and the continuing slashes to NASA’s budget, the outlook for a change in official US Moon policy is certainly not promising.
China and its political leadership – in stark contrast – are clearly thinking long term and has some very practical goals for the proposed lunar base.
“After the future establishment of the lunar base, mankind will conduct energy reconnaissance on the moon, set up industrial and agricultural production bases, make use of the vacuum environment to produce medicines,” Zhang explained according to the People’s Daily.
“I believe that in 100 years, humans will actually be able to live on another planet,” said Zhang.
China also seems interested in international cooperation based on another recent story in the People Daily.
“We are willing to cooperate with all the countries in the world, including the United States and developing countries,” said Xu Dazhe, the new chief of China’s space industry and newly promoted to head the China National Space Administration.
Xu made his remarks at the International Space Exploration Forum held at the US State Department.
However, since 2011, NASA has been banned by official US law from cooperating with China on space projects.
China is wisely taking a step by step approach in its Lunar Exploration programs leading up to the potential manned lunar landing.
With China’s lunar landing architecture now proven by the outstanding success of Chang’e-3, a production line can and has already been set up that will include upgrades potentially leading to the manned mission.
The already approved Chang’e-5 lunar sample return mission is due to liftoff in 2017 and retrieve up to 2 kilograms of pristine rocks and soil from the Moon.
After the completion of the Chang’e-5 mission, the lunar exploration program and the manned space program will be combined to realize a manned lunar landing, Zhang explained according to the People’s Daily.
Meanwhile China is forging ahead with their manned space program. And no one should doubt their resolve.
In 2013 they launched a three person crew to China’s Tiangong-1 space station, reaping valuable technological experience pertinent to manned spaceflight including lunar missions.
By contrast, the US has been forced to rely 100% on the Russian’s to launch American astronauts to the ISS since the forced shutdown of NASA’s space shuttle orbiters in 2011.
China is only the 3rd country in the world to successfully soft land a spacecraft on Earth’s nearest neighbor after the United States and the Soviet Union.
Stay tuned here for Ken’s continuing Chang’e-3, Orbital Sciences, SpaceX, commercial space, LADEE, Mars and more news.
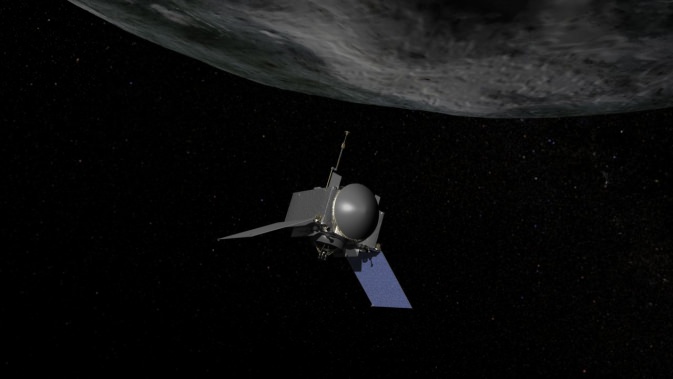
This is an artist's concept of NASA's OSIRIS-REx spacecraft preparing to take a sample from asteroid Bennu. Credit:
NASA/Goddard/Chris Meaney
NASA and the Planetary Society are teaming up to give everyone the opportunity tag along on the next mission to an asteroid … well, your name can go along on the trip, anyway! You can submit your name to be added on to a microchip that will be aboard the Origins-Spectral Interpretation Resource Identification Security Regolith Explorer (OSIRIS-REx) spacecraft, which will launch to the asteroid Bennu in 2016 and arrive in 2018.
“We’re thrilled to be able to share the OSIRIS-REx adventure with people across the Earth, to Bennu and back,” said Dante Lauretta, principal investigator of the OSIRIS-REx mission from the University of Arizona in Tucson. “It’s a great opportunity for people to get engaged with the mission early and join us as we prepare for launch.”
The spacecraft will spend more than two years at the 1,760-foot (500-meter)-wide asteroid. The spacecraft will collect a sample of Bennu’s surface and return it to Earth in 2023 in a sample return capsule.
The “Messages to Bennu!” microchip will travel to the asteroid on the spacecraft, and once the sample return capsule deploys, the spacecraft will be placed into a long-term solar orbit around the Sun, along with the microchip and every name on it.
You can submit your name at this website. The deadline is September 30, 2014.
After you submit your name, you can download and print a certificate.
“You’ll be part of humankind’s exploration of the solar system — How cool is that?” said Bill Nye, chief executive officer of The Planetary Society.
Participants who “follow” or “like” the mission on Facebook will receive updates on the location of their name in space from launch time until the asteroid samples return to Earth. Facebook fans also will be kept apprised of mission progress and late-breaking news through regular status updates.
The OSIRIS-REx mission goal is to address basic questions about the composition of the very early solar system, the source of organic materials and water that made life possible on Earth, and to better predict the orbits of asteroids that represent collision threats to the Earth. It will collect a minimum of 2 ounces (60 grams) of surface material.
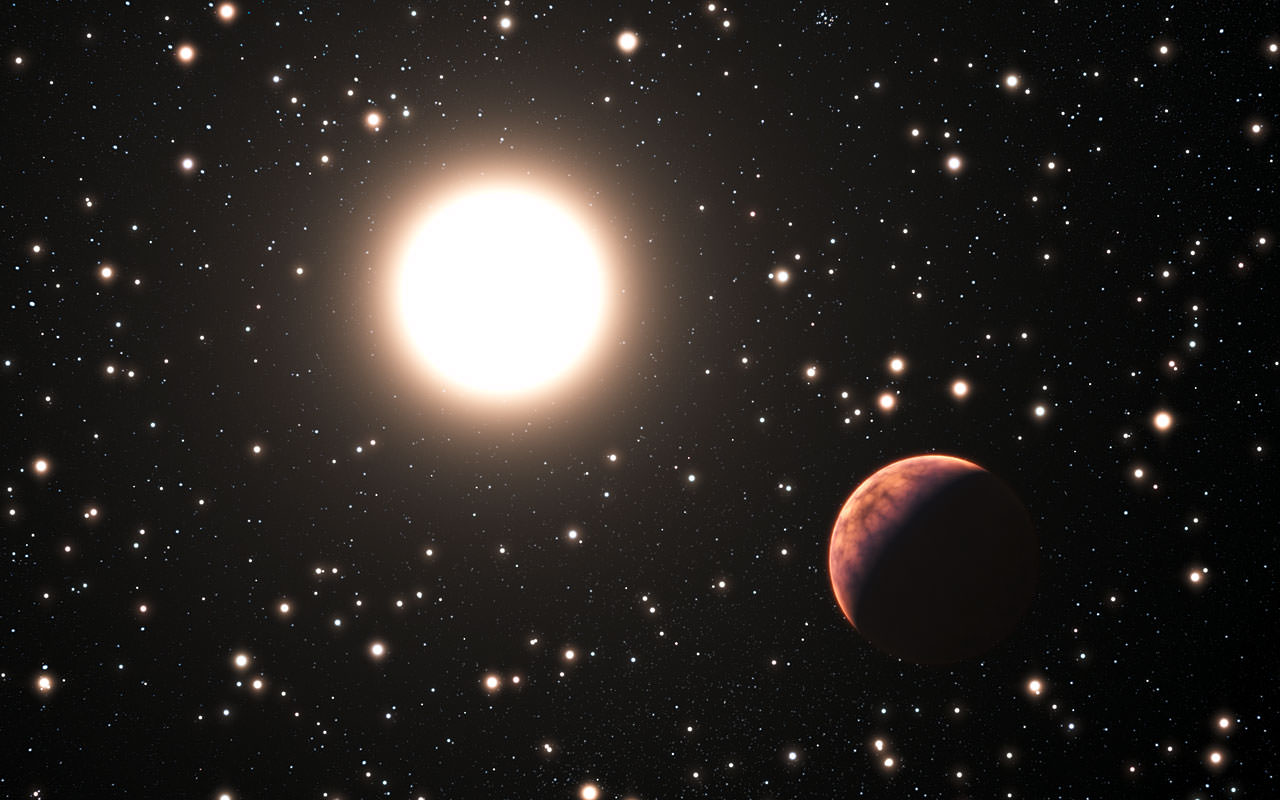
This artist's impression shows one of the three newly discovered planets in the star cluster Messier 67. In this cluster the stars are all about the same age and composition as the Sun. ESO/L. Calcada.
So far, just a handful of planets have been found orbiting stars in star clusters – and actually, astronomers weren’t too surprised about that. Star clusters can be pretty harsh places with hordes of stars huddling close together, with strong radiation and harsh stellar winds stripping planet-forming materials from the region.
But it turns out that perhaps astronomers are beginning to think differently about star clusters as being a homey place for exoplanets.
Scientists using several different telescopes, including the HARPS planet hunter in Chile have now discovered three planets orbiting stars in the cluster Messier 67.
“These new results show that planets in open star clusters are about as common as they are around isolated stars — but they are not easy to detect,” said Luca Pasquini from ESO, who is a co-author of a new paper about these planets. “The new results are in contrast to earlier work that failed to find cluster planets, but agrees with some other more recent observations. We are continuing to observe this cluster to find how stars with and without planets differ in mass and chemical makeup.”
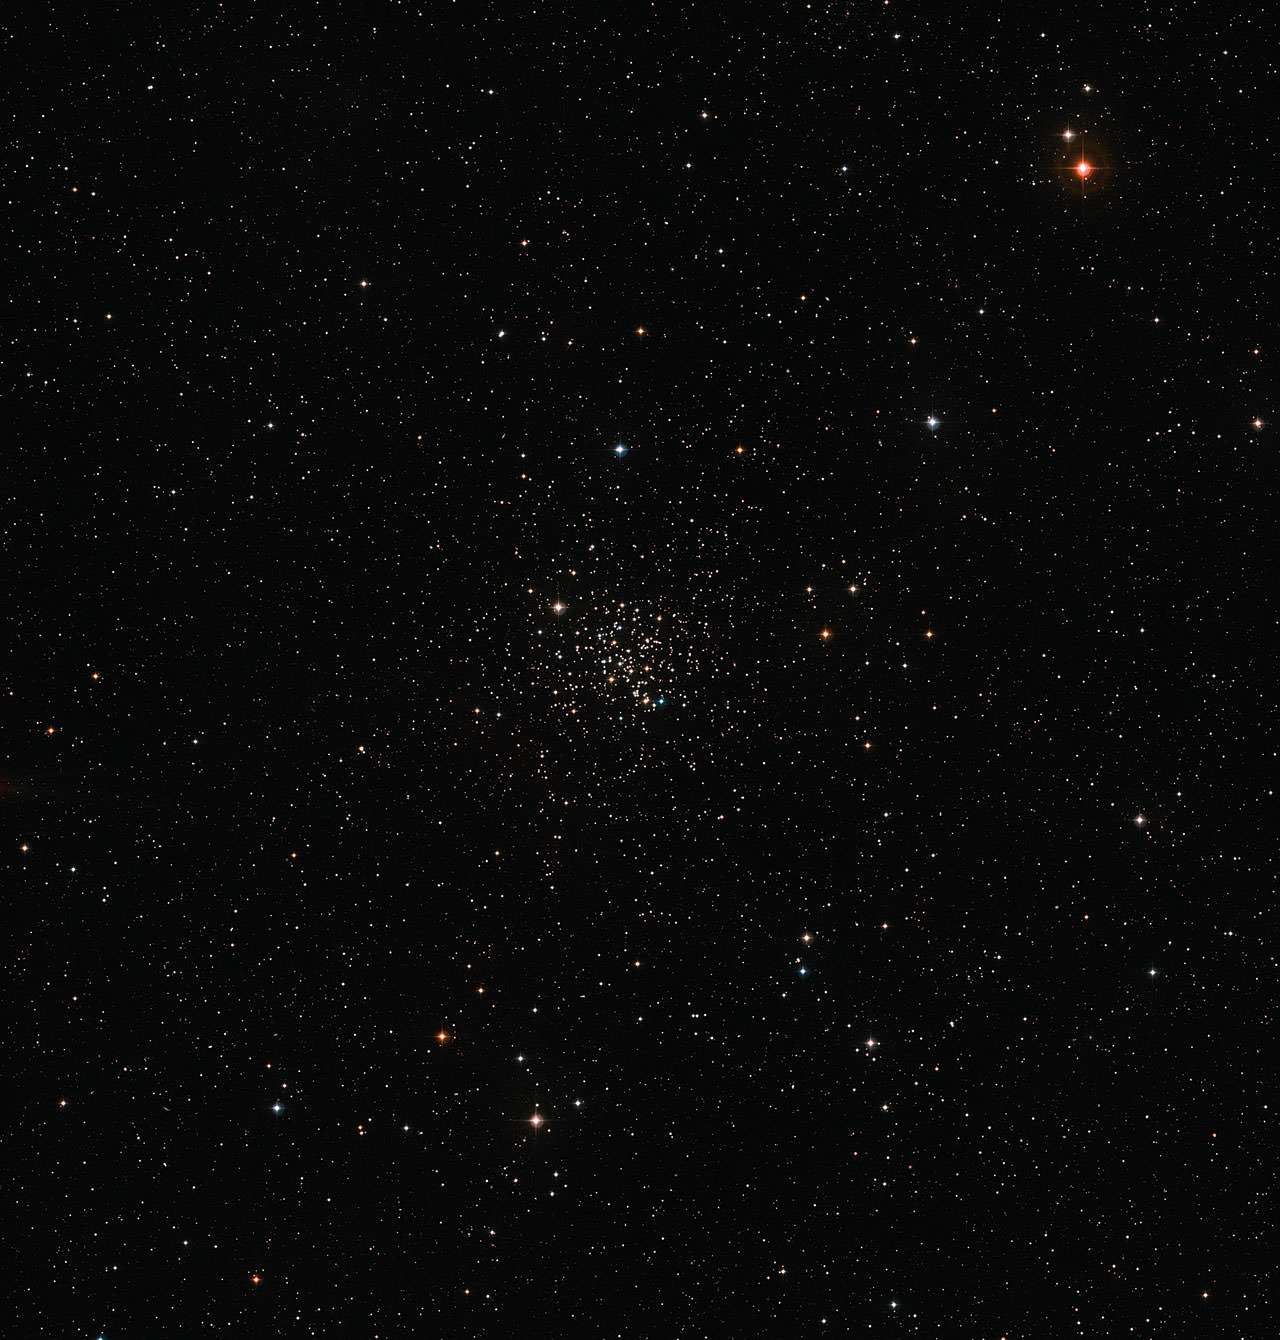
This wide-field image of the sky around the old open star cluster Messier 67 was created from images forming part of the Digitized Sky Survey 2. The cluster appears as a rich grouping of stars at the centre of the picture. Messier 67 contains stars that are all about the same age, and have the same chemical composition, as the Sun. Credit: ESO/Digitized Sky Survey 2. Acknowledgement: Davide De Martin.
The astronomers are pretty excited about one of these planets in particular, as it orbits a star that is a rare solar twin — a star that is almost identical to our Sun in all respects. This is the first “solar twin” in a cluster that has been found to have a planet.
“In the Messier 67 star cluster the stars are all about the same age and composition as the Sun,” said Anna Brucalassi from the Max Planck Institute for Extraterrestrial Physics in Garching, Germany and lead author of the new paper on these planets. “This makes it a perfect laboratory to study how many planets form in such a crowded environment, and whether they form mostly around more massive or less massive stars.”
This cluster lies about 2,500 light-years away in the constellation of Cancer and contains about 500 stars. Many of the cluster stars are fainter than those normally targeted for exoplanet searches and trying to detect the weak signal from possible planets pushed HARPS to the limit, the team said.
They carefully monitored 88 selected stars in Messier 67 over a period of six years to look for the tiny telltale “wobbling” motions of the stars that reveal the presence of orbiting planets.
Three planets were discovered, two orbiting stars similar to the Sun and one orbiting a more massive and evolved red giant star. Two of the three planets are “hot Jupiters” — planets comparable to Jupiter in size, but much closer to their parent stars and therefore not in the habitable zone where liquid water could exist.
The first two planets both have about one third the mass of Jupiter and orbit their host stars in seven and five days respectively. The third planet takes 122 days to orbit its host and is more massive than Jupiter.
Star clusters come in two main types: open and globular. Open clusters are groups of stars that have formed together from a single cloud of gas and dust in the recent past, and are mainly found in the spiral arms of a galaxy like the Milky Way. Globular clusters are much bigger spherical collections of much older stars that orbit around the center of a galaxy. Despite careful searches, no planets have been found in a globular cluster and less than six in open clusters.
Another study last year from a team using the Kepler telescope found two planets in a dense open star cluster and the team stated that how planets can form in the hostile environments of dense star clusters is “not well understood, either observationally or theoretically.”
Exoplanets have been found in some amazing environments, and astronomers will continue to hunt for planets in these clusters of stars to try and learn more about how and why — and how many — exoplanets exist in star clusters.
A closeup look at sunspot AR1944 on January 6, 2013, comparing its size to Earth. Credit and copyright: Ron Cottrell.
The team from Slooh will broadcast a live Solar special focusing on the sudden emergence of hyperactivity on the Sun — lately attributed sunspot AR 1944. Right now, the Sun is in what is supposed to be the active phase of its 11-year solar cycle, Solar Cycle 24. While this has been an unusually quiet solar maximum, lately the Sun has been more active.
The broadcast will feature live feeds of the Sun from the Prescott Observatory run by Matt Francis and Slooh astronomer Bob Berman. They will provide live expert commentary during the 30 minute broadcast. The Solar Special will start at 10:00 AM PST/ 1:00 PM EST/ 18:00 UTC on Wednesday, January 15th.
You can watch live, below, or the replay if you missed it live:
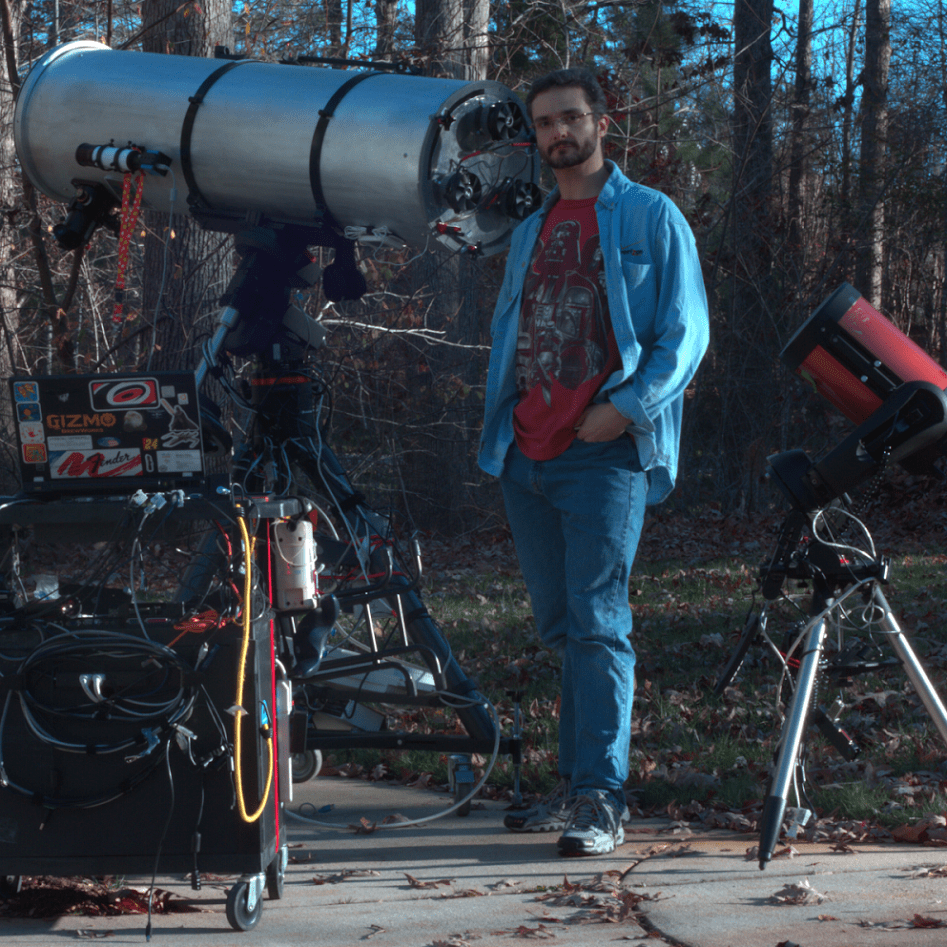
Astrophotographer Michael Phillips with the gear used to capture the Jupiter rotation animation. Credit-Michael Phillips
It’s always a thrill to watch the action at Jupiter, as its moons pass in front of and behind the gas giant planet. We wrote recently about this month’s opposition of Jove on January 5th, marking the start of the Jupiter evening viewing season for 2014.
Astrophotographer Michael A. Philips also recently undertook a challenging series of sequences of Jupiter and its moons Io and Ganymede, with stunning results. You can see the motion of Jupiter’s rotation, the Great Red Spot and even a bit of cloud swirl as Io disappears behind Jupiter and Ganymede begins to transit in front and cast a shadow back onto the Jovian cloud tops.
Concerning the capture, Michael wrote on his blog:
“This night was a lucky night. I had not looked at the weather forecast enough to know if it would be good or not. Cold temps aside, I decided earlier in the day to set up and go out with the 14” f/4.5 scope named Akule. As an added bonus, Mitchell Duke tipped me off to a transit of the Jovian moon, Ganymede.”
Note that Jupiter and its moons are currently casting their shadows nearly straight back from our perspective. Expect that to change, however, in the coming months,as Jupiter heads towards eastern dusk quadrature on April 1st and we see the action from a sideways angle. Watch the video in full screen mode and you’ll note that Mike captured some detail on the surface of Ganymede as well! Generally, at the eyepiece, the moons of Jupiter disappear entirely due to low contrast against the bulk of the planet, with only the black dot of the shadow seen… this video capture gives the ingress of Ganymede at the start of the transit a great 3-D appearance.
Webcam imaging of planets has really taken off in the past decade, with backyard astronomers now routinely capturing images that far surpass professional and textbook images from just a decade prior. Great images can be taken using nothing more than a telescope, a laptop, free image stacking software such as Registax, and a webcam converted to fit into an eyepiece holder… you may find that you’ve got the gear sitting around to image Jupiter, tonight.
Mr. Phillips rig, however, is a little more advanced. He notes in the description of the video that he’s using a Flea3 camera from PointGrey Research with a 5x Barlow lens yielding a 9200mm focal length. He’s also shooting at 120 frames per second, and taking successive red, green and blue images for 30 seconds. Finally, a derotation of Jupiter – yes, it really rotates that quickly, even in a short sequence – is accomplished using a sophisticated program named WINJupos.
Video stacking gives processors the ability to “freeze” and nab the best moments of seeing from thousands of frames. Some imagers hand select frames one by one, though many programs, such as Registax, use algorithms to nab the best frames from a preselected percentage of the total shot.
Local seeing conditions also play a key role in image capturing.
“I moved far away from the house as possible, and I think that helped some,” Michael noted. “I also started cooling the spit out of the mirror, aggressively. Even when cooled for a few hours in the winter, the heat in the Pyrex mirror comes back. I think there’s a small heat engine inside the beast!”
For best results, imagers tend to go after planets when they’re at their highest in the sky, and viewed through the least amount of turbulent atmosphere. This is when a planet is transiting the local north to south meridian, and when it’s at opposition, which Jupiter is this month. At opposition, a planet transits at local midnight. The same goes for the best opportunities for visual observing as well.
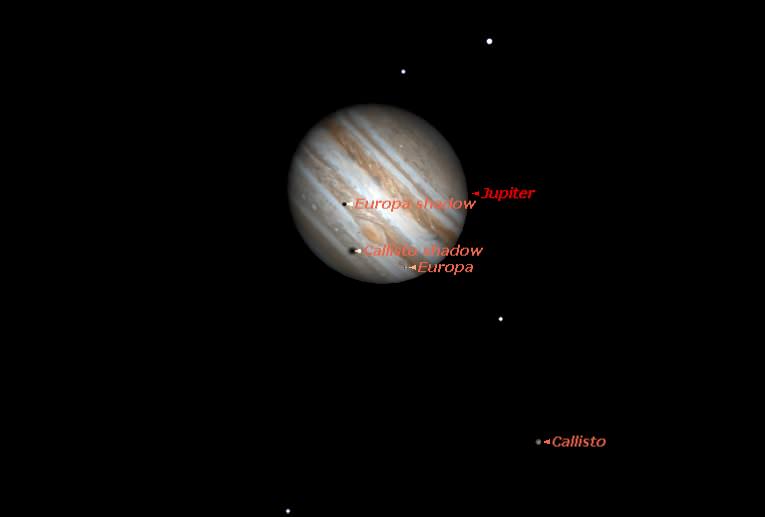
Shadow transits of Jupiter’s moons are also just plain fun to watch. In an often unchanging universe, they offer a chance to see something unfolding in real time. Jupiter has the fastest rotation of any planet at 9.9 hours, and the large Galilean moons of Io, Europa, Ganymede and Callisto are tidally locked in their rotation, keeping one hemisphere permanently turned towards Jupiter like the Moon does orbiting the Earth. The inner three moons also keep a 1:2:4 orbital resonance, assuring you’ll never see more than three of the four Galilean moons transiting from your line of sight at once. You can see two of the inner three moons, plus Callisto in transit, but never all four at the same time! A triple transit last occurred on October 12th, 2013, and will next occur for observers in eastern Europe and Africa this year on June 3rd.
We’re also currently in the midst of a series of shadow transits for the outermost Galilean moon Callisto, which end in July 2016. Can you identify the different moons by the size and hue of shadows they cast? Sky & Telescope publishes a great table for the ingress and egress of Jupiter’s moons. You can also check them out using the freeware program Stellarium.
The double shadow transit of February 6th as seen at 11:22 UT. Created by the author using Starry Night Education software.
Can’t wait that long? A double shadow transit involving Europa and Callisto occurs in just a few weeks for western North America from 10:20 UT-12:44UT on the morning of February 6th, a chance for another stunning animation sequence…
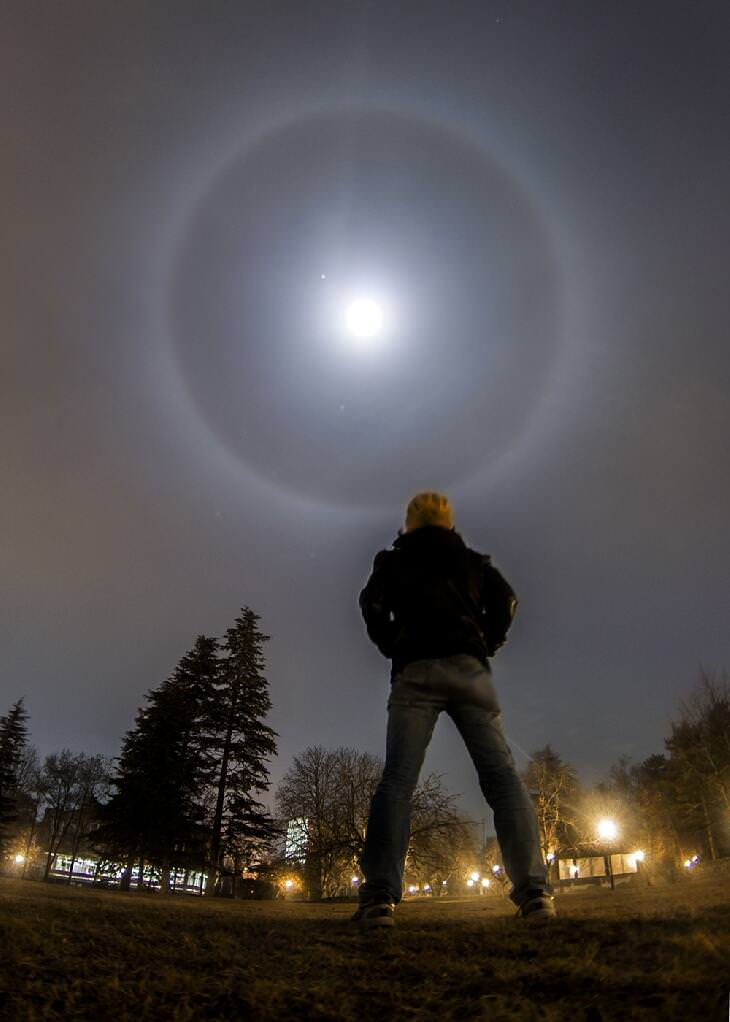
Gorgeous shot of the Moon-Jupiter conjunction on January 14, 2014 and a beautiful lunar halo, as seen from Ankara, Turkey. Credit and copyright: M. Ra?id Tu?ral
Last night, the Moon and Jupiter snuggled up together in the evening sky, passing within 4°51′ of each other. Folks in Ankara, Turkey got an added benefit to the conjunction, a gorgeous lunar halo. This shot by M. Rasid Tugral is just lovely. The duo stayed together through the night, and you MUST see below for another awesome view of the conjunction at dawn as seen from Pennsylvania in the US:
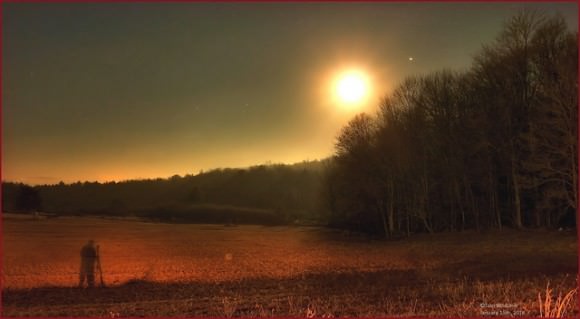
The morning’s setting Moon and Jupiter, on January 15th, 2014. Photo taken near White Haven, Pennsylvania. Credit and copyright: Tom Wildoner.
So many things make this such a great photo: the conjunction, of course, but the colors, the shadow of the photographer, and the landscape all combine for a simply stunning image.
Thanks to both of our photographers for sharing, and you can always see more great astrophotos at our Flickr page.
If you’re looking for more conjunctions with the Moon, there are a couple coming up: On Wednesday, Jan 22, 2014 mars will be near the Moon, and on Saturday January 25, 2014 the Moon will meet up with Saturn. Find out more at In-The-Sky.org.
Want to get your astrophoto featured on Universe Today? Join our Flickr group or send us your images by email (this means you’re giving us permission to post them). Please explain what’s in the picture, when you took it, the equipment you used, etc.