Host: Fraser Cain
Guests: David Dickinson, Amy Shira Teitel, Jason Major, Nicole Gugliucci
Continue reading “Weekly Space Hangout – December 13, 2013 – Europa’s Water Jets and Chinese Lunar Lander”
When Is a Star Not a Star?
When it’s a brown dwarf — but where do we draw the line?
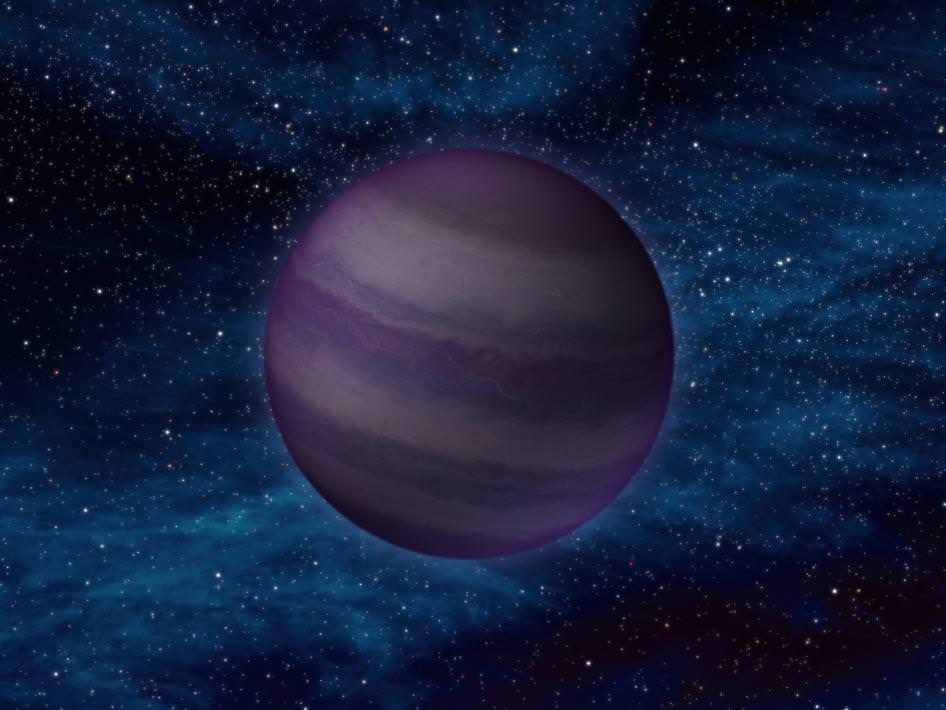
Often called “failed stars,” brown dwarfs are curious cosmic creatures. They’re kind of like swollen, super-dense Jupiters, containing huge amounts of matter yet not quite enough to begin fusing hydrogen in their cores. Still, there has to be some sort of specific tipping point, and astronomers (being the scientists that they are) would like to know: when does a brown dwarf stop and a star begin?
Researchers from Georgia State University now have the answer.
From a press release issued Dec. 9 from the National Optical Astronomy Observatory (NOAO):
For most of their lives, stars obey a relationship referred to as the main sequence, a relation between luminosity and temperature – which is also a relationship between luminosity and radius. Stars behave like balloons in the sense that adding material to the star causes its radius to increase: in a star the material is the element hydrogen, rather than air which is added to a balloon. Brown dwarfs, on the other hand, are described by different physical laws (referred to as electron degeneracy pressure) than stars and have the opposite behavior. The inner layers of a brown dwarf work much like a spring mattress: adding additional weight on them causes them to shrink. Therefore brown dwarfs actually decrease in size with increasing mass.
Read more: The Secret Origin Story of Brown Dwarfs
As Dr. Sergio Dieterich, the lead author, explained, “In order to distinguish stars from brown dwarfs we measured the light from each object thought to lie close to the stellar/brown dwarf boundary. We also carefully measured the distances to each object. We could then calculate their temperatures and radii using basic physical laws, and found the location of the smallest objects we observed (see the attached illustration, based on a figure in the publication). We see that radius decreases with decreasing temperature, as expected for stars, until we reach a temperature of about 2100K. There we see a gap with no objects, and then the radius starts to increase with decreasing temperature, as we expect for brown dwarfs. “
Dr. Todd Henry, another author, said: “We can now point to a temperature (2100K), radius (8.7% that of our Sun), and luminosity (1/8000 of the Sun) and say ‘the main sequence ends there’ and we can identify a particular star (with the designation 2MASS J0513-1403) as a representative of the smallest stars.”
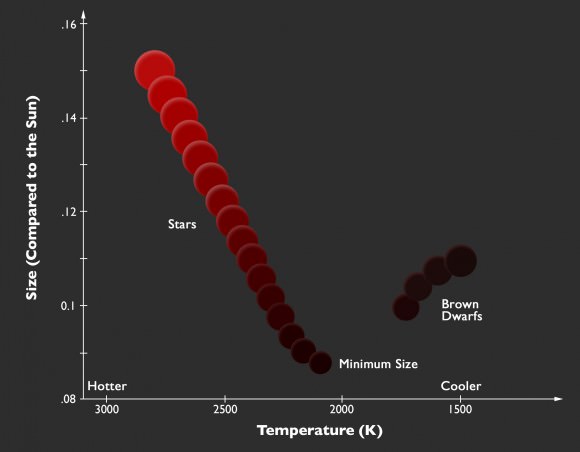
“We can now point to a temperature (2100K), radius (8.7% that of our Sun), and luminosity (1/8000 of the Sun) and say ‘the main sequence ends there’.”
Dr. Todd Henry, RECONS Director
Aside from answering a fundamental question in stellar astrophysics about the cool end of the main sequence, the discovery has significant implications in the search for life in the universe. Because brown dwarfs cool on a time scale of only millions of years, planets around brown dwarfs are poor candidates for habitability, whereas very low mass stars provide constant warmth and a low ultraviolet radiation environment for billions of years. Knowing the temperature where the stars end and the brown dwarfs begin should help astronomers decide which objects are candidates for hosting habitable planets.
The data came from the SOAR (SOuthern Astrophysical Research) 4.1-m telescope and the SMARTS (Small and Moderate Aperture Research Telescope System) 0.9-m telescope at the Cerro Tololo Inter-American Observatory (CTIO) in Chile.
Read more here.
Why Our Universe is Not a Hologram

Editor’s note: This article was originally published by Brian Koberlein on G+, and it is republished here with the author’s permission.
There’s a web post from the Nature website going around entitled “Simulations back up theory that Universe is a hologram.” It’s an interesting concept, but suffice it to say, the universe is not a hologram, certainly not in the way people think of holograms. So what is this “holographic universe” thing?
It all has to do with string theory. Although there currently isn’t any experimental evidence to support string theory, and some evidence pointing against it, it still garners a great deal of attention because of its perceived theoretical potential. One of the theoretical challenges of string theory is that it requires all these higher dimensions, which makes it difficult to work with.
In 1993, Gerard t’Hooft proposed what is now known as the holographic principle, which argued that the information contained within a region of space can be determined by the information at the surface that contains it. Mathematically, the space can be represented as a hologram of the surface that contains it.
That idea is not as wild as it sounds. For example, suppose there is a road 10 miles long, and its is “contained” by a start line and a finish line. Suppose the speed limit on this road is 60 mph, and I want to determine if a car has been speeding. One way I could do this is to watch a car the whole length of the road, measuring its speed the whole time. But another way is to simply measure when a car crosses the start line and finish line. At a speed of 60 mph, a car travels a mile a minute, so if the time between start and finish is less than 10 minutes, I know the car was speeding.
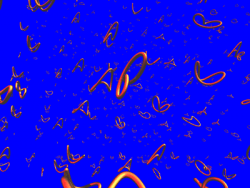
The holographic principle applies that idea to string theory. Just as its much easier to measure the start and finish times than constantly measure the speed of the car, it is much easier to do physics on the surface hologram than it is to do physics in the whole volume. The idea really took off when Juan Martín Maldacena derived what is known as the AdS/CFT correspondence (an arxiv version of his paper is here ), which uses the holographic principle to connect the strings of particle physics string theory with the geometry of general relativity.
While Maldacena made a compelling argument, it was a conjecture, not a formal proof. So there has been a lot of theoretical work trying to find such a proof. Now, two papers have come out (here and here) demonstrating that the conjecture works for a particular theoretical case. Of course the situation they examined was for a hypothetical universe, not a universe like ours. So this new work is really a mathematical test that proves the AdS/CFT correspondence for a particular situation.
From this you get a headline implying that we live in a hologram. On twitter, Ethan Siegel proposed a more sensible headline: “Important idea of string theory shown not to be mathematically inconsistent in one particular way”.
Of course that would probably get less attention.
NASA Weighs Spacewalk To Fix Cooling Problem On Station
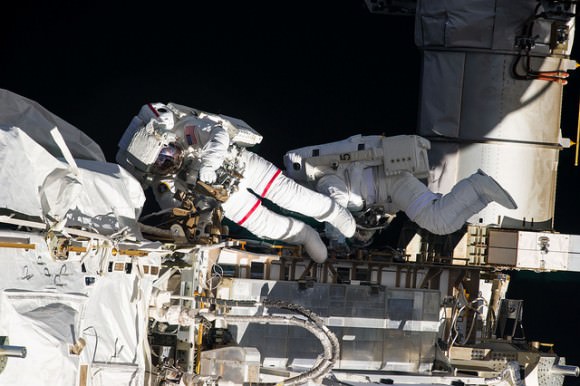
NASA may allow its first spacewalk since summer to deal with a malfunction that crippled a cooling loop on the International Space Station.
If extravehicular activity is deemed necessary for a fix, it would be the first time NASA spacesuits were used “outside” since Luca Parmitano, an Italian astronaut, experienced a water leak in one that cut short a spacewalk in July. NASA suspended all spacewalks as a precaution while the cause was investigated.
Since then, the agency has put in place procedures to protect astronauts from it happening again, opening up a spacewalk or spacewalks as an option to deal with a balky control valve inside a pump on the station.
The valve is an essential part of an S1 (starboard) truss pump that helps maintain the correct temperature for space station electronics. Ammonia circulates through two external cooling loops and is put through radiators to bleed off heat. The valve is required to mix the cool and warm parts of liquid in the ammonia loop.
A pump automatically shut down on Wednesday (Dec. 11) when the loop got too cold. As NASA began troubleshooting the issue, it powered down non-critical systems (including experiments and redundant systems) in the Columbus laboratory, Harmony node and Japanese Kibo laboratory. Primary systems are still online.
The astronauts are safe, NASA said today (Dec. 13), with the biggest impact to their activities being the science they perform. Expedition 38 astronaut Rick Mastracchio did a live media interview this morning (EST) where he similarly assured reporters that everyone on board is fine.
Cooling problems have happened on station before, most recently in May when an emergency spacewalk was needed to replace a pump controller box on the P6 (far port) truss. This particular cooling system experienced an issue in 2010, which required three contingency spacewalks to remove and replace a failed pump on the S1 truss.
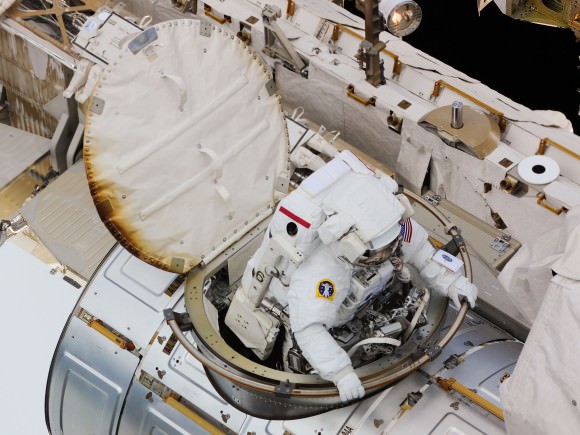
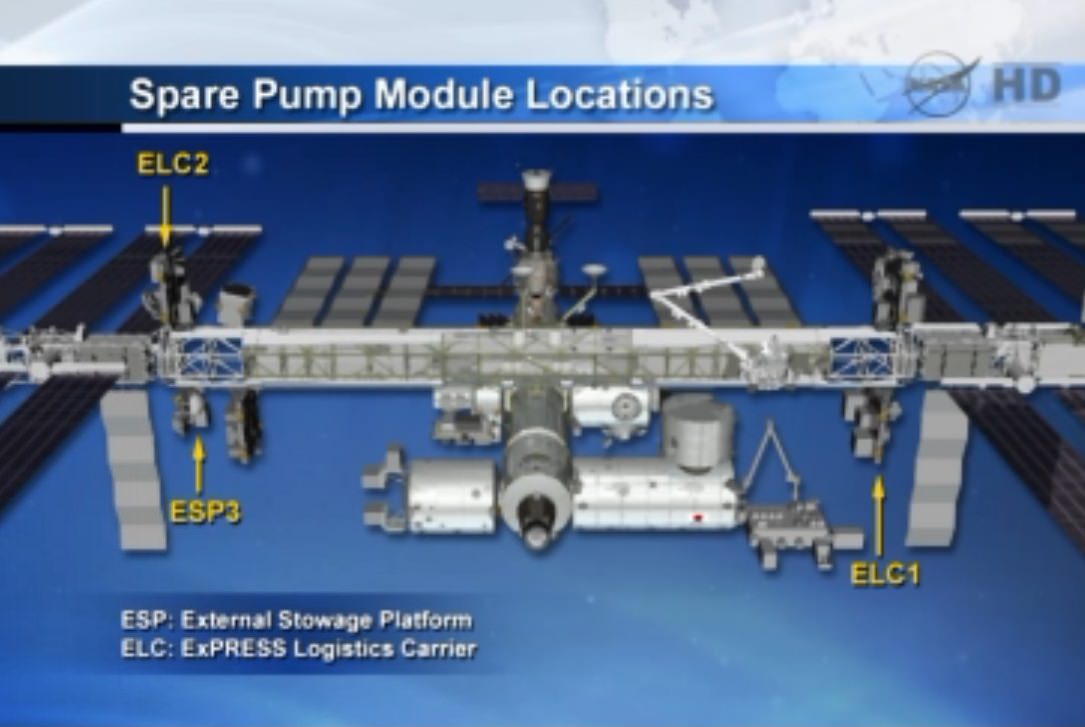
If a spacewalk is needed this time around, NASA has three spare pumps available on station for astronauts to use. NASA, however, is looking at all options before making a decision — including ways of controlling the errant valve from the ground. The agency is holding multiple meetings to decide what to do next after turning on and off the cooling loop yesterday and seeing the same malfunction.
On Monday, NASA will decide whether to move forward with a launch of a cargo spacecraft expected to head to the station on Dec. 18. The window for Orbital Sciences’ Cygnus spacecraft extends to Dec. 21 or 22, but as of Thursday (Dec. 12), the agency said the lack of redundant systems on station violates certain “commit criteria” for the launch to move forward.
While NASA spacewalks were suspended, activity using the Russian Orlan spacesuits has continued as usual. A spacewalk took place in November with the Olympic torch, amid other duties. Another spacewalk is planned Dec. 27 to install high- and medium-resolution cameras, put in a foot restraint, and remove and replace several external experiment packages.
This Picture Symbolizes The Changing Mission Of One Plucky Spacecraft
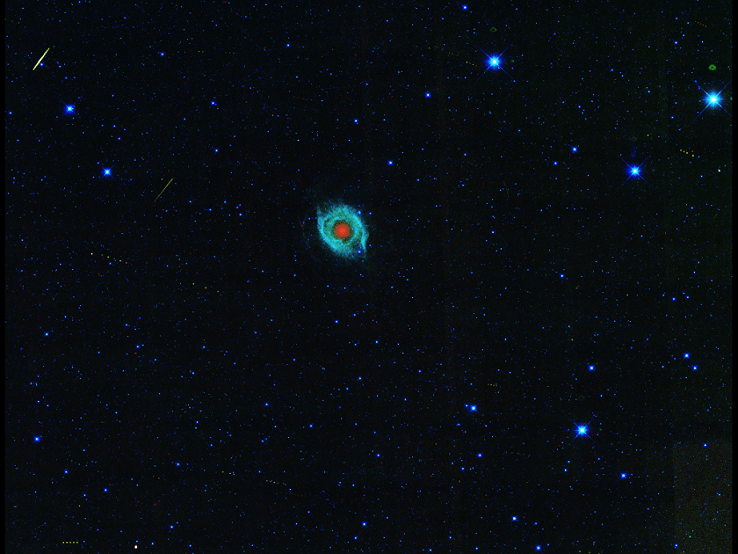
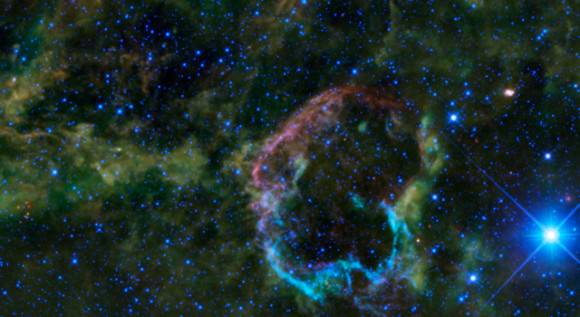
Besides being a darn pretty picture of the Helix nebula, this snapshot is a bit of symbolism for NASA. The spacecraft that nabbed this view is called the Wide-field Infrared Survey Explorer, or WISE. If you look very carefully — you may have to click on the picture for a closer view — you can see little dots showing the paths of asteroids in the picture. (The streaks are cosmic rays and satellites.)
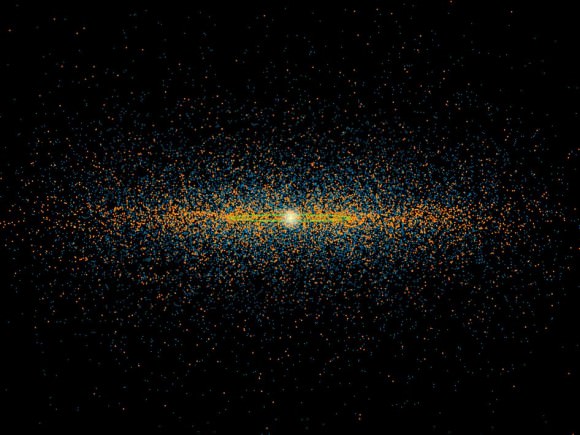
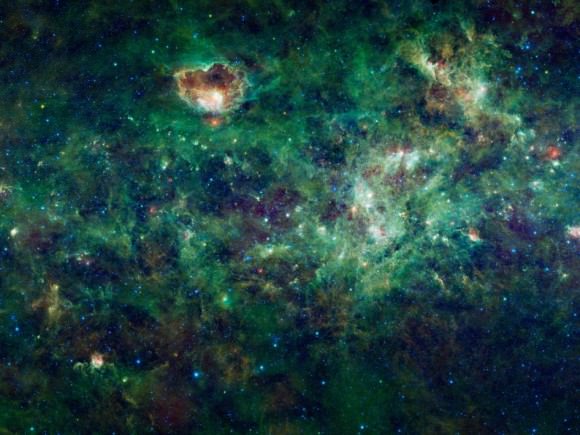
WISE has an interesting history. It began as a telescope seeking secrets of the universe in infrared light, but ran out of coolant in 2010 and was repurposed for asteroid searching under the NEOWISE mission. It wrapped up its mission, was put into hibernation in February 2011, then reactivated this August to look for asteroids again for at least the next three years. You can see some pictures and data WISE collected during its mission below the jump.
It’s a nice way, NASA said, to celebrate the fourth anniversary of WISE’s launch. “WISE is the spacecraft that keeps on giving,” said Ned Wright of UCLA, who was the principal investigator of WISE before it transitioned into NEOWISE.
Why Exoplanet-Hunting Is ‘Like Seeing A Flea In A Lightbulb’
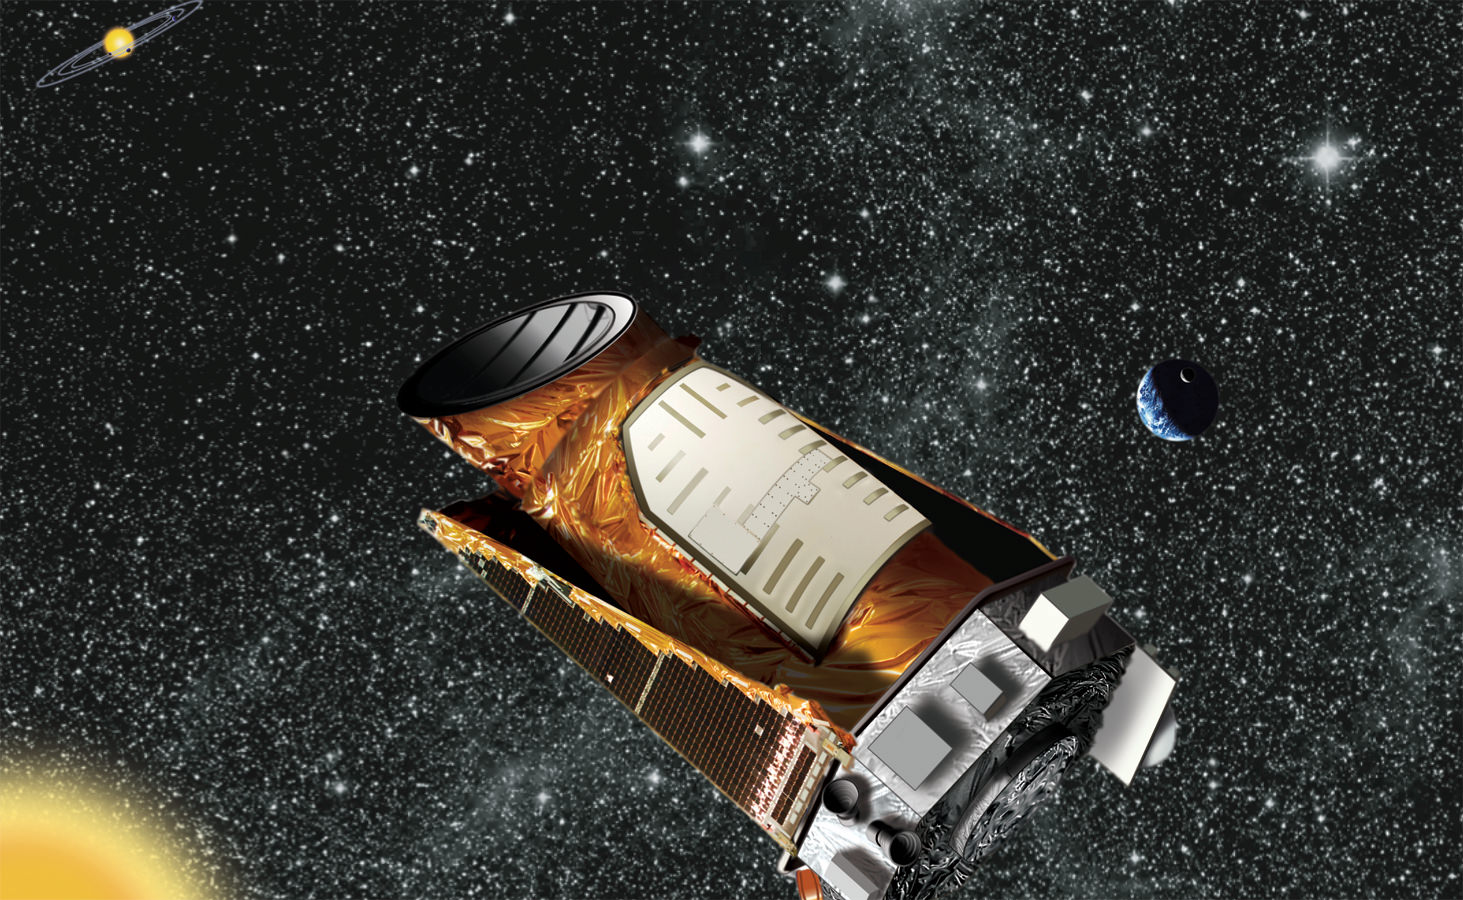
Exoplanets are really tiny compared to their host star, and it’s hard to imagine sometimes how astronomers can even find one of these worlds — let alone thousands of them. This nifty two-part series from PBS explains how it’s possible in an easy-to-understand and hilarious way. As an example, this is how they describe the Kepler space telescope’s capabilities:
“It can’t actually see those exoplanets because the stars that they surround are so big and bright. Instead, it looks for the tiny shadow of the planet as it passes in front of its parent star. If that sounds hard, that’s because it is. It’s like seeing a flea in a lightbulb in Los Angeles from New York City,” said host Joe Hanson in the video.
Near the end, he provides an interesting segway into the question of life beyond Earth: “The question we’re really interested in is not how common are planets, but how common are we.” That gets tackled in part 2 of the video, which you can see below the jump.
Remember that 2014 will be an interesting year for Kepler as NASA figures out what to do next with the observatory. It isn’t able to perform its primary mission (seeking exoplanets in Cygnus) because two of its four reaction wheels or pointing devices are malfunctioning. NASA, however, has an innovative fix on the books that could allow it to swing different fields of view during the year — check out this infographic for more details.
Fast Radio Bursts May Originate Closer to Home Than Previously Thought
Fast radio bursts — eruptions of extreme energy that occur only once and last a thousandth of a second — are continuing to defy astronomers. At first observations suggested they came from billions of light years away. A new study, however, points to sources much closer to home: nearby flaring stars.
“We have argued that fast radio burst sources need not be exotic events at cosmological distances, but rather could be due to extreme magnetic activity in nearby Galactic stars,” said Harvard professor Abraham Loeb in the study.
All radio bursts show a dispersion measure — a frequency dependent time delay — as the long-wavelength component arrives a fraction of a second after the short-wavelength component. When the burst travels through a medium, the long-wavelength component moves slightly slower than short-wavelength component.
This dispersion may easily be created when light travels through intergalactic space. The farther the light travels, the more electrons it will have to travel through, and the greater time delay between the arriving wavelength components.
With this assumption, fast radio bursts are likely to have originated anywhere from five to 10 billion light years away. Universe Today covered an extra-galactic origin a few months ago (read it here).
However, Loeb and his colleagues turned their eyes instead to electrons in stellar corona. These electrons are tightly packed, more so than diffuse intergalactic electrons, and would create the same observable effect.
Flaring stars — variable stars that can undergo unpredictable increases in brightness — are a likely source of fast radio bursts. Two circumstances may create flaring stars: young, low mass stars and solar-mass contact binaries, which orbit so close to one another that they share a common envelope.
In order to test this theory, Loeb and his colleagues searched the vicinities of three of the six known fast radio bursts for flaring stars.
“We were surprised that, apparently, no one had done this before,” said graduate student Yossi Shvartzvald in a press release. Shvartzvald led the observations at Tel-Aviv University’s Wise Observatory in Mitspe Ramon, Israel.
The team discovered a contact binary system in one location. Two sun-like stars orbit one another every 7.8 hours. They calculate a five percent chance that the contact binary is there by coincidence.
No flaring stars, however, were detected in the two other fields.
“Whenever we find a new class of sources, we debate whether they are close or far away,” Loeb said in a press release. Initially we thought gamma-ray bursts were faint stars within the Milky Way. Today we know they are bright explosions in distant galaxies.
It seems the distance debate for fast radio bursts has only begun.
The paper has been accepted for publication in the Monthly Notices of the Royal Astronomical Society and is available for download here. The original press release may be found here.
Argon – The First Noble Gas Molecules Discovered In Space
There are only six of them: radon, helium, neon, krypton, xenon and the first molecules to be discovered in space – argon. They are all odorless, colorless, monatomic gases with very low chemical reactivity. So where did a team of astronomers using ESA’s Herschel Space Observatory make their rather unusual discovery? Try Messier 1… The “Crab” Nebula!
In a study led by Professor Mike Barlow (UCL Department of Physics & Astronomy), a UCL research team was taking measurements of cold gas and dust regions of this famous supernova remnant in infrared light when they stumbled upon the chemical signature of argon hydrogen ions. By observing in longer wavelengths of light than can be detected by the human eye, the scientists gave credence to current theories of how argon occurs naturally.
“We were doing a survey of the dust in several bright supernova remnants using Herschel, one of which was the Crab Nebula. Discovering argon hydride ions here was unexpected because you don’t expect an atom like argon, a noble gas, to form molecules, and you wouldn’t expect to find them in the harsh environment of a supernova remnant,” said Barlow.
When it comes to a star, they are hot and ignite the visible spectrum. Cold objects like nebular dust are better seen in infrared, but there’s only one problem – Earth’s atmosphere interferes with the detection of that end of the electromagnetic spectrum. Even though we can see nebulae in visible light, what shows is the product of hot, excited gases, not the cold and dusty regions. These invisible regions are the specialty of Herschel’s SPIRE instruments. They map the dust in far-infrared with their spectroscopic observations. In this instance, the researchers were somewhat astounded when they found some very unusual data which required time to fully understand.
“Looking at infrared spectra is useful as it gives us the signatures of molecules, in particular their rotational signatures,” Barlow said. “Where you have, for instance, two atoms joined together, they rotate around their shared center of mass. The speed at which they can spin comes out at very specific, quantized, frequencies, which we can detect in the form of infrared light with our telescope.”
According to the news release, elements can exist in varying forms known as isotopes. These have different numbers of neutrons in the atomic nuclei. When it comes to properties, isotopes can be somewhat alike to each other, but they have different masses. Because of this, the rotational speed is dependent on which isotopes are present in a molecule. “The light coming from certain regions of the Crab Nebula showed extremely strong and unexplained peaks in intensity around 618 gigahertz and 1235 GHz.” By comparing data of known properties of different molecules, the science team came to the conclusion the mystery emission was the product of spinning molecular ions of argon hydride. What’s more, it could be isolated. The only argon isotope which could spin like that was argon-36! It would appear the energy released from the central neutron star in the Crab Nebula ionized the argon, which then combined with hydrogen molecules to form the molecular ion ArH+.
Professor Bruce Swinyard (UCL Department of Physics & Astronomy and Rutherford Appleton Laboratory), a member of the team, added: “Our discovery was unexpected in another way — because normally when you find a new molecule in space, its signature is weak and you have to work hard to find it. In this case it just jumped out of our spectra.”
Is this instance of argon-36 in a supernova remnant natural? You bet. Even though the discovery was the first of its kind, it is doubtless not the last time it will be detected. Now astronomers can solidify their theories of how argon forms. Current predictions allow for argon-36 and no argon-40 to also be part of supernova structure. However, here on Earth, argon-40 is a dominant isotope, one which is created through the radioactive decay of potassium in rocks.
Noble gas research will continue to be a focus of scientists at UCL. As an amazing coincidence, argon, along with other noble gases, was discovered at UCL by William Ramsay at the end of the 19th century! I wonder what he would have thought had he known just how very far those discoveries would take us?
Original Story Source: University College London (UCL) Press Release
New Flyover Video Takes You on a Tour of Titan’s Lake Region
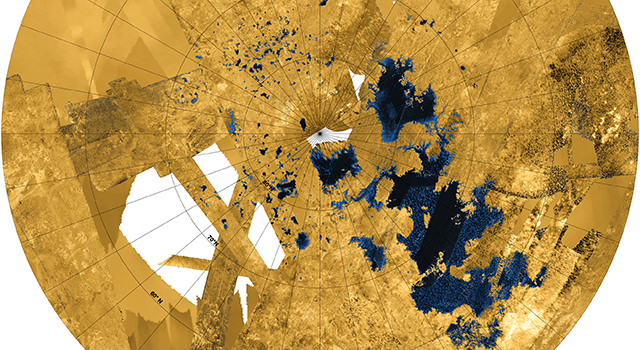
Saturn’s moon Titan has the only known liquid lakes beyond planet Earth, and new data from the Cassini spacecraft’s radar instrument provides an intriguing 3-D flyover of these hydrocarbon lakes and seas at the north pole region. Steve Wall, Cassini acting radar team lead, provided a guided tour as he presented the video at the American Geophysical Union conference in San Francisco, noting that the vertical heights are exaggerated tenfold and the data has been colorized, both for visual effect.
The video starts by zooming into the southern end of Kraken Mare, the largest of Titan’s seas, and as you fly a little farther, Wall said the things that look like little islands are just noise in the radar data. Next, comes Ligea Mare, with its rugged coastline, and you’ll see that the liquid flow into the surrounding terrain, which appear like river valleys.
The “smooth” area that stretches farther from Ligea Mare is actualy not so smooth, but is just an area when the science team doesn’t have topographical data yet.
The video then continues to other smaller lakes that are nestled into valleys and rugged terrain.
“Learning about surface features like lakes and seas helps us to understand how Titan’s liquids, solids and gases interact to make it so Earth-like,” said Wall. “While these two worlds aren’t exactly the same, it shows us more and more Earth-like processes as we get new views.”
The new data is not only visually stunning, but provides previously unknown details about these lakes and the region. For example, Kraken Mare is more extensive and complex than previously thought. They also show nearly all of the lakes on Titan fall into an area covering about 600 miles by 1,100 miles (900 kilometers by 1,800 kilometers). Only 3 percent of the liquid at Titan falls outside of this area.
“Scientists have been wondering why Titan’s lakes are where they are. These images show us that the bedrock and geology must be creating a particularly inviting environment for lakes in this box,” said Randolph Kirk, a Cassini radar team member at the U.S. Geological Survey in Flagstaff, Ariz. “We think it may be something like the formation of the prehistoric lake called Lake Lahontan near Lake Tahoe in Nevada and California, where deformation of the crust created fissures that could be filled up with liquid.”
Additionally, scientists now know that Ligeia Mare is about 560 feet (170 meters) deep. This is the first time scientists have been able to plumb the bottom of a lake or sea on Titan. This was possible partly because the liquid turned out to be very pure, allowing the radar signal to pass through it easily. The liquid surface may be as smooth as the paint on our cars, and it is very clear to radar eyes.
“Ligeia Mare turned out to be just the right depth for radar to detect a signal back from the sea floor, which is a signal we didn’t think we’d be able to get,” said Marco Mastrogiuseppe, a Cassini radar team associate at Sapienza University of Rome. “The measurement we made shows Ligeia to be deeper in at least one place than the average depth of Lake Michigan.”
The new results indicate the liquid is mostly methane, somewhat similar to a liquid form of natural gas on Earth.
Sources: AGU press conference, JPL press release
IRIS Glimpses an Elusive Region of the Sun
An innovative solar observatory is adding a key piece to the puzzle of the enigma that is our Sun.
Its two of key questions in heliophysics: why does our Sun have a corona? And why is the temperature of the corona actually higher than the surface of the Sun?
This week, researchers released results from the preliminary first six months of data from NASA’s Interface Region Imaging Spectrograph, known as IRIS. The findings were presented at the Fall American Geophysical Union Meeting this past Monday.
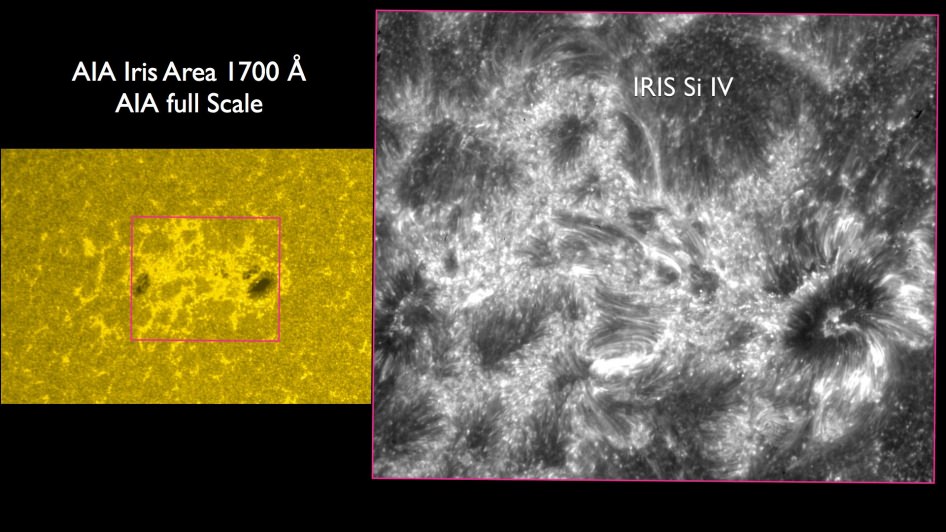
IRIS was launched on June 27th of this year on a Pegasus-XL rocket deployed from the belly of a Lockheed L-1011 aircraft flying out of Vandenberg Air Force Base. IRIS can focus in on a very specific interface region of the Sun sandwiched between the dazzling solar photosphere and the transition to the corona. To accomplish this, IRIS employs an ultraviolet slit spectrograph looking at ionized gas spectra.
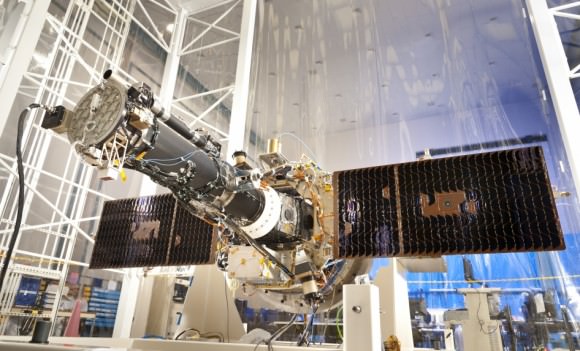
“The quality of images and spectra we are receiving is amazing,” IRIS Principal Investigator Alan Title said in a recent press release from the NASA Goddard Space Flight Center. While other missions may take over a decade to go from the drawing board to the launch pad, IRIS was developed and deployed into Low Earth Orbit in just 44 months.
IRIS offers scientists a new tool to probe the Sun and a complimentary instrument to platforms such as Hinode, the Solar Heliospheric Observatory (SOHO) and NASA’s Solar Dynamics Observatory. In fact, IRIS has a better resolution than SDO’s AIA imagers or Hinode when it comes to this key solar interface region. IRIS has a 20x greater resolution in time, and 25x the spatial resolution of any former space-based UV spectrometer deployed.
“We are seeing rich and unprecedented images of violent events in which gases are accelerated to very high velocities while being rapidly heated to hundreds of thousands of degrees,” said Lockheed Martin science lead on the IRIS mission Bart De Pontieu. These observations are key to backing up theoretical models of solar dynamics as well as testing and formulating new ones of how our Sun works.
IRIS bridges this crucial gap between the photosphere and the lower chromosphere of the Sun. While the solar surface roils at relatively placid 6,000 degrees Celsius, temperatures rise into the range of 2-3 million degrees Celsius as you move up through the transition region and into the corona.
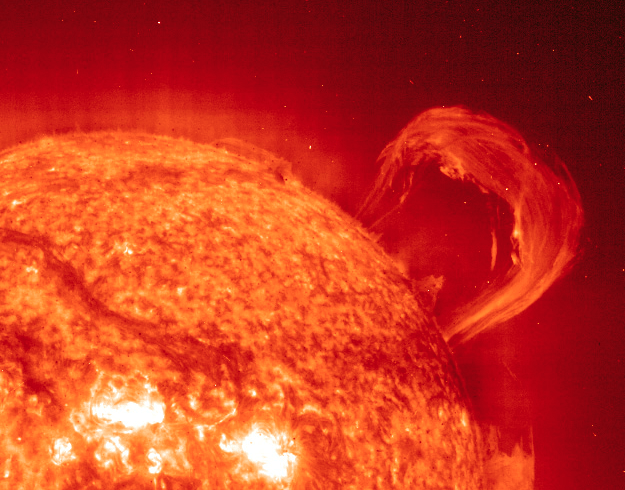
Two key solar phenomena that are of concern to solar researchers can be examined by IRIS in detail. One is the formation of prominences, which show up as long looping swirls of solar material rising up from the surface of the Sun. Prominences can be seen from backyard telescopes at hydrogen alpha wavelengths. IRIS can catch and track their early modeling with unprecedented resolution. Images released from IRIS show the fine structure of targeted prominences as they evolve and rise off the surface of the Sun. When a prominence and accompanying coronal mass ejection is launched in our direction, disruption of our local space environment caused by massive solar storm can result.
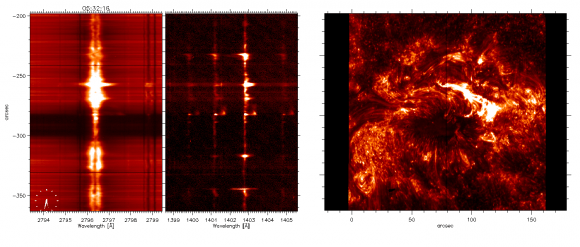
The second phenomenon targeted by IRIS is the formation of spicules, which are giant columns of gas rising from the photosphere. Although the spicules look like hair-fine structures through Earth-based solar telescopes, they can be several hundred kilometres wide and as long as the Earth. Short-lived, spicules race up from the surface of the Sun at up to 240,000 kilometres per hour and seem to play a key role in energy and heat transfer from the solar surface up through the atmosphere. IRIS is giving us a view of the evolution of spicules for the first time, and they’re proving to be even more complex than theory previously suggested.
“We see discrepancies between these observations and the models, and that is great news for advancing knowledge. By seeing something we don’t understand, we have a chance of learning something new,” Said University of Oslo astrophysicist Mats Carlsson.
Like SDO and SOHO, data and images from IRIS are free for the public to access online. Though the field of view for IRIS is a narrow 2’ to 4’ arc minutes on a side – the solar disk spans about 30’ as seen from the Earth – IRIS gives us a refined view of “where the action is.”
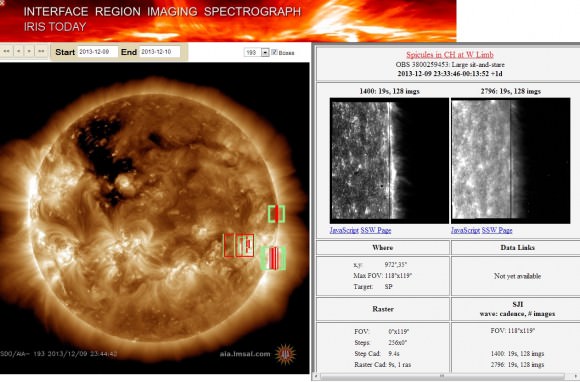
And this all comes at an interesting time, as our nearest star crosses the sputtering solar maximum for Cycle #24.
The equivalent of 50 million CPU hours were utilized in constructing and modeling what IRIS sees. The reconstruction was an international effort, spanning the Partnership for Advanced Computing in Europe, the Norwegian supercomputing collaboration, and NASA’s Ames Research Center.
IRIS also faced the additional challenge of weathering a 2.5 week period of inactivity due to the U.S. government shutdown this fall. Potential impacts due to sequestration remain an issue, though small explorer missions such as IRIS demonstrate how we can do more with less.
“We’ve made a giant step forward in characterizing the heat transfer properties of this region between the visible surface and the corona, which is key to understanding how the outer atmosphere of the Sun exists, and is key to understanding the outer atmosphere that the Earth lies in,” said Alan Title, referring to the tenuous heliosphere of the Sun extending out through the solar system.
Understanding the inner working of our Sun is vital: no other astronomical body has as big an impact on life here on Earth.
IRIS is slated for a two-year mission, though as is the case with most space-based platforms, researchers will work to get every bit of usefulness out of the spacecraft that they can. And it’s already returning some first-rate science at a relatively low production cost. This is all knowledge that will help us as a civilization live with and understand our often tempestuous star.

