Bright Venus Takes Center Stage in November

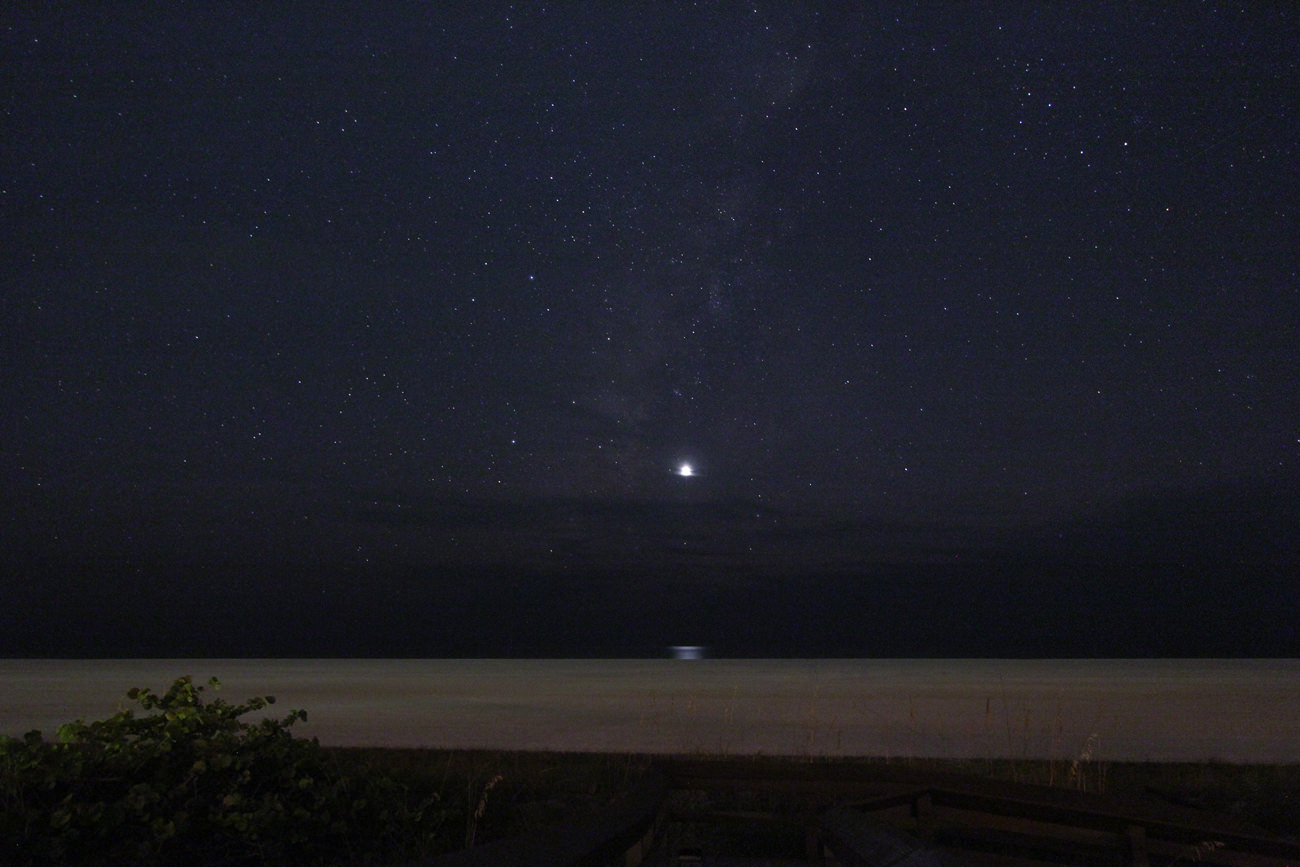
(Credit: Brian McGaffney/Nutwood Observatory).

“What’s that bright object to the southwest at dusk?” We’ve already fielded more than a few such questions as Earth’s sister world shines in the dusk sky.  Venus just passed its maximum elongation 47 degrees east of the Sun on November 1st, and currently shines at a brilliant magnitude -4.46. This is almost 16 times brighter than the brightest star in the sky, -1.46th magnitude Sirius.
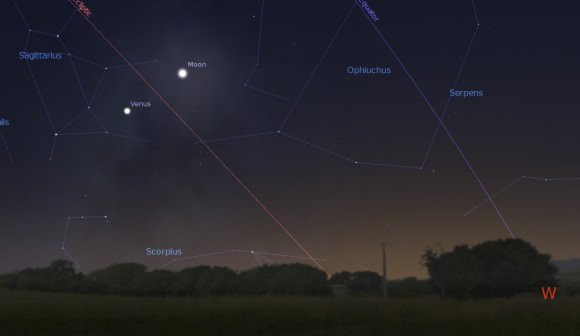
Venus and the waxing crescent Moon, looking to the west tonite at 30 minutes after sunset for latitude 30 degrees north. (Created using Stellarium).

Just like the Moon, Venus goes through a full range of phases. Through the telescope, Venus currently presents a 26.7” diameter disk. That size will swell to almost 40” by month’s end, as Venus begins to approach the Earth and presents a noticeable crescent phase. We just passed dichotomy — the theoretical point where Venus presents a half-illuminated phase as seen from Earth — on October 31st, and Venus already shows a noticeable crescent:
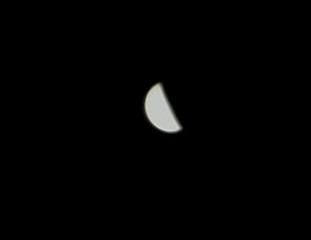
Venus on the night of November 5th 2013, a quick stack of about 200 frames. (Photo by Author)

Note that we say “theoretical” because there’s typically a discrepancy of a day or two between predicted and observed dichotomy. This is also known as Schröter’s Effect. One probable cause for this is the dazzling appearance of the disk of Venus. We typically use a variable polarizing filter to cut the glare of Venus down at the eyepiece.

You might also note that Venus currently occupies the “basement” of the zodiac in the constellation Sagittarius. In fact, the planet is currently as far south as it can go, sitting at a declination of -27° 14’ on this very evening. You have to go all the way back to 1930 to find a more southerly declination of Venus, just 12’ lower!

But you won’t have to wait much longer to break that record, as the chart below shows for the most southerly declinations of Venus for the next half century:

Year Date Declination
2013 November 6th -27° 09’
2021 “            “ -27° 14’
2029 “            “ -27° 18’
2037 “            “ -27° 23’
2045 “            “ -27° 29’
2053 “            “ -27° 34’
2061 “            “ -27° 39’


Note that each event occurs on November 6th, and they’re spaced 8 years apart. Apparitions of Venus closely duplicate their paths in the sky over an 8 year cycle. This is because the planet nearly completes 13 orbits of the Sun for our 8. Venus “catches up” to the Earth on its interior orbit once every 584 days to reach inferior conjunction. It usually passes above or below the Sun from our vantage point, though last year it transited, a feat that won’t be witnessed again until 2117 AD.

How far south can Venus go? Well, its orbit is tilted 3.4 degrees relative to the ecliptic. It can reach a southern declination of -28 05’, though you have to go way back to 1874 for its last occurrence!

Today is also a great time to try your hand at spotting Venus in the daytime, as a 3-day old waxing crescent Moon lies about eight degrees to its upper right:
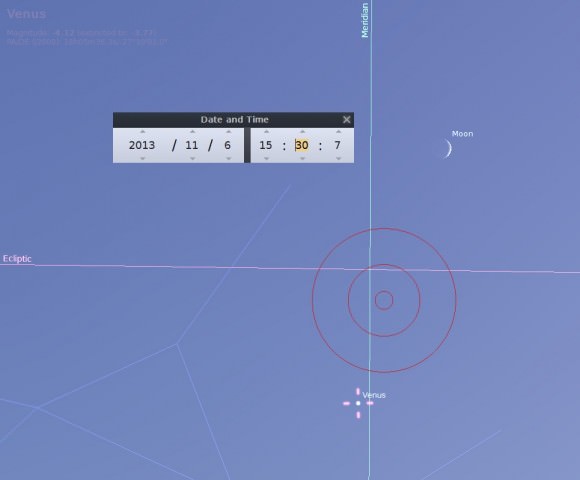
A daytime Venus near the Moon transiting to the south at about 3:30PM EST today. A 5 degree wide Telrad "bullseye" is provided for scale. (Credit: Stellarium).
A daytime Venus near the Moon, transiting to the south at about 3:30PM EST today. A 5 degree wide Telrad “bullseye” is provided for scale. (Credit: Stellarium).

Note that seeing Venus in the daytime is surprisingly easy, once you known exactly where to look for it. Your best chances are around mid-afternoon at about 3PM local, when the daytime Moon and Venus lie highest in the southern sky. Did you know that Venus is actually intrinsically brighter per square arc second than the Moon? It’s true! The Moon actually has a very low reflective albedo of 12% — about the equivalent of fresh asphalt — while the cloud tops of Venus are more akin the fresh snow with an albedo of about 80%.

Its also worth checking out Venus and its local environs after nightfall as it passes near the Lagoon (M8) and the Trifid nebula (M8) on the night of November 6th. Continuing with its trek across the star rich plane of the heart of the Milky Way galaxy, Venus also passes near the globular cluster M22 on November 13th.

Venus also sits in the general of Pluto on November 15th, lying just 6.6 degrees south of it. Be sure to wave in the general direction of NASA’s New Horizons spacecraft bound for Pluto in July 2015 tonight as well, using the Moon and Venus for a guide:
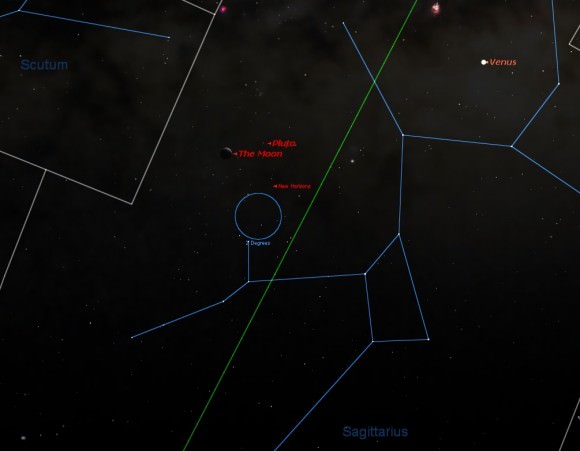
The position of the Moon, Venus, Pluto, & New Horizons on the night of November 6th, 2013. (Created using Starry Night Education Software).
The position of the Moon, Venus, Pluto, & New Horizons at 14UT on November 7th, 2013. (Created using Starry Night Education Software).

Another shot at seeing Venus paired with the Moon occurs on December 5th.

Venus also presents a maximum area of illumination on December 6th, and will shine at its brightest on December 10th at magnitude -4.7. Can you catch it casting a shadow? The best time to search for this illusive phenomenon would be just before New Moon on December 2nd. A dark sky site away from any other sources of illumination, and a snow covered ground providing high contrast also helps. Fortunately, snow isn’t in short supply in the northern hemisphere in December!

Venus is currently the only naked eye planet in the November early evening sky. We always thought that it’s a bit of a cosmic irony that the nearest planet presents a dazzling, but featureless white disk as seen from Earth. Diligent amateurs have, however, been able to tease out cloud patterns on Venus using UV filters.

Another elusive phenomenon to watch for as Venus reaches a crescent phase is ashen light. Long reported by observers, a faint glow on the night side of Venus is something that persists, but shouldn’t be. A similar effect seen on the night side of the Moon known as Earthshine is easily explained by sunlight being reflected off of the Earth… but Venus has no moon. What gives? Frequent explanations over the years have been aurorae, electrical activity, airglow, or, more frequently cited, observer bias. The brain wants to see a filled in space, and promptly inserts it betwixt the dazzling horns of the planet.

Keep an eye on Venus as it reaches maximum brilliancy and heads towards inferior conjunction on January 11th, 2014, and a rare chance to see it on said date… more to come!



This Is How The World’s Largest Radio Telescope Is Divvying Up Design Work

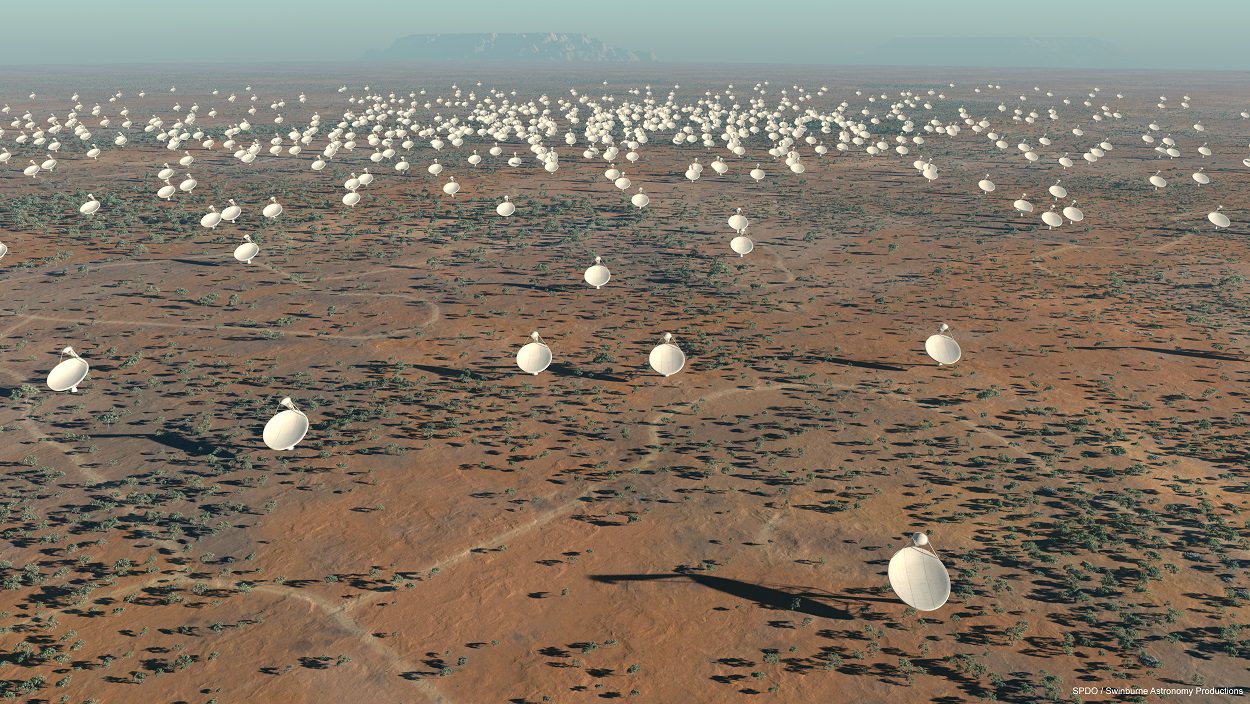
Artist's conception of the Square Kilometer Array. Credit: SKA Organisation

The world’s largest radio telescope will act very much like a jigsaw; every piece of it must be precisely engineered to “fit” and to work with all the other elements. This week, the organizers of the Square Kilometer Array released which teams will be responsible for the individual “work packages” for this massive telescope, which will be in both South Africa and Australia.

“Each element of the SKA is critical to the overall success of the project, and we certainly look forward to seeing the fruits of each consortium’s hard work shape up over the coming years”, stated John Womersley, chair of the SKA board.

“Now this multi-disciplinary team of experts has three full years to come up with the best technological solutions for the final design of the telescope, so we can start tendering for construction of the first phase in 2017 as planned.”

Key science goals for SKA include the evolution of galaxies, the nature of mysterious dark energy, examining the nature of gravity and magnetism, looking at how black holes and stars are created, and even searching for extraterrestrial signals. We’ll illustrate some of those key science concepts while talking about the teams below.

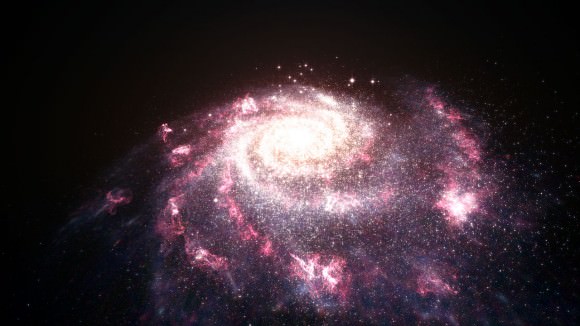
This illustration shows a messy, chaotic galaxy undergoing bursts of star formation. This star formation is intense; it was known that it affects its host galaxy, but this new research shows it has an even greater effect than first thought. The winds created by these star formation processes stream out of the galaxy, ionising gas at distances of up to 650 000 light-years from the galactic centre. Credit: ESA, NASA, L. Calçada

The numbers themselves on the teams are staggering: more than 350 scientists and engineers, representing 18 countries and almost 100 institutions. There are 10 main work packages that these people are responsible for. Here they are, along with SKA’s descriptions of each element:

Dish: “The “Dish” element includes all activities necessary to prepare for the procurement of the SKA dishes, including local monitoring & control of the individual dish in pointing and other functionality, their feeds, necessary electronics and local infrastructure.” (Led by Mark McKinnon of  Australia’s Commonwealth Scientific and Industrial Research Organisation, or CSIRO.)

– Low Frequency Aperture Array: “The set of antennas, on board amplifiers and local processing required for the Aperture Array telescope of the SKA.” (Led by Jan Geralt Bij de Vaate of ASTRON, or the Netherlands Institute for Radio Astronomy).

– Mid Frequency Aperture Array: “Includes the activities necessary for the development of a set of antennas, on board amplifiers and local processing required for the Aperture Array telescope of the SKA.” (Led by de Vaate.)

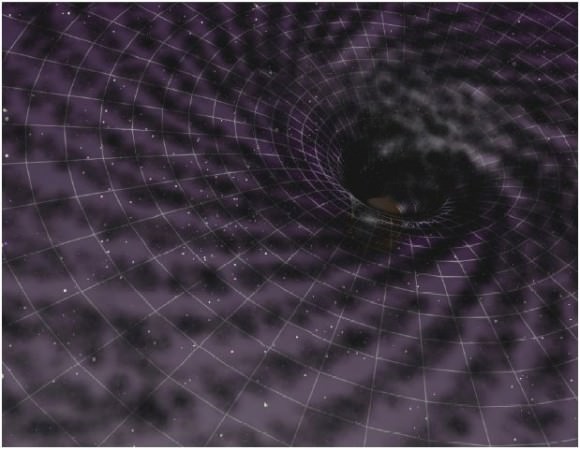
Artist’s schematic impression of the distortion of spacetime by a supermassive black hole at the centre of a galaxy. The black hole will swallow dark matter at a rate which depends on its mass and on the amount of dark matter around it. Image: Felipe Esquivel Reed.

– Telescope Manager: “Will be responsible for the monitoring of the entire telescope, the engineering and operational status of its component parts.” (Led by Yashwant Gupta of the NCRA or National Centre for Radio Astrophysics in India.)

– Science Data Processor: “Will focus on the design of the computing hardware platforms, software, and algorithms needed to process science data from the correlator or non-imaging processor into science data products.” (Led by Paul Alexander of the University of Cambridge, United Kingdom.)

– Central Signal Processor: “It converts digitised astronomical signals detected by SKA receivers (antennas & dipole (“rabbit-ear”) arrays) into the vital information needed by the Science Data Processor to make detailed images of deep space astronomical phenomena that the SKA is observing.” (David Loop of the NRC, National Research Council of Canada.)

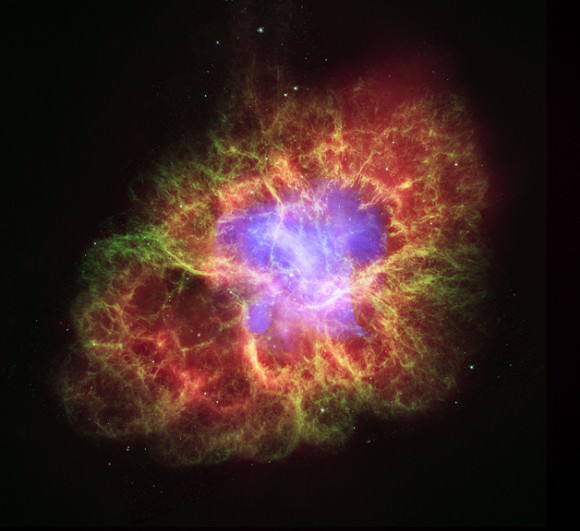
The supernova that produced the Crab Nebula was detected by naked-eye observers around the world in 1054 A.D. This composite image uses data from NASA’s Great Observatories, Chandra, Hubble, and Spitzer, to show that a superdense neutron star is energizing the expanding Nebula by spewing out magnetic fields and a blizzard of extremely high-energy particles. The Chandra X-ray image is shown in light blue, the Hubble Space Telescope optical images are in green and dark blue, and the Spitzer Space Telescope’s infrared image is in red. The size of the X-ray image is smaller than the others because ultrahigh-energy X-ray emitting electrons radiate away their energy more quickly than the lower-energy electrons emitting optical and infrared light. The neutron star is the bright white dot in the center of the image.

 Signal and Data Transport: “The Signal and Data Transport (SADT) consortium is responsible for the design of three data transport networks.” (Led by Richard Schilizzi of the University of Manchester, United Kingdom.)

– Assembly, Integration & Verification: “Includes the planning for all activities at the remote sites that are necessary to incorporate the elements of the SKA into existing infrastructures, whether these be precursors or new components of the SKA.” (Led by Richard Lord of SKA South Africa.)

– Infrastructure: “Requires two consortia, each managing their respective local sites in Australia and Africa … This includes all work undertaken to deploy and be able to operate the SKA in both countries such as roads, buildings, power generation and distribution, reticulation, vehicles, cranes and specialist equipment needed for maintenance which are not included in the supply of the other elements.” (Led by Michelle Storey of CSIRO.)

Wideband Single Pixel Feeds: “Includes the activities necessary to develop a broadband spectrum single pixel feed for the SKA.” (Led by John Conway of Chalmers University, Sweden.)

The Stars of Orion Seen Blazing From Orbit

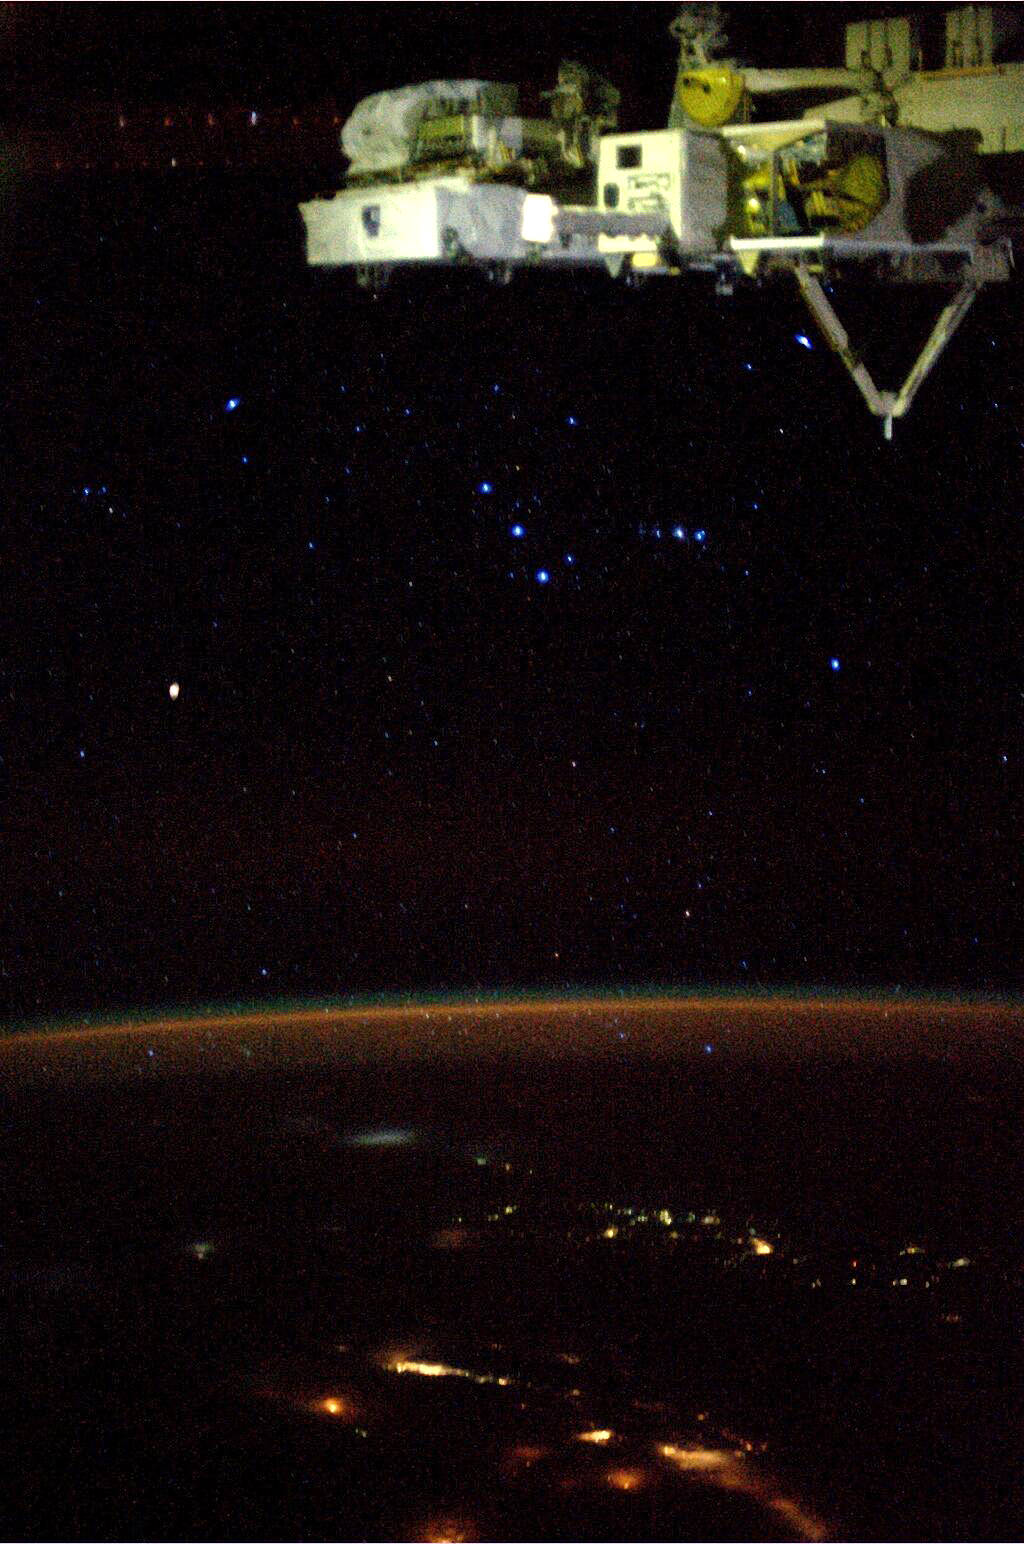
The constellation Orion photographed from orbit by Karen Nyberg (NASA)

The mighty hunter soars above the atmosphere in this photo, taken by NASA astronaut Karen Nyberg currently living and working in space aboard the ISS. One of the most recognizable constellations in night skies all across the Earth, Orion also puts on an impressive display for those well above the Earth!


Appearing here to be lying on his right side, the three stars of Orion’s famous belt — Mintaka, Alnilam, and Alnitak, top to bottom — are center frame, while his sword is nearly horizontal just to the right (the blurry center star of which isn’t a star at all, of course, but rather the enormous star-forming Orion nebula.)

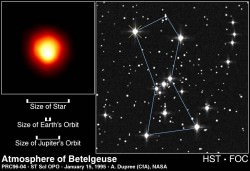
Betelgeuse, as seen by the Hubble Space Telescope.

At Orion’s right shoulder is Betelgeuse, a huge red giant 20 times more massive than our Sun. Its fiery color is obvious in Karen’s photo, mirroring many of the much-closer human-made city lights visible on the ground.

In addition to featuring my favorite constellation, this photo that Karen recently shared on Twitter also serves to prove (to those few who still require evidence of such) that yes, astronauts can see stars from space. Very nicely too, I may add. The only reason they are not visible in all images is purely photographic — cameras exposing for a bright scene, like a daylit Earth (or Moon) won’t be able to capture the relatively much dimmer light of stars in the same shot, making it look like space is empty of them. Even here we can see a bit of noise in the glowing line of Earth’s atmosphere and a little blurring of edges — that’s a result of a high ISO setting to increase camera sensitivity along with a slightly longer shutter speed than your hand can easily keep stable… again, all to better capture the faint streams of photons from distant stars.

Blaze on, mighty Hunter! See this and more views from the ISS on Karen’s Twitter page here.

‘Stairways to Mars’ Concept Proposes Truck Stops Near The Red Planet

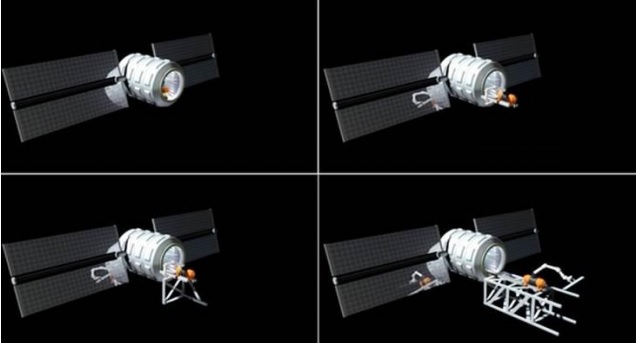
Robotic construction of the proposed "Stairway to Mars", a concept for fuelling spacecraft on their way to other destinations. Credit: Anna Nesterova art

Any road trip requires rest stops to refuel and rest. That’s especially true of planetary exploration, as it would take months between destinations. In that spirit, here is a new concept for “Mars truck stops” from the Space Development Steering Committee, which they call “Stairways to Mars.”

For those who aren’t aware, the committee is a coalition of space advocates. Included in the group are the heads of the National Space Society, the Space Frontier Foundation, and the Mars Society, SDSC said, as well as a list of past astronauts, high-ranking NASA employees and others. (The founder is Howard Bloom, who was a former visiting scholar at New York University’s graduate psychology department, among other positions.)

They provide commentary on NASA funding (such as this March article on sequestration). Also in March, the group advertised a White House petition to provide space-based solar power.

So how would a Mars truck stop work? In a nutshell, this is what SDSC proposes:

– Beams are constructed in space “just like a giant erector set”, according to a statement from John Strickland, SDSC chief analyst. This would be accomplished using “robots on rails” that could build the first part, then “extend … its own rails along the beam as it goes.”

–  Solar panels are added on to the beam to provide power;

– Components are then added according to need. Pictures from SDSC show items such as fuel tanks on the truck stop. If ambitions soared even higher, the concept could even be built upon to make a larger space colony modelled on “O’Neill colonies”, as shown below.

A space colony under construction using a concept from the Space Development Steering Committee. The image shown above has a deck 1,000 feet wide, as well as robots that carry cargo and beams for parking spots. Credit: Anna Nesterova art

It should be emphasized that this is a concept, with no funding or firm plans yet, but for what it’s worth the committee says it could move quickly. “These plans are budgeted to cost LESS than the current NASA program for our next step in space — the $40 billion Space Launch System and Orion Capsule. What’s more, the first steps of the Stairway to Mars are achievable in three years,” the committee writes.

One possible location for this kind of truck stop would be at the Earth-Moon L1 Lagrange point, or a spot in space where gravities from different bodies approximately equal each other out and allow an object to hover in place. Lagrange points are already used for several space missions, including the Planck telescope that was just decommissioned.

What do you think of the concept? Let us know in the comments.

Here’s the Latest Kepler Orrery Video: the Orbits of the Planets Go ‘Round and ‘Round

If you’ve ever wanted to know what 3,538 exoplanets look like spinning around their stars, here you go!

This is the third and latest installment of the mesmerizing Kepler Orrery videos by Daniel Fabrycky from the Kepler science team. It shows the relative sizes of the orbits and planets in the multi-transiting planetary systems discovered by Kepler up to November 2013 (according to the Kepler site, 3,538 candidates so far.) According to Daniel “the colors simply go by order from the star (the most colorful is the 7-planet system KOI-351). The terrestrial planets of the Solar System are shown in gray.”

Not that our Solar System is boring, of course, but well, ya know… there are an awful lot of planets out there.

Check out Daniel’s previous version here.

Here’s What A Spacecraft Looks Like Burning Up (Plus Correction of Past Article)

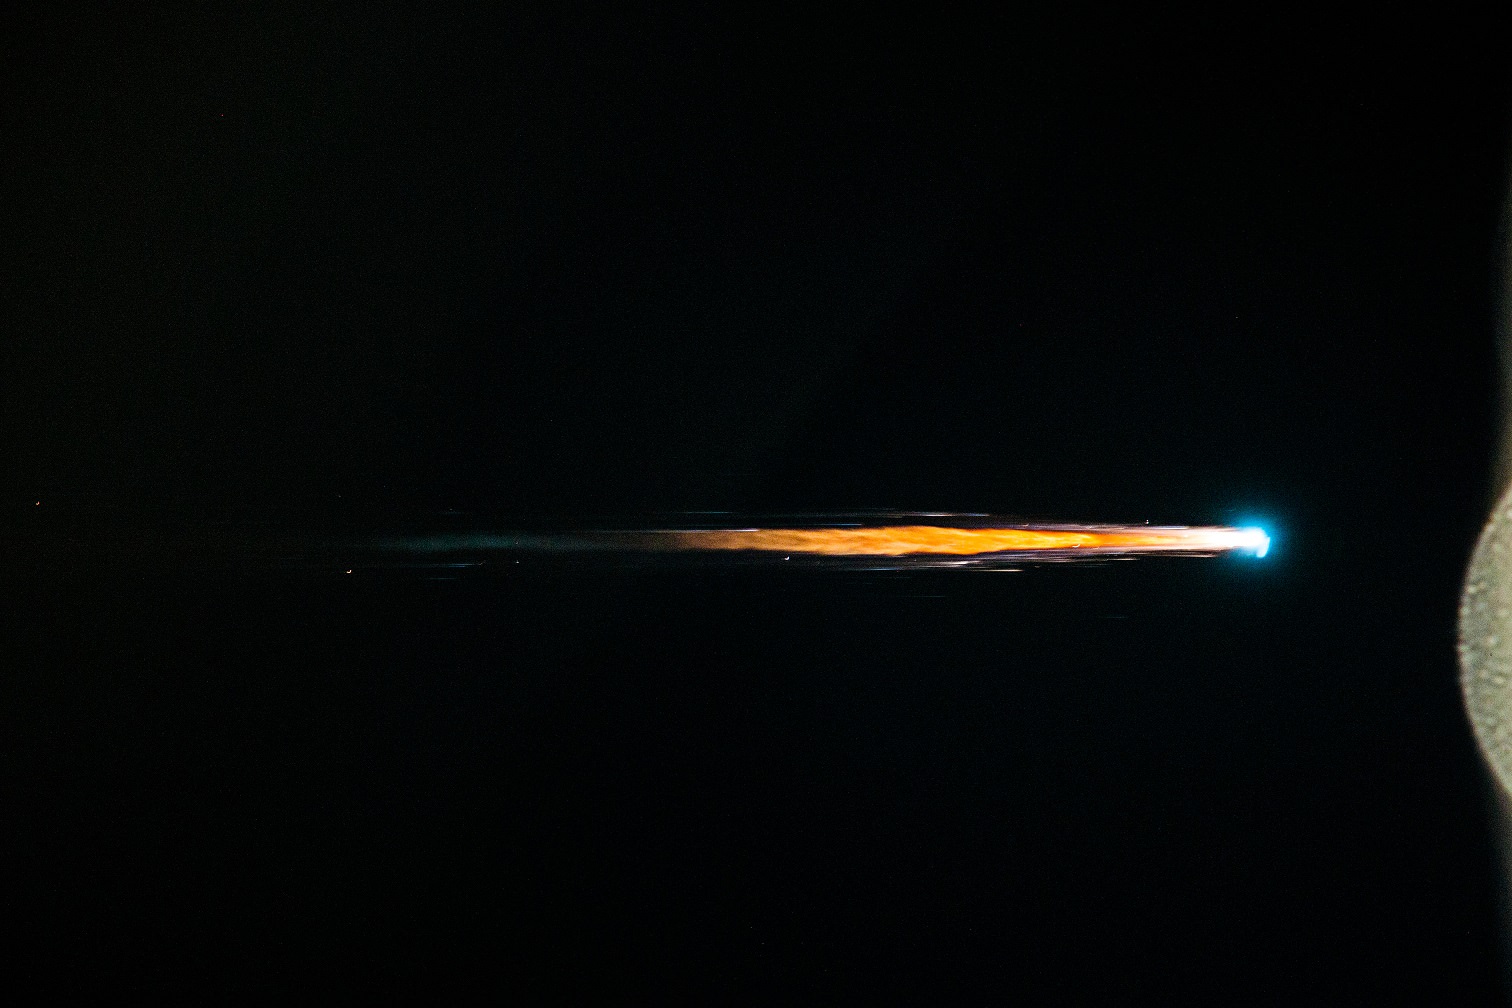
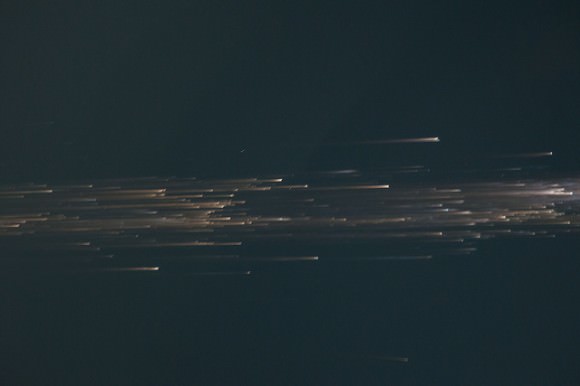
The Automated Transfer Vehicle Albert Einstein burning up on Nov. 2, 2013 at 12:04 GMT over an uninhabitated part of the Pacific Ocean. This picture was snapped from the International Space Station. Credit: ESA/NASA

Flame and fireworks. That’s what the Automated Transfer Vehicle Albert Einstein appeared to astronauts to be like as it made a planned dive into Earth’s atmosphere Nov. 2. The European Space Agency ship spent five months in space, boosting the International Space Station’s altitude several times and bringing a record haul of stuff for the astronauts on board the station to use.

According to the European Space Agency, this is the first view of an ATV re-entry that astronauts have seen since Jules Verne, the first, was burned up in 2008. Controllers moved the spacecraft into view of the Expedition 37 crew to analyze the physics of breakup.

Also, yesterday you may have seen an article concerning a picture a photographer snapped of the ATV burning up on Earth. After publishing it, we then realized we were in error with that information. But it turns out the photographer actually DID capture the ATV-4 ina subsequent image. We’ve now updated the article a second time. Senior Editor Nancy Atkinson writes:

Here’s a story that we’ve updated a couple of times, and now it ultimately has a happy ending. We originally posted a picture from Oliver Broadie who thought he captured an image of the ATV-4 Albert Einstein right before it burned up in the atmosphere. That image, see below, was ultimately determined to be of the International Space Station and not the ATV-4, so yesterday we pulled the image and explained why. But now, thanks to a great discussion between the photographer and satellite tracker Marco Langbroek (see it in the comment section), they have determined that Oliver actually did capture the ATV-4 in a subsequent image taken about 4 minutes later. Thanks to both Ollie and Marco for analyzing the timing and images. Also, we were in error for saying that the image showed the ATV-4 burning up in the atmosphere. That was my mistake (Nancy).

More orbital pictures of the ATV burning up are available in this ESA Flickr set.

Automated Transfer Vehicle Albert Einstein burning up in the atmosphere at 12:04 GMT on Nov. 2, 2013. Picture snapped from the International Space Station. Credit: ESA/NASA

Five Saturn Moons Stun In Cassini Spacecraft Archival Image

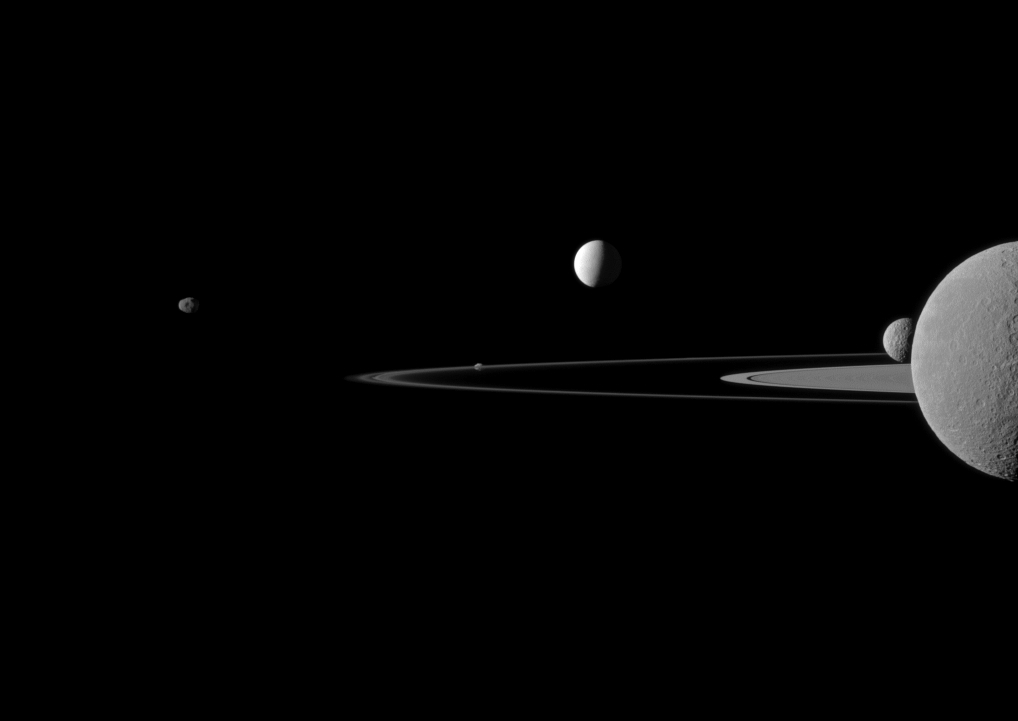
Saturn's moons (from left to right) Janus, Pandora, Enceladus, Mimas and Rhea. Rhea is on top of Saturn. Credit: NASA/JPL-Caltech/Space Science Institute

This picture is from a couple of years ago, but still worth the extra look. The Cassini spacecraft — busily circling Saturn and gathering data on the ringed planet and its moons — managed to grab five of Saturn’s 62 known moons in one shot. The European Space Agency highlighted the picture on its home page this week.

From left to right, you can see Janus, Pandora, Enceladus, Mimas and Rhea. Don’t be fooled by the rings near Rhea; those are actually Saturn’s rings. Rhea is just blocking the view of the planet from Saturn’s perspective during this picture portrait, which was taken on July 29, 2011.

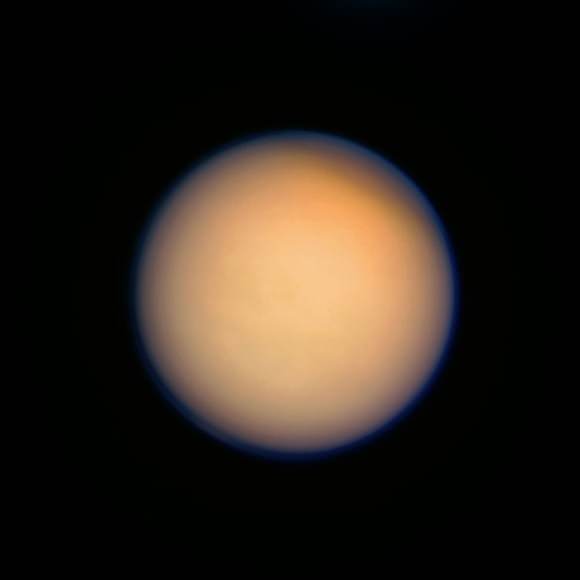
The cornucopia of moons around Saturn is part of what makes that particular planet so interesting. Titan, the largest, is perhaps the most well-known because of its strange orange haze that intrigued astronomers when the twin Voyager spacecraft zoomed through the system in the 1980s. Cassini arrived in 2004 and revealed many more moons to science for the first time.

Color-composite of Titan made from raw Cassini images acquired on April 13, 2013 (added 4/17) NASA/JPL/SSI. Composite by J. Major.

“The dozens of icy moons orbiting Saturn vary drastically in shape, size, surface age and origin. Some of these worlds have hard, rough surfaces, while others are porous bodies coated in a fine blanket of icy particles. All have greater or smaller numbers of craters, and many have ridges and valleys,” NASA wrote on a web page about Saturn’s moons.

“Some, like Dione and Tethys, show evidence of tectonic activity, where forces from within ripped apart their surfaces. Many, like Rhea and Tethys, appear to have formed billions of years ago, while others, like Janus and Epimetheus, could have originally been part of larger bodies that broke up. The study and comparison of these moons tells us a great deal about the history of the Saturn System and of the solar system at large.”

And new discoveries are coming out all the time. Earlier this year, for example, astronomers said that the moon Dione could have had active geysers coming from its surface, such as what is likely happening on Enceladus.

Chandra Infographic Shows Where The Color Comes From In Space Pictures

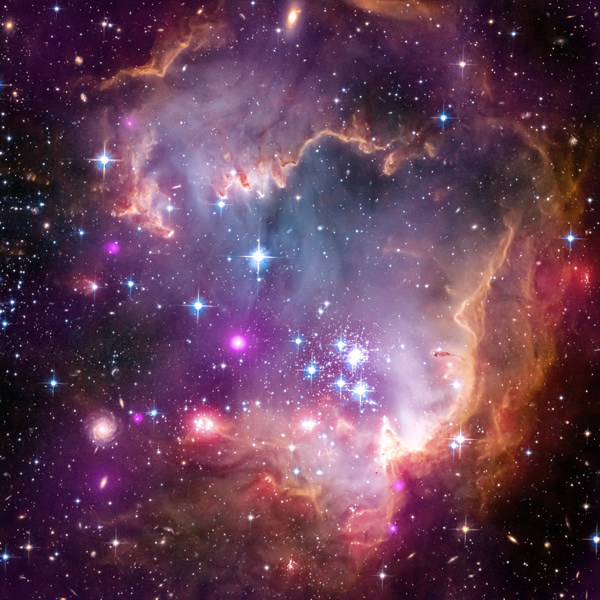
A part of the Small Magellanic Cloud galaxy is dazzling in this new view from NASA's Great Observatories. The Small Magellanic Cloud, or SMC, is a small galaxy about 200,000 light-years way that orbits our own Milky Way spiral galaxy. Credit: NASA.

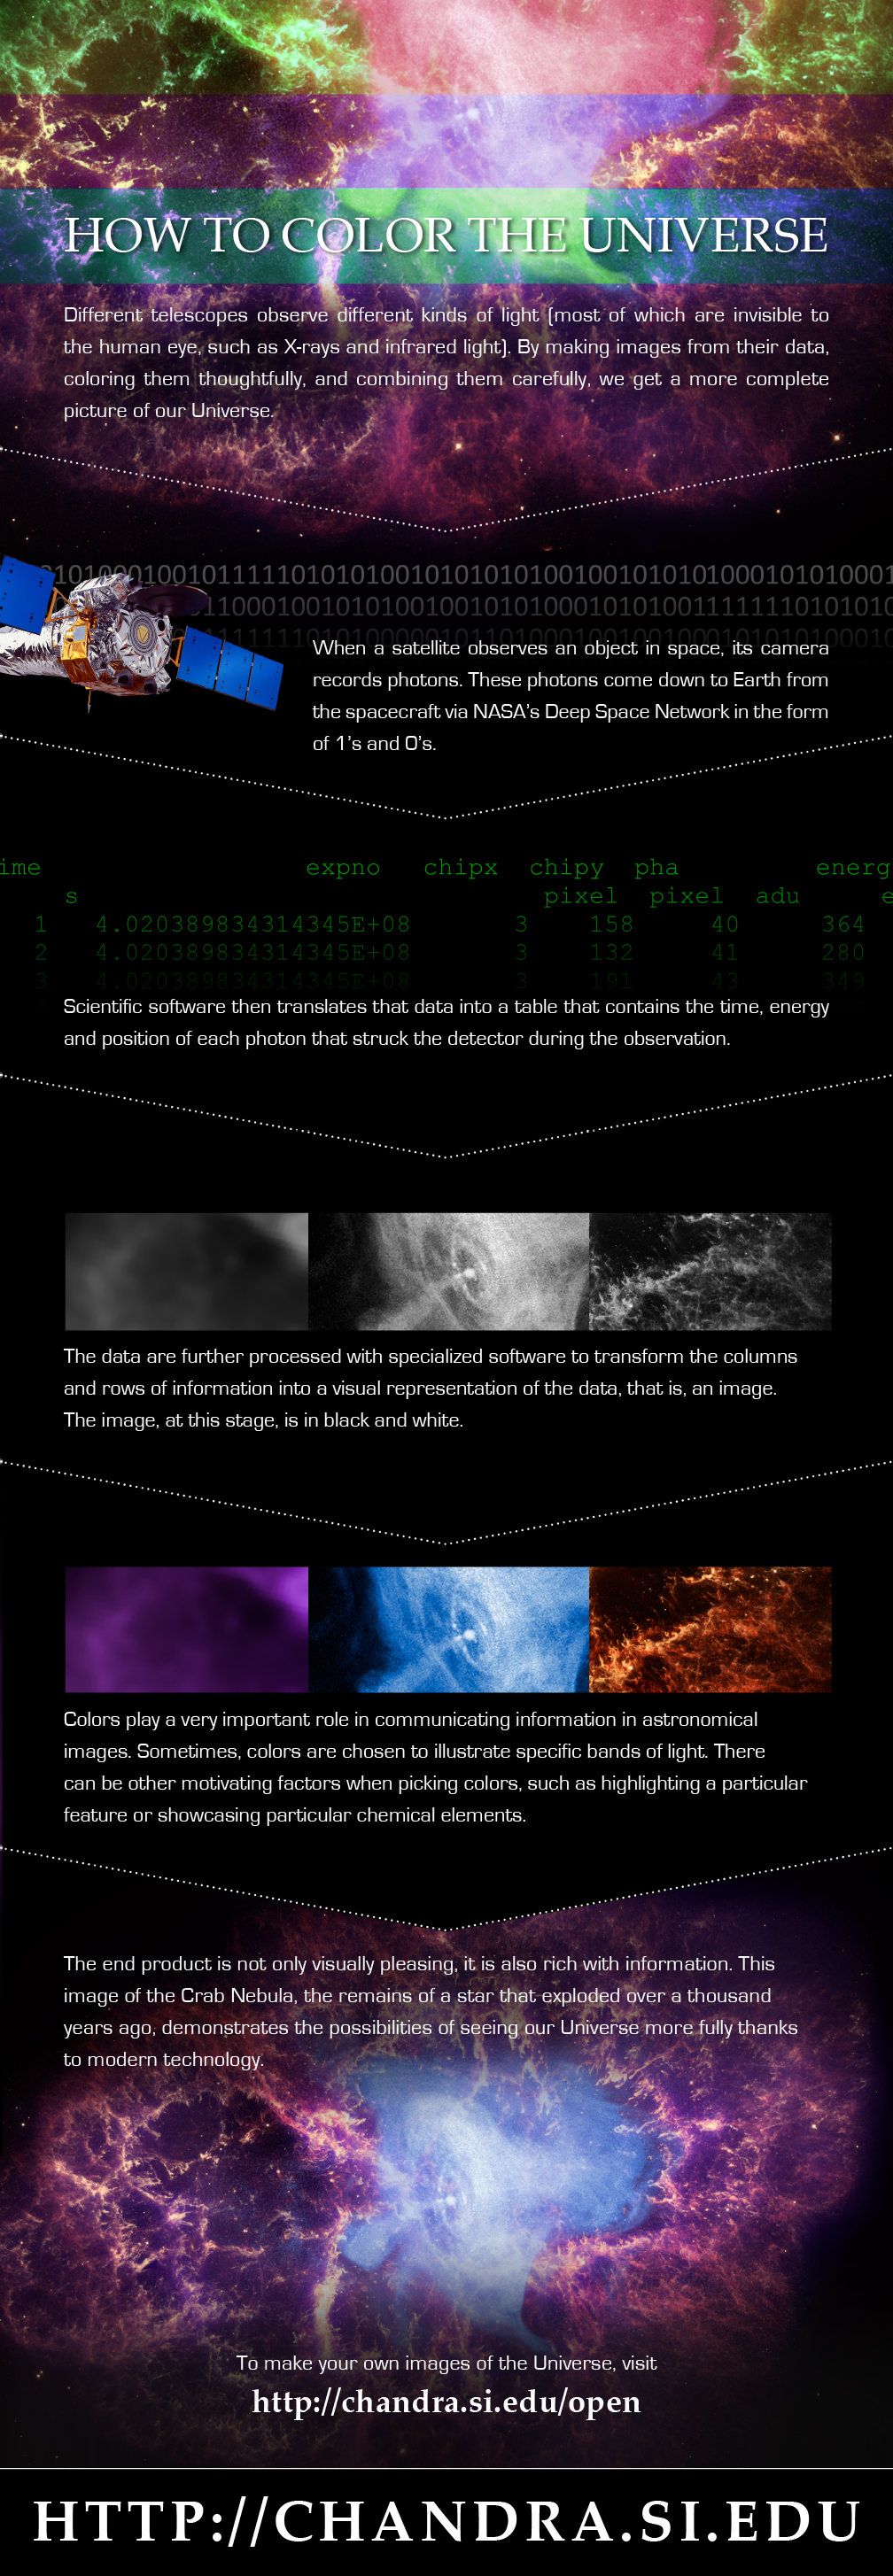
For your daily space zing, check out an infographic recently highlighted on the Chandra X-ray Observatory’s Google+ page. Called “How to Color the Universe” (see it below), it explains why the colors we see from space telescope pictures are added in after the data is gathered.

In a nutshell, the information is recorded by the telescope in photons, which is sent down to Earth in binary code (1s and 0s). Software renders these numbers into images, then astronomers pick the colors to highlight what to show in the data.

“Colors play a very important role in communication information in astronomical images,” the infographic states. “Sometimes, colors are chosen to illustrate specific bands of light. There can be other motivating factors when picking colors, such as highlighting a particular feature or showcasing particular chemical elements.”

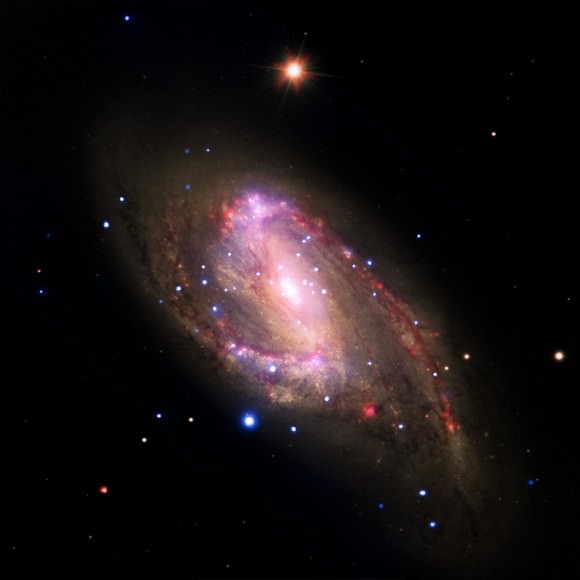
This multiwavelength image of the galaxy NGC 3627 contains X-rays from Chandra (blue), infrared data from Spitzer (red), and optical data from Hubble and the Very Large Telescope (yellow).  Astronomers conducted a survey of 62 galaxies, which included NGC 3627, to study the supermassive black holes at their centers.  Among this sample, 37 galaxies with X-ray sources are supermassive black hole candidates, and seven were not previously known. Confirming previous Chandra results, this study finds the fraction of galaxies hosting supermassive black holes is much higher than in optical searches for black holes that are relatively inactive.
This multiwavelength image of the galaxy NGC 3627 contains X-rays from Chandra (blue), infrared data from Spitzer (red), and optical data from Hubble and the Very Large Telescope (yellow). Astronomers conducted a survey of 62 galaxies, which included NGC 3627, to study the supermassive black holes at their centers. Among this sample, 37 galaxies with X-ray sources are supermassive black hole candidates, and seven were not previously known. Confirming previous Chandra results, this study finds the fraction of galaxies hosting supermassive black holes is much higher than in optical searches for black holes that are relatively inactive.

It’s natural right now to think that astronomers are adding data where none exist, but Chandra’s public affairs employees (Kim Arcand and Megan Watzke) wrote a Huffington Post piece in September addressing this, too.

“Often, scientists choose colors to represent certain scientific phenomena such as structures that appear in one wavelength and not another. This might be why the planet is pink or the galaxy green. Or they might want to show where different elements like iron or magnesium are found in an object, and they can demonstrate this by assigning the sliver of light for each in different colors,” they wrote.

“In other instances, colors are picked to make an image the most pleasing or beautiful. In some of these instances, cries of the images being faked can erupt. But they are not fake, no matter what colors are used. We can’t see these data without scientific tools and processing. The color in these images enhances the data but does not alter them.”

If you have a high level of comfort manipulating images, Chandra offers a website to create images from raw data yourself, complete with a tutorial showing you how to do it.

color_infograph

A Hybrid Solar Eclipse Seen From Earth… and Space

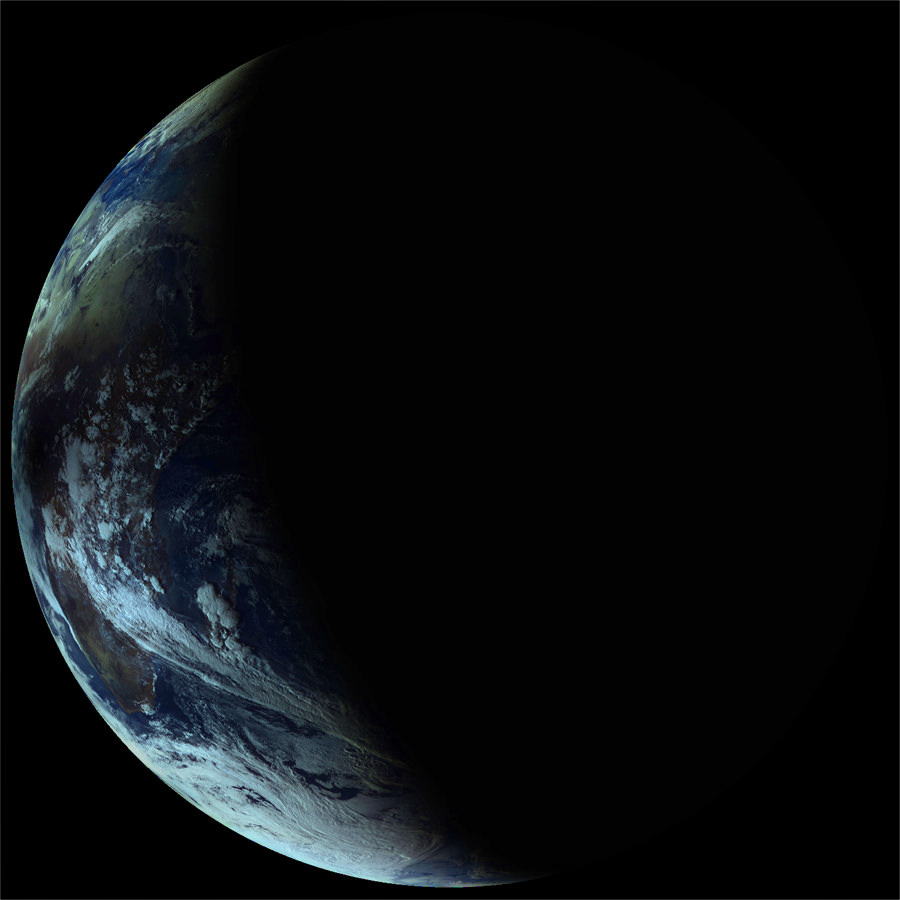
The Elektro-L satellite's view of how the Nov. 3, 2013 solar eclipse effected Earth. Blackness from the eclipse covers Africa. Credit: Elektro-L/Vitaliy EgorovVitaliy Egorov.

The final eclipse for 2013 was a grand event, witnessed across the Atlantic and the heart of Africa this past Sunday. Like so many other photographers along the North American east coast, we were at the ready to greet the partially eclipsed Sun at dawn. And as the shadow of the Moon touched down, teams on land, air and sea were ready to meet with the fleeting umbra as it raced eastward towards sunset over the Horn of Africa region.

But a fleet of spacecraft were also on hand to witness the rare spectacle as well. Turned earthward and sunward, these spacecraft documented not only the passage of the Moon’s shadow over the Earth, but recorded multiple partial solar eclipses from orbit as well.

The first view comes from the Roscosmos Electro-L satellite based in a geostationary orbit over the Indian Ocean:

Electro-L had captured such a view before, during the annular eclipse over Australia earlier this year in May. Roscosmos increased the frame capture rate of Electro-L to twice its usual speed for the sequence. As you watch the Earth pass from a waning gibbous to crescent phase, you can just see the umbra, or central shadow of the Moon, slide into view and come into contact with the sunset terminator over eastern Africa. You can also see the cloud cover that marks the dust storms that plagued eclipse-chasers based around the Lake Turkana region in Kenya.

One of the first public pictures of the umbra of the Moon as seen from space was taken from the Mir space station during a total solar eclipse in 1999. To our knowledge, such a feat has yet to be duplicated aboard the International Space Station. The phase angle of the ISS’s orbit during the eclipse was nearly perpendicular to the Sun-Moon-Earth syzygy, and unfavorable for this particular eclipse.

Thanks to the Russian journalist Vitaliy Egorov for bringing the Electro-L eclipse sequence to the attention of Universe Today!

Next up is a sequence of images from NASA’s Aqua satellite:

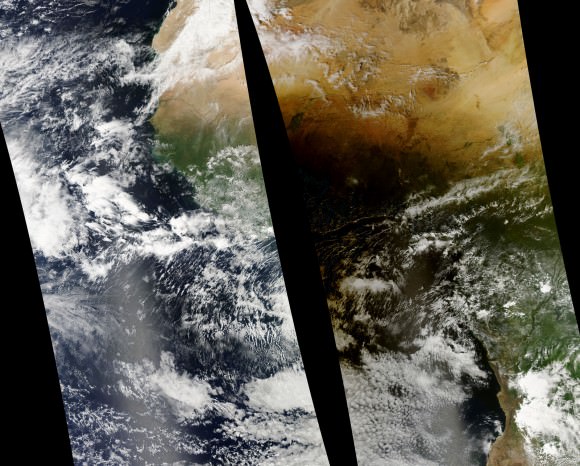
Sunday's eclipse and the Moon's umbra as seen from the Aqua satellite. (Credit: NASA/GSFC/Jeff Schmaltz/MODIS Land Rapid Response Team).
Sunday’s eclipse and the Moon’s umbra off of the west coast of Africa as seen from the Aqua satellite. (Credit: NASA/GSFC/Jeff Schmaltz/MODIS Land Rapid Response Team).

Launched in 2002, Aqua is part of the “A-train” (as in “Afternoon”) constellation of Earth-observing satellites. Perched in a low-Earth Sun-synchronous orbit, Aqua caught sight of the umbra of the Moon at around 14:45 UT on Sunday, November 3rd as it raced to make first landfall over the nation of Gabon and awaiting eclipse chasers.

Some Sun observing spacecraft caught sight of the eclipse as well. The European Space Agency’s Proba-2 nabbed three partial solar eclipses from its vantage point in low Earth orbit:

PROBA-2 used its SWAP imager to grab the sequences. Orbiting the Earth once every 99 minutes or 14.5 time a day, these “orbital eclipses” are quick, lasting about 10 minutes each in duration.

Finally, EUMETSAT’s MeteoSat-10 meteorological satellite based in a geostationary orbit over Africa captured an outstanding sequence, showing nearly the entire trek of the umbra across the entire path of the eclipse:

The sequence runs from 7:30 to 18:30 UT on November 3rd. Note how the video shows the shadow fade in and sharpen as the eclipse touches down off of the US East Coast and intensifies from an annular to total along the first 15 seconds of its track, only to speed up and flatten towards sunset over Africa. And all in six seconds!

And back here on Earth, we couldn’t resist stitching together the bounty from our own minor eclipse expedition for a stop-motion view of the partially eclipsed Sun rising over the Vehicle Assembly Building at the Kennedy Space Center in Florida:

We’d like to also mention a photo that isn’t a “solar eclipse seen from space…” Y’know the one, which shows the Earth, the Moon’s shadow, and a totally-eclipsed Sun, against a star dappled Milky Way. We won’t dignify it with a link. This has already been debunked by Bad Astronomer himself Phil Plait, but the bogus pic now seems to make its rounds across ye’ ole Web now during every eclipse. Seriously? Do we all crave “link juice” that bad? There are lots of real awesome eclipse photos out there, from Earth & beyond! Please, do your part to tell that well meaning friend/coworker/relative/stranger on Twitter that this “ultimate eclipse photo…” isn’t.

How rare are hybrid solar eclipses? Well, the next solar eclipse that is both annular and total along its track occurs over southeast Asia on April 20th, 2023. It’s interesting to note that this past weekend’s eclipse may have been the first sunrise solar eclipse over the VAB since it was built in 1966. Eclipses in the same 18 years and 11 days- long saros cycle repeat, but move about 120 degrees westward. Thus, follow an eclipse cycle through a “triple saros”— known as an “Exeligmos,” an ultimate scrabble word if you can land it on a triple word score! —and an eclipse’s geometry will roughly line back up over a 54 year 33 day long span. Saros 143 produced a an eclipse crossing a similar path on October 2nd, 1959 (before the VAB was built!) and will repeat its Atlantic sunrise performance on December 6th, 2067! Let’s see, by then I’ll be…

India’s First Mars Mission Launches Flawlessly on Historic Journey to the Red Planet

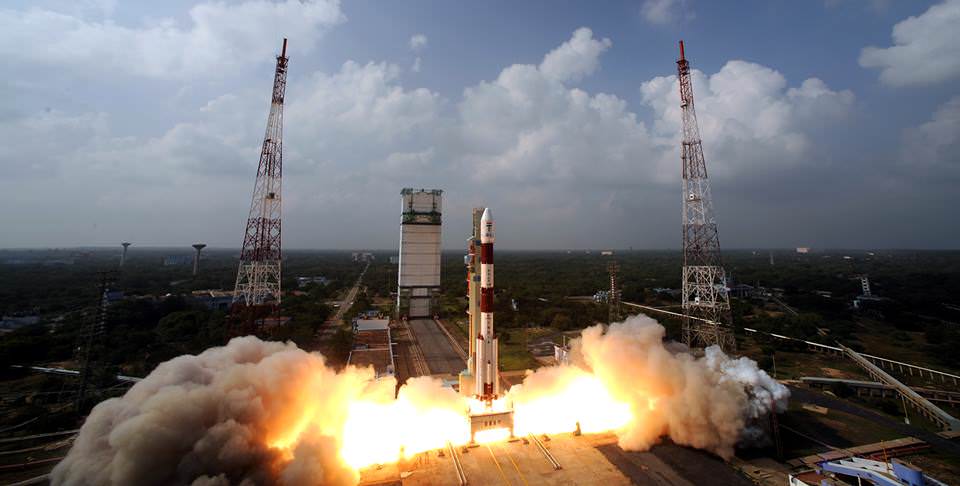
Blastoff of the Indian developed Mars Orbiter Mission (MOM) on Nov. 5, 2013 from the Indian Space Research Organization’s (ISRO) Satish Dhawan Space Centre SHAR, Sriharikota. Credit: ISRO

WOW MOM !
Blastoff of the Indian developed Mars Orbiter Mission (MOM) on Nov. 5, 2013 from the Indian Space Research Organization’s (ISRO) Satish Dhawan Space Centre SHAR, Sriharikota. Credit: ISRO[/caption]

India flawlessly launched its first ever mission to Mars today (Nov. 5) to begin a history making ten month long interplanetary voyage to the Red Planet that’s aimed at studying the Martian atmosphere and searching for methane after achieving orbit.

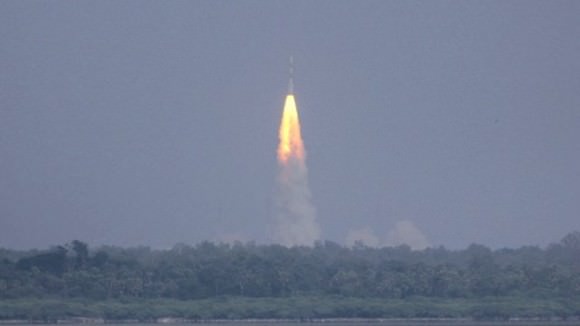
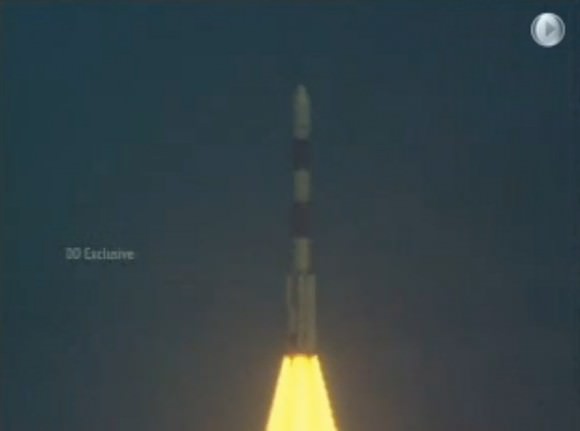
The Mars Orbiter Mission (MOM) thundered to space atop the nations four stage Polar Satellite Launch Vehicle (PSLV) precisely on time at 14:38 hrs IST (9:08 UTC, 4:08 a.m. EST) from the Indian Space Research Organization’s (ISRO) Satish Dhawan Space Centre SHAR, Sriharikota, off India’s east coast.

“Our journey to Mars begins now!” announced an elated ISRO Chairman K. Radhakrishnan at the ISRO spaceport during a live broadcast of MOM’s launch from the mission control center. “We achieved orbit and we can all be proud.”

Flawless liftoff of India’s Mars Orbiter Mission (MOM) on Nov. 5, 2013 from the Indian Space Research Organization’s (ISRO) Satish Dhawan Space Centre SHAR, Sriharikota. Credit: ISRO

This was the 25th launch of India’s highly reliable 44 meter (144 foot) tall PSLV booster.

The 700,000 pound thrust PSLV rocket launched in its most powerful, extended XL version with six strap on solid rocket motors.

Launch of India’s Mars Orbiter Mission (MOM) on Nov. 5, 2013 from Sriharikota, India. Credit: ISRO

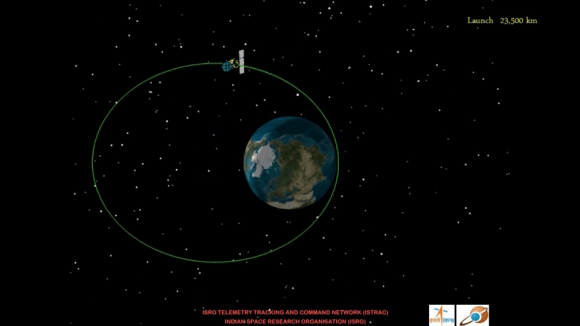
“I’m extremely happy to announce that the PSLV-C25 vehicle has placed the Mars orbiter spacecraft very precisely into an elliptical orbit around Earth of 247 x 23556 kilometers with an inclination of 19.2 degrees,” Radhakrishnan said, after “much meticulous planning and hard work by everyone.”

ISRO announced that MOM separated from the PSLV 4th stage as planned some 44 minutes after liftoff and that the solar panels successfully deployed.

Confirmation of the 4th stage ignition and spacecraft separation was transmitted by ship-borne terminals aboard a pair of specially dispatched tracking ships – SCI Nalanda and SCI Yamuna – stationed by ISRO in the South Pacific Ocean.

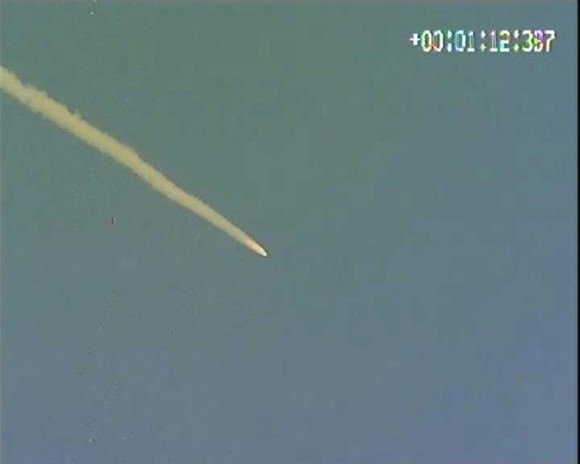
India’s Mars Orbiter Mission (MOM) streaks to orbit after launch on Nov. 5, 2013.  Credit: ISRO
India’s Mars Orbiter Mission (MOM) streaks to orbit after launch on Nov. 5, 2013. Credit: ISRO

MOM was designed and developed by the Indian Space Research Organization (ISRO) in near record time after receiving approval from the Indian Prime Minister Manmohan Singh in August 2012.

“No mission is beyond our capability”, said Radhakrishnan. “MOM is a huge step taking India beyond Earth’s influence for the first time.”

A series of six burns over the next month will raise the apogee and put MOM on a trajectory for Mars around December 1.

Following a 300 day interplanetary cruise phase, the do or die Mars orbital insertion firing by the main engine on September 24, 2014 will place MOM into an 366 km x 80,000 km elliptical orbit.

If all continues to goes well with MOM, India will join an elite club of four who have launched probes that successfully investigated the Red Planet from orbit or the surface – following the Soviet Union, the United States and the European Space Agency (ESA).

MOM is the first of two new Mars orbiter science probes from Earth blasting off for the Red Planet this November. Half a globe away, NASA’s $671 Million MAVEN orbiter remains on target to launch barely two weeks after MOM on Nov. 18 – from Cape Canaveral, Florida.

The 1,350 kilogram (2,980 pound) MOM orbiter is also known as ‘Mangalyaan’ – which in Hindi means ‘Mars craft.’

Graphic shows MOM’s initial orbit around Earth after successful Nov. 5 launch. Credit: ISRO

Although the main objective is a demonstration of technological capabilities, the probe is equipped with five indigenous instruments to conduct meaningful science – including a multi color imager and a methane gas sniffer to study the Red Planet’s atmosphere, morphology, mineralogy and surface features. Methane on Earth originates from both geological and biological sources – and could be a potential marker for the existence of Martian microbes.

MOM’s 15 kg (33 lb) science suite comprises:

MCM: the tri color Mars Color Camera images the planet and its two tiny moons, Phobos and Deimos

LAP: the Lyman Alpha Photometer measures the abundance of hydrogen and deuterium to understand the planets water loss process

TIS: the Thermal Imaging Spectrometer will map surface composition and mineralogy

MENCA: the Mars Exospheric Neutral Composition Analyser is a quadrapole mass spectrometer to analyze atmospheric composition

MSM: the Methane Sensor for Mars measures traces of potential atmospheric methane down to the ppm level.

Scientists will be paying close attention to whether MOM detects any atmospheric methane to compare with measurements from NASA’s Curiosity rover – which found ground level methane to be essentially nonexistent – and Europe’s upcoming 2016 ExoMars Trace Gas Orbiter.

MOM and MAVEN will arrive nearly simultaneously in Mars orbit next September – joining Earth’s invasion fleet of five operational orbiters and intrepid surface rovers currently unveiling the mysteries of the Red Planet.

Both MAVEN and MOM’s goal is to study the Martian atmosphere , unlock the mysteries of its current atmosphere and determine how, why and when the atmosphere and liquid water was lost – and how this transformed Mars climate into its cold, desiccated state of today.

Although they were developed independently and have different suites of scientific instruments, the MAVEN and MOM science teams will “work together” to unlock the secrets of Mars atmosphere and climate history, MAVEN’s top scientist told Universe Today.

“We have had some discussions with their science team, and there are some overlapping objectives,” Bruce Jakosky told me. Jakosky is MAVEN’s principal Investigator from the University of Colorado at Boulder.

“At the point where we [MAVEN and MOM] are both in orbit collecting data we do plan to collaborate and work together with the data jointly,” Jakosky said.

The $69 Million ‘Mangalyaan’ mission is expected to continue gathering measurements at the Red Planet for about six to ten months and hopefully much longer.

Stay tuned here for continuing MAVEN and MOM news and my MAVEN launch reports from on site at the Kennedy Space Center press center.

Ken Kremer

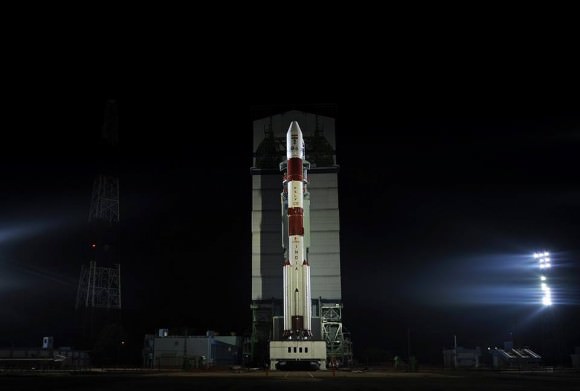
It’ s a Mind-Blowing Midnight Marvel !  Fueled PSLV rocket and India’s Mars Orbiter Mission (MOM) awaits Nov. 5 blastoff.  Credit: ISRO.  Watch ISRO’s Live  Webcast
It’ s a Mind-Blowing Midnight Marvel ! Fueled PSLV rocket and India’s Mars Orbiter Mission (MOM) await Nov. 5 blastoff. Credit: ISRO

…………….

Learn more about MAVEN, MOM, Mars rovers, Orion and more at Ken’s upcoming presentations

Nov 14-19: “MAVEN Mars Launch and Curiosity Explores Mars, Orion and NASA’s Future”, Kennedy Space Center Quality Inn, Titusville, FL, 8 PM

Dec 11: “Curiosity, MAVEN and the Search for Life on Mars”, “LADEE & Antares ISS Launches from Virginia”, Rittenhouse Astronomical Society, Franklin Institute, Phila, PA, 8 PM

Blastoff of the Indian developed Mars Orbiter Mission (MOM) on Nov. 5, 2013 from the Indian Space Research Organization’s (ISRO) Satish Dhawan Space Centre SHAR, Sriharikota. Credit: ISRO