A Challenging Series of Occultations of Spica by the Moon Coming to a Sky Near You

An occultation of the star Mu Geminorum (to the upper right off the dark limb of the Moon) Photo by author.

The first in a cycle of challenging occultations of the bright star Spica for northern hemisphere observers begins this coming Monday on August 12th.

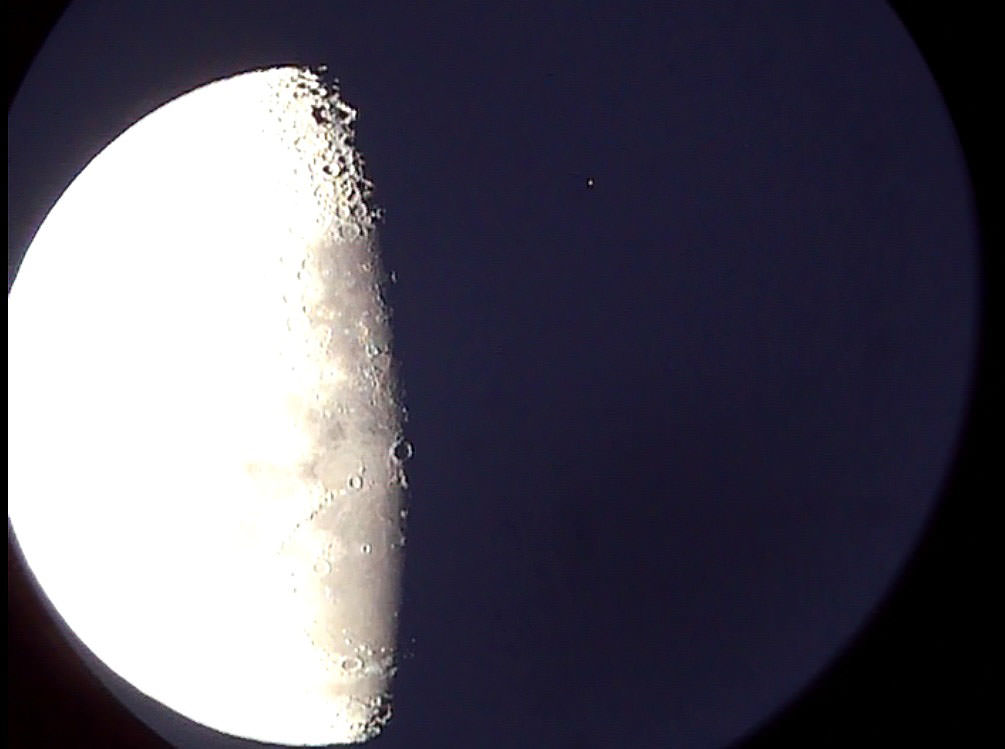
Watching a bright star or planet wink out on the dark limb of the Moon can be an amazing event to witness. It’s an abrupt “now you see it, now you don’t” event in a universe which often seems to move at an otherwise glacial pace. And if the event grazes the limb of the Moon, an observer may see a series of winks as the starlight streams through the lunar valleys.

Close companion stars have been discovered during occultations, and astronomers even used a series of occultations of radio source 3C 273 in 1962 to pin down the position of the first quasar.

An occultation occurs when one object passes in front of another as seen from the observer’s vantage point. The term has its hoary roots back in a time when astronomy was intertwined with its pseudoscience ancestor of astrology. Even today, I still get funny looks from non-astronomy friends when I use the term occultation, as if it just confirms their suspicions of the arcane arts that astronomers really practice in secret.

But back to reality-based science. At an apparent magnitude of +1.1, Spica is the 3rd brightest star that the Moon can occult along its five degree path above and below the plane of the ecliptic. It’s also one of only four stars brighter than +1.4 magnitude on the Moon’s path. The others are Antares (magnitude +1.0), Regulus (magnitude +1.4), and Aldebaran (magnitude +0.8). All of these are bright enough to be visible on the lunar limb through binoculars or a telescope in the daytime if conditions are favorable.

It’s interesting to note that this situation also changes over time due to the precession of the equinoxes. For example, the bright star Pollux was last occulted by the Moon in 117 BC, but cannot be covered by the Moon in our current epoch.

Spica is currently in the midst of a cycle of 21 occultations by our Moon. This cycle started in July 25th, 2012 and will end in January 2014.

Spica is a B1 III-IV type star 10 times the mass of the Sun. At 260 light years distant, Spica is one of the closest candidates to the Earth along with Betelgeuse to go supernova. Now, THAT would make for an interesting occultation! Both are safely out of the ~100 light year distant “kill zone”.

What follows are the circumstances for the next four occultations of Spica by the Moon. The times are given for closest geocentric conjunction of the two objects. Actual times of disappearance and reappearance will vary depending on the observer’s location. Links are provided for each event which include more info.

Starry Night
Looking westward 30 minutes after sunset for North American viewers on the night of August 12th. (Created by the Author using Starry Night).

First up is the August 12th occultation of Spica, which favors Central Asia and the Asian Far East. This will occur late in the afternoon sky around 09:00 UT  and prior to sunset. The waxing crescent Moon will be six days past New phase. North American observers will see the Moon paired five degrees from Spica with Saturn to the upper left on the evening of August 12th.

Occult
The footprint for the September 8th occultation of Spica by the Moon. Note that the broken line indicates where the occultation will take place in the daytime sky. ( Credit: Occult 4.1.0.2)

Next is the September 8th daytime occultation of Spica for Europe, the Middle East and northern Africa around ~15UT. This will be a challenge, as the Moon will be a waxing crescent at only 3 days past New. Observers in the Middle East will have the best shot at this event, as the occultation occurs at dusk and before moonset. Note that the Moon also occults Venus six hours later for Argentina and Chile.

Stellarium
Looking to the east the morning of November 2nd for North American observers. (Created by the author using Stellarium).

After taking a break in October (the occultation of October 5 occurs only 23 hours after New and is unobservable), the Moon again occults Spica on November 2nd for observers across Europe & Central Asia. This will be a difficult one, as the Moon will be only 20 hours from New and a hybrid solar eclipse that will cross the Atlantic and central Africa. It may be possible to lock on to the Moon and track it up into the daylight, just be sure to physically block the rising Sun behind a building or hill!

USNO
The occultation footprint of Spica by the Moon for November 29th, 2013.  (Reproduced from the Astronomical Almanac online and produced by the U.S. Naval Observatory and H.M. Nautical Almanac Office).

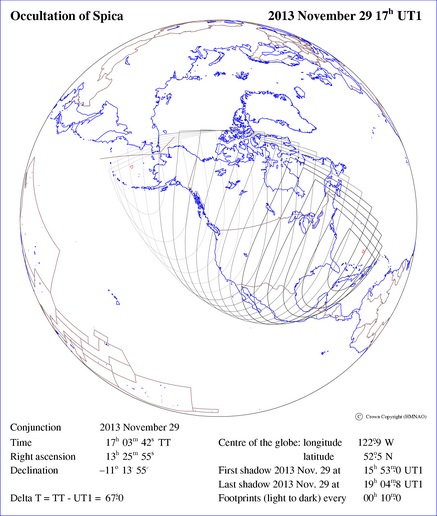
Finally, the Moon will occult Spica for North American observers on November 29th centered on 17:03 UT. This will place the event low in the nighttime sky for Alaskan observers. It’ll be a bit more of a challenge for Canadian and U.S. observers in the lower 48, as the Moon & Spica will be sandwiched between the Sun and the western horizon in the mid-day sky. As an added treat, comet C/2012 S1 ISON will reach perihelion on November 28th, just 20 hours prior and will be reaching peak brilliance very near the Sun.

And as an added bonus, the Moon will be occulting the +2.8 star Alpha Librae (Zubenelgenubi) on August 13th for central South America.

All of these events are challenges, to be sure. Viewers worldwide will still catch a close night time pairing of the Moon and Spica on each pass. We’ve watched the daytime Moon occult Aldebaran with binoculars while stationed in Alaska back in the late 1990’s, and can attest that such a feat of visual athletics is indeed possible.

And speaking of which, the next bright star due for a series of occultations by the Moon is Aldebaran starting in 2015. After 2014, Spica won’t be occulted by the Moon again until 2024.

But wait, there’s more- the total eclipse of the Moon occurring on April 15th 2014 occurs just 1.5 degrees from Spica, favoring North America. This is the next good lunar eclipse for North American observers, and one of the best “Moon-star-eclipse” conjunctions for this century. Hey, at least it’ll give U.S. observers something besides Tax Day to look forward to in mid-April. More to come in 2014!

New 3-D Map Shows Large Scale Structures in the Universe 9 Billion Years Ago

The FastSound project's 3D map of the large-scale structure of a region in the Universe about 4.7 billion years after the Big Bang. This area covers 2.5 times 3 degrees of the sky, with a radial distance spanning 12-14.5 billion light years in comoving distance or 8-9.6 billion light years in light travel distance. Credit: NAOJ, SDSS, CFHT.

I remember seeing the Hubble 3-D IMAX movie in 2010 and literally gasping when the view pulled back from zooming into distant stars and galaxies to show clusters and superclusters of galaxies interwoven like a web, creating the large scale structure of the Universe. In 3-D, the structure looks much like the DNA double helix or a backbone.

Now, a new project that aims to map the Universe’s structure has looked back in time to create a 3-D map showing a portion of the Universe as it looked nine billion years ago. It shows numerous galaxies and interestingly, already-developed large-scale structure of filaments and voids made from galaxy groups.


The map was created by the FastSound project, which is surveying galaxies in the Universe using the Subaru Telescope’s new Fiber Multi-Object Spectrograph (FMOS). The team doing the work is from Kyoto University, the University of Tokyo and the University of Oxford.

The team said that although they can see that the clustering of galaxies is not as strong back when the Universe was 4.7 billion years old as it is in the present-day Universe, gravitational interaction will eventually result in clustering that grows to the current level.

The new map spans 600 million light years along the angular direction and two billion light years in the radial direction. The team will eventually survey a region totaling about 30 square degrees in the sky and then measure precise distances to about 5,000 galaxies that are more than ten billion light years away.

This is not the first 3-D map of the Universe: the Sloan Digital Sky Survey created one in 2006 with coverage up to five billion light years away, and it was updated just last year, and a video flythough was created, which you can watch above. Also, earlier this year the University of Hawaii created a 3-D video map showing large scale cosmic structure out to 300 million light years.

But the FastSound project hopes to create a 3-D map of the very distant Universe by covering the volume of the Universe farther than ten billion light years away. FMOS is a wide-field spectroscopy system that enables near-infrared spectroscopy of over 100 objects at a time, with an exceptionally wide field of view when combined with the light collecting power of the 8.2 meter primary mirror of the telescope.

The map released today is just the first from FastSound. The final 3-D map of the distant Universe will precisely measure the motion of galaxies and then measure the rate of growth of the large-scale structure as a test of Einstein’s general theory of relativity.

Although scientists know that the expansion of the Universe is accelerating, they do not know why – whether it is from dark energy or whether gravity on cosmological scales may differ from that of general relativity, this mystery is one of the biggest questions in contemporary physics and astronomy. A comparison of the 3D map of the young Universe with the predictions of general relativity could eventually reveal the mechanism for the mysterious acceleration of the Universe.

The team said their 3-D map shown in this release uses a measure of “comoving” distance rather than light travel distance. They explained:

Light travel distance refers to the time that has elapsed from the epoch of the observed distant galaxy to the present, multiplied by the speed of light. Since the speed of light is always constant for any observer, it describes the distance of the path that a photon has traveled. However, the expansion of the Universe increases the length of the path that the photon traveled in the past. Comoving distance, the geometrical distance in the current Universe, takes this effect into account. Therefore, comoving distance is always larger than the corresponding light travel distance.

In the lead image above from FastSound, the colors of the galaxies indicate their star formation rate, i.e., the total mass of stars produced in a galaxy every year. The gradation in background color represents the number density of galaxies; the underlying mass distribution (which is dominated by invisible dark matter that accounts for about 30% of the total energy in the Universe) and how it would look like this if we could see it. The lower part of the figure shows the relative locations of the FastSound and the Sloan Digital Sky Survey (SDSS) regions, indicating that the FastSound project is mapping a more distant Universe than SDSS’s 3D map of the nearby Universe.

Find out more about FastSound here.

Source: Subaru Telescope

Launch Gallery: Delta 4 Sends Military Satellite to Orbit

Clear of the launch utility tower, the Delta IV Medium+ and its WGS-6 payload begin the climb uphill. Credit: John O'Connor/nasatech.net

Who doesn’t like a good launch? These images and videos from last night’s launch of United Launch Alliance’s Delta 4 rocket are just pretty. The rocket boosted an international military communications satellite to orbit following a beautiful night-time launch from Cape Canaveral Air Force Station at 8:29 pm EDT on August 7 (00:29 UTC on August 8, 2013). The 21-story-tall Delta 4 included four solid-fuel strap-on boosters for extra oomph. As @OxyAstro said on Twitter last night, “I like to think of the Delta IV as an apartment building sitting on a few million lbs of thrust.”

Images here are from John O’Connor at Nasatech.net, and enjoy a close-up video of the launch, below, from Matthew Travis.

A standard video view of the launch is below.

On board was the WGS-6 (Wideband Global Satcom)a big 6,000 kg (13,200 lb) satellite that is part of a military communications network shared by the United States, Australia, Canada, Denmark, Luxembourg, the Netherlands and New Zealand.

As flames from the hydrogen-rich ignition coil around the boosters the RS-68 main engine comes up to full power. Credit: John O'Connor/nasatech.net
As flames from the hydrogen-rich ignition coil around the boosters the RS-68 main engine comes up to full power. Credit: John O’Connor/nasatech.net

Rising from the launch table the Delta IV/WGS-6 mission begins. Credit: John O'Connor/nasatech.net
Rising from the launch table the Delta IV/WGS-6 mission begins. Credit: John O’Connor/nasatech.net
Clear of the lightning towers the WGS-6 mission streaks to super-sync geo orbit. Credit: John O'Connor/nasatech.net.
Clear of the lightning towers the WGS-6 mission streaks to super-sync geo orbit. Credit: John O’Connor/nasatech.net.

Why Do Stars Twinkle?

Why Do Stars Twinkle?

Did you know you can distinguish between stars and planets in the sky?

Stars twinkle, planets don’t.

Okay, that’s not actually correct. The stars, planets, even the Sun and Moon twinkle, all in varying amounts. Anything outside the atmosphere is going to twinkle.

If you’re feeling a little silly using the word twinkle over and over again, we can also use the scientific term: astronomical scintillation.

You can’t feel it, but you’re carrying the entire weight of the atmosphere on your shoulders. Every single square inch of your skin is getting pushed by 15 pounds of pressure. And even though astronomers need our atmosphere to survive, it still drives them crazy. As it makes objects in space so much harder to see.

Stars twinkle, I mean scintillate, because as light passes down through a volume of air, turbulence in the Earth’s atmosphere refracts light differently from moment to moment. From our perspective, the light from a star will appear in one location, then milliseconds later, it’ll be distorted to a different spot.

We see this as twinkling.

So why do stars appear to twinkle, while planets don’t?

Stars appear as a single point in the sky, because of the great distance between us and them. This single point can be highly affected by atmospheric turbulence. Planets, being much closer, appear as disks.

We can’t resolve them as disks with our eyes, but it still averages out as a more stable light in the sky.

Astronomers battle atmospheric turbulence in two ways:

First, they try to get above it. The Hubble Space Telescope is powerful because it’s outside the atmosphere. The mirror is actually a quarter the size of a large ground-based observatory, but without atmospheric distortion, Hubble can resolve galaxies billions of light-years away. The longer it looks, the more light it gathers.

Second, they try to compensate for it.

Some of the most sophisticated telescopes on Earth use adaptive optics, which distorts the mirror of the telescope many times a second to compensate for the turbulence in the atmosphere.

A beam from the Laser Star Guide on one of the VLT's four Unit Telescopes helps to correct the blurring effect of Earth's atmosphere before making observations (ESO/Y. Beletsky)
A beam from the Laser Star Guide on one of the VLT’s four Unit Telescopes helps to correct the blurring effect of Earth’s atmosphere before making observations (ESO/Y. Beletsky)
Astronomers project a powerful laser into the sky, creating an artificial star within their viewing area. Since they know what the artificial star should look like, they distort the telescope’s mirror with pistons cancelling out the atmospheric distortion. While it’s not as good as actually launching a telescope into space, it’s much, much cheaper.

Now you know why stars twinkle, why planets don’t seem to twinkle as much, and how you can make all of them stop.

We have written many articles about stars here on Universe Today. Here’s an article that talks about a technique astronomers use to minimize the twinkle of the Earth’s atmosphere.

If you’d like more information on stars, check out Hubblesite’s News Releases about Stars, and here’s the stars and galaxies homepage.

We have recorded several episodes of Astronomy Cast about stars. Here are two that you might find helpful: Episode 12: Where Do Baby Stars Come From, and Episode 13: Where Do Stars Go When they Die?

The Soyuz Rocket and Launch Sequence Explained

A Soyuz rocket on the launchpad at the Baikonur Cosmodrome in December, 2012. Credit: NASA.

Want to know more about the Soyuz rocket? This new video from ESA is based on actual lessons for astronauts about the Soyuz rocket and describes the parts of the Soyuz, the stages and launch sequence. The info here was part of ESA Basic Training for the ESA astronaut class of 2009 (also known as the Shenanigans09).

Apollo 15: “Stand by for a Hard Impact”

Only two of three parachutes worked correctly for the return of Apollo 15. Credit: NASA.

On this day in history, the crew of Apollo 15 returned home from their mission to the Moon. But the splashdown in the Pacific Ocean wasn’t without a little drama. One of the three parachutes failed to open fully, but astronauts Dave Scott, Al Worden, and Jim Irwin didn’t know it until they were almost ready to hit the ocean.

“Apollo 15, this is Okinawa. You have a streamed chute. Stand by for a hard impact.”

(You can read the entire transcript here.)

The recovery ship, USS Okinawa radioed to the crew that one parachute was not inflated. Technically, the Apollo capsule really only needed two chutes to land, with the third being for redundancy, but still, the landing was harder than other Apollo missions. However, no damage or injury resulted.

Experts looking at this photo say that two or three of the six riser legs on the failed parachute were missing, and after looking into the issue, it was determined that excess fuel burning from the Command Module Reaction Control System likely caused the lines to break.

Apollo 15 landed about about 320 miles (515 kilometers) north of Hawaii.

GRB Lights Up Ancient Hidden Galaxy

This artist's illustration depicts a gamma-ray burst illuminating clouds of interstellar gas in its host galaxy. By analyzing a recent gamma-ray burst, astronomers were able to learn about the chemistry of a galaxy 12.7 billion light-years from Earth. They discovered it contains only one-tenth of the heavy elements (metals) found in our solar system. Credit: Gemini Observatory/AURA, artwork by Lynette Cook

Once upon a time, more than 12.7 billion years ago, a star was poised on the edge of extinction. It made its home in a galaxy too small, too faint and too far away to even be spotted by the Hubble Space Telescope. Not that it would matter, because this star was going to end its life before the Earth formed. As it blew itself apart, it expelled its materials in twin jets which ripped through space at close to the speed of light – yet the light of its death throes outshone its parent galaxy by a million times.

“This star lived at a very interesting time, the so-called dark ages just a billion years after the Big Bang,” says lead author Ryan Chornock of the Harvard-Smithsonian Center for Astrophysics (CfA).

“In a sense, we’re forensic scientists investigating the death of a star and the life of a galaxy in the earliest phases of cosmic time,” he adds.

When this unsung star expired, it created one of the scariest things in astronomy… a gamma-ray burst (GRB). However, it wasn’t just a normal, garden variety GRB – it was long one, lasting more than four minutes. After century upon century of travel, the light reached our little corner of the Universe and was detected by NASA’s Swift spacecraft on June 6th. Chornock and his team quickly organized follow-up observations by the MMT Telescope in Arizona and the Gemini North telescope in Hawaii.

“We were able to get right on target in a matter of hours,” Chornock says. “That speed was crucial in detecting and studying the afterglow.”

Time to kick back and have a smoke? In a sense. The “afterglow” of a GRB happens when the jets impact the surrounding gas in an almost tsunami-like effect. As it sweeps up the material, it begins to heat and glow. As this light traverses the parent galaxy, it impacts clouds of interstellar gas, illuminating their spectra. Through these chemical signatures, astronomers are able to ascertain what gases the distant galaxy may have contained. As we know, all chemical elements heavier than hydrogen, helium, and lithium are the product of stars. Researchers refer to this as “metal content” and it takes a certain amount of time to accumulate. In the scheme of creation, the elements necessary for life – carbon and oxygen – didn’t exist. What Chornock and his team discovered was the GRB galaxy was host to only about a tenth of the “metals” in our solar system. What does that mean? In the eyes of the astronomers, rocky planets might have been able to form in that far away galaxy, but chances are good that life could not.

“At the time this star died, the universe was still getting ready for life. It didn’t have life yet, but was building the required elements,” says Chornock.

At a redshift of 5.9, or a distance of 12.7 billion light-years, GRB 130606A is one of the most distant gamma-ray bursts ever found.

“In the future we will be able to find and exploit even more distant GRBs with the planned Giant Magellan Telescope,” says Edo Berger of the CfA, a co-author on the publication.

Original Story Source: Harvard Smithsonian Center for Astrophysics News Release.

Astronauts Wax Poetic About Seeing Earth from Space

An aurora seen from the International Space Station on September 26, 2011. Credit: NASA.

Astronauts have tried to explain the view of Earth from space, with many saying that there just aren’t the words to describe how beautiful it is. In the latest episode of the “Science Garage,” recent ISS astronauts Tom Marshburn and Chris Hadfield might do the best job so far of relating not only the “incredible and unwrapping perspective of looking at the Earth,” but how it changed their perspective of humanity. Hadfield compares coming into the cupola of the International Space Station as being like “entering the Sistine Chapel.”

Watch below:


Watch Sprite Lightning Flash at 10,000 frames Per Second

Elusive sprite lightning captured from an airplane above Boulder, Colorado as part of a sprite observing campaign. Credit and copyright: Jason Ahrns.

Mysterious red sprite lightning is intriguing: sprites occur only at high altitudes above thunderstorms, only last for a thousandth of a second and emit light in the red portion of the visible spectrum. Therefore, studying sprites has been notoriously difficult for atmospheric scientists. Astrophotographer Jason Ahrns has had the chance to be part of a sprite observing campaign, and with a special airplane from the National Center for Atmospheric Research’s Research Aircraft Facility in Boulder, Colorado, has been on flights to try and observe red sprite lightning from the air.

Jason had some success on a recent flight, and was able to capture a sprite (above) on high speed film. Below you can see a movie of it at 10,000 frames per second:

Pretty amazing!

Scientists say that while sprites have likely occurred on Earth for millions of years, they were first discovered and documented only by accident in 1989 when a researcher studying stars was calibrating a camera pointed at the distant atmosphere where sprites occur.

Sprites usually appear as several clusters of red tendrils above a lighting flash followed by a breakup into smaller streaks. The brightest region of a sprite is typically seen at altitudes of 65-75 km (40-45 miles), but often as high as 90 km (55 miles) into the atmosphere.

Some of the latest research shows that only a specific type of lightning is the trigger that initiates sprites aloft.

You can read more (and see more images) about Jason’s experiences with sprites at his website.

Ancient Astronomical Calendar Discovered in Scotland Predates Stonehenge by 6,000 Years

A wintertime rising gibbous Moon. (Image credit: Art Explosion).

A team from the University of Birmingham recently announced an astronomical discovery in Scotland marking the beginnings of recorded time.

Announced last month in the Journal of Internet Archaeology, the Mesolithic monument consists of a series of pits near Aberdeenshire, Scotland. Estimated to date from 8,000 B.C., this 10,000 year old structure would pre-date calendars discovered in the Fertile Crescent region of the Middle East by over 5,000 years.

But this is no ordinary wall calendar.

Originally unearthed by the National Trust for Scotland in 2004, the site is designated as Warren Field near the town of Crathes. It consists of 12 pits in an arc 54 metres long that seem to correspond with 12 lunar months, plus an added correction to bring the calendar back into sync with the solar year on the date of the winter solstice.

Diagram...
A diagram of the Warren Field site, showing the 12 pits (below) and the alignment with the phases of the Moon plus the rising of the winter solstice Sun. Note: the scale should read “0-10  metres.” (Credit: The University of Birmingham).

“The evidence suggests that hunter-gatherer societies in Scotland had both the need and sophistication to track time across the years, to correct for seasonal drift of the lunar year” said team leader and professor of Landscape Archaeology at the University of Birmingham Vince Gaffney.

We talked last week about the necessity of timekeeping as cultures moved from a hunter-gatherer to agrarian lifestyle. Such abilities as marking the passage of the lunar cycles or the heliacal rising of the star Sirius gave cultures the edge needed to dominate in their day.

For context, the pyramids on the plains of Giza date from around 2500 B.C., The Ice Man on display in Bolzano Italy dates from 3,300 B.C., and the end of the last Ice Age was around 20,000 to 10,000 years ago, about the time that the calendar was constructed.

“We have been taking photographs of the Scottish landscape for nearly 40 years, recording thousands of archaeological sites that would never have been detected from the ground,” said manager of Aerial projects of the Royal Commission of Aerial Survey Projects Dave Cowley. “It’s remarkable to think that our aerial survey may have helped to find the place where time was invented.”

The site at Warren Field was initially discovered during an aerial survey of the region.

Vince Gaffney professor of Landscape and Archaeology at University of Birmingham in Warren Field, Crathes, Aberdeenshire where the discovery was made.
Vince Gaffney, professor of Landscape and Archaeology at University of Birmingham in Warren Field, Crathes, Aberdeenshire where the discovery was made. (Credit: The University of Birmingham).

The use of such a complex calendar by an ancient society also came as a revelation to researchers. Emeritus Professor of Archaeoastronomy at the University of Leicester Clive Ruggles notes that the site “represents a combination of several different cycles which can be used to track time symbolically and practically.”

The lunar synodic period, or the span of time that it takes for the Moon to return to the same phase (i.e., New-to-New, Full-to-Full, etc) is approximately 29.5 days. Many cultures used a strictly lunar-based calendar composed of 12 synodic months. The Islamic calendar is an example of this sort of timekeeping still in use today.

However, a 12 month lunar calendar also falls out of sync with our modern Gregorian calendar by 11 days (12 on leap years) per year.

The familiar Gregorian calendar is at the other extreme, a calendar that is strictly solar-based.  The Gregorian calendar was introduced in 1582 and is still in use today. This reconciled the 11 minute per year difference between the Julian calendar and the mean solar year, which by the time of Pope Gregory’s reform had already caused the calendar to “drift” by 10 days since the 1st Council of Nicaea 325 AD.

Artist’s conception of the Warren Field site during the winter solstice. (Credit: The University of Birmingham). Credit: The University of Birmingham

Surprisingly, the calendar discovered at Warren Field may be of a third and more complex variety, a luni-solar calendar. This employs the use of intercalary periods, also known as embolismic months to bring the lunar and solar calendar back into sync.

The modern Jewish calendar is an example of a luni-solar hybrid, which adds an extra month (known as the 2nd Adar or Adar Sheni) every 2-3 years. This will next occur in March 2014.

The Greek astronomer Meton of Athens noted in 5th century B.C. that 235 synodic periods very nearly add up to 19 years, to within a few hours. Today, this period bears his name, and is known as a metonic cycle. The Babylonian astronomers were aware of this as well, and with the discovery at Warren Field, it seems that ancient astronomers in Scotland may have been moving in this direction of advanced understanding as well.

It’s interesting to note that the site at Warren Field also predates Stonehenge, the most famous ancient structure in the United Kingdom by about 6,000 years. 10,000 years ago would have also seen the Earth’s rotational north celestial pole pointed near the +3.9th magnitude star Rukbalgethi Shemali (Tau Herculis) in the modern day constellation of Hercules. This is due to the 26,000 year wobble of our planet’s axis known as the precession of the equinoxes.

The precession of the north celestial pole over millenia. (Credit: Wikimedia Commons graphic under a Creative Commons Attribution 2.5 Generic license. Author: Tau'olunga).
The precession of the north celestial pole over millennia. (Credit: Wikimedia Commons graphic under a Creative Commons Attribution 2.5 Generic license. Author: Tau’olunga).

The Full Moon nearest the winter solstice also marks the “Long Nights Moon,” when the Full Moon occupies a space where the Sun resides during the summer months and  rides high above the horizon for northern observers all night. The ancients knew of the five degree tilt that our Moon has in relation to the ecliptic and how it can ride exceptionally high in the sky every 18.6 years. We’re currently headed towards a ‘shallow year’ in 2015, where the Moon rides low in relation to the ecliptic. From there, the Moon’s path in the sky will get progressively higher each year, peaking again in 2024.

Who built the Warren Field ruins along the scenic Dee Valley of Scotland? What other surprises are in store as researchers excavate the site? One thing is for certain: the ancients were astute students of the sky. It’s fascinating to realize how much of our own history has yet to be told!