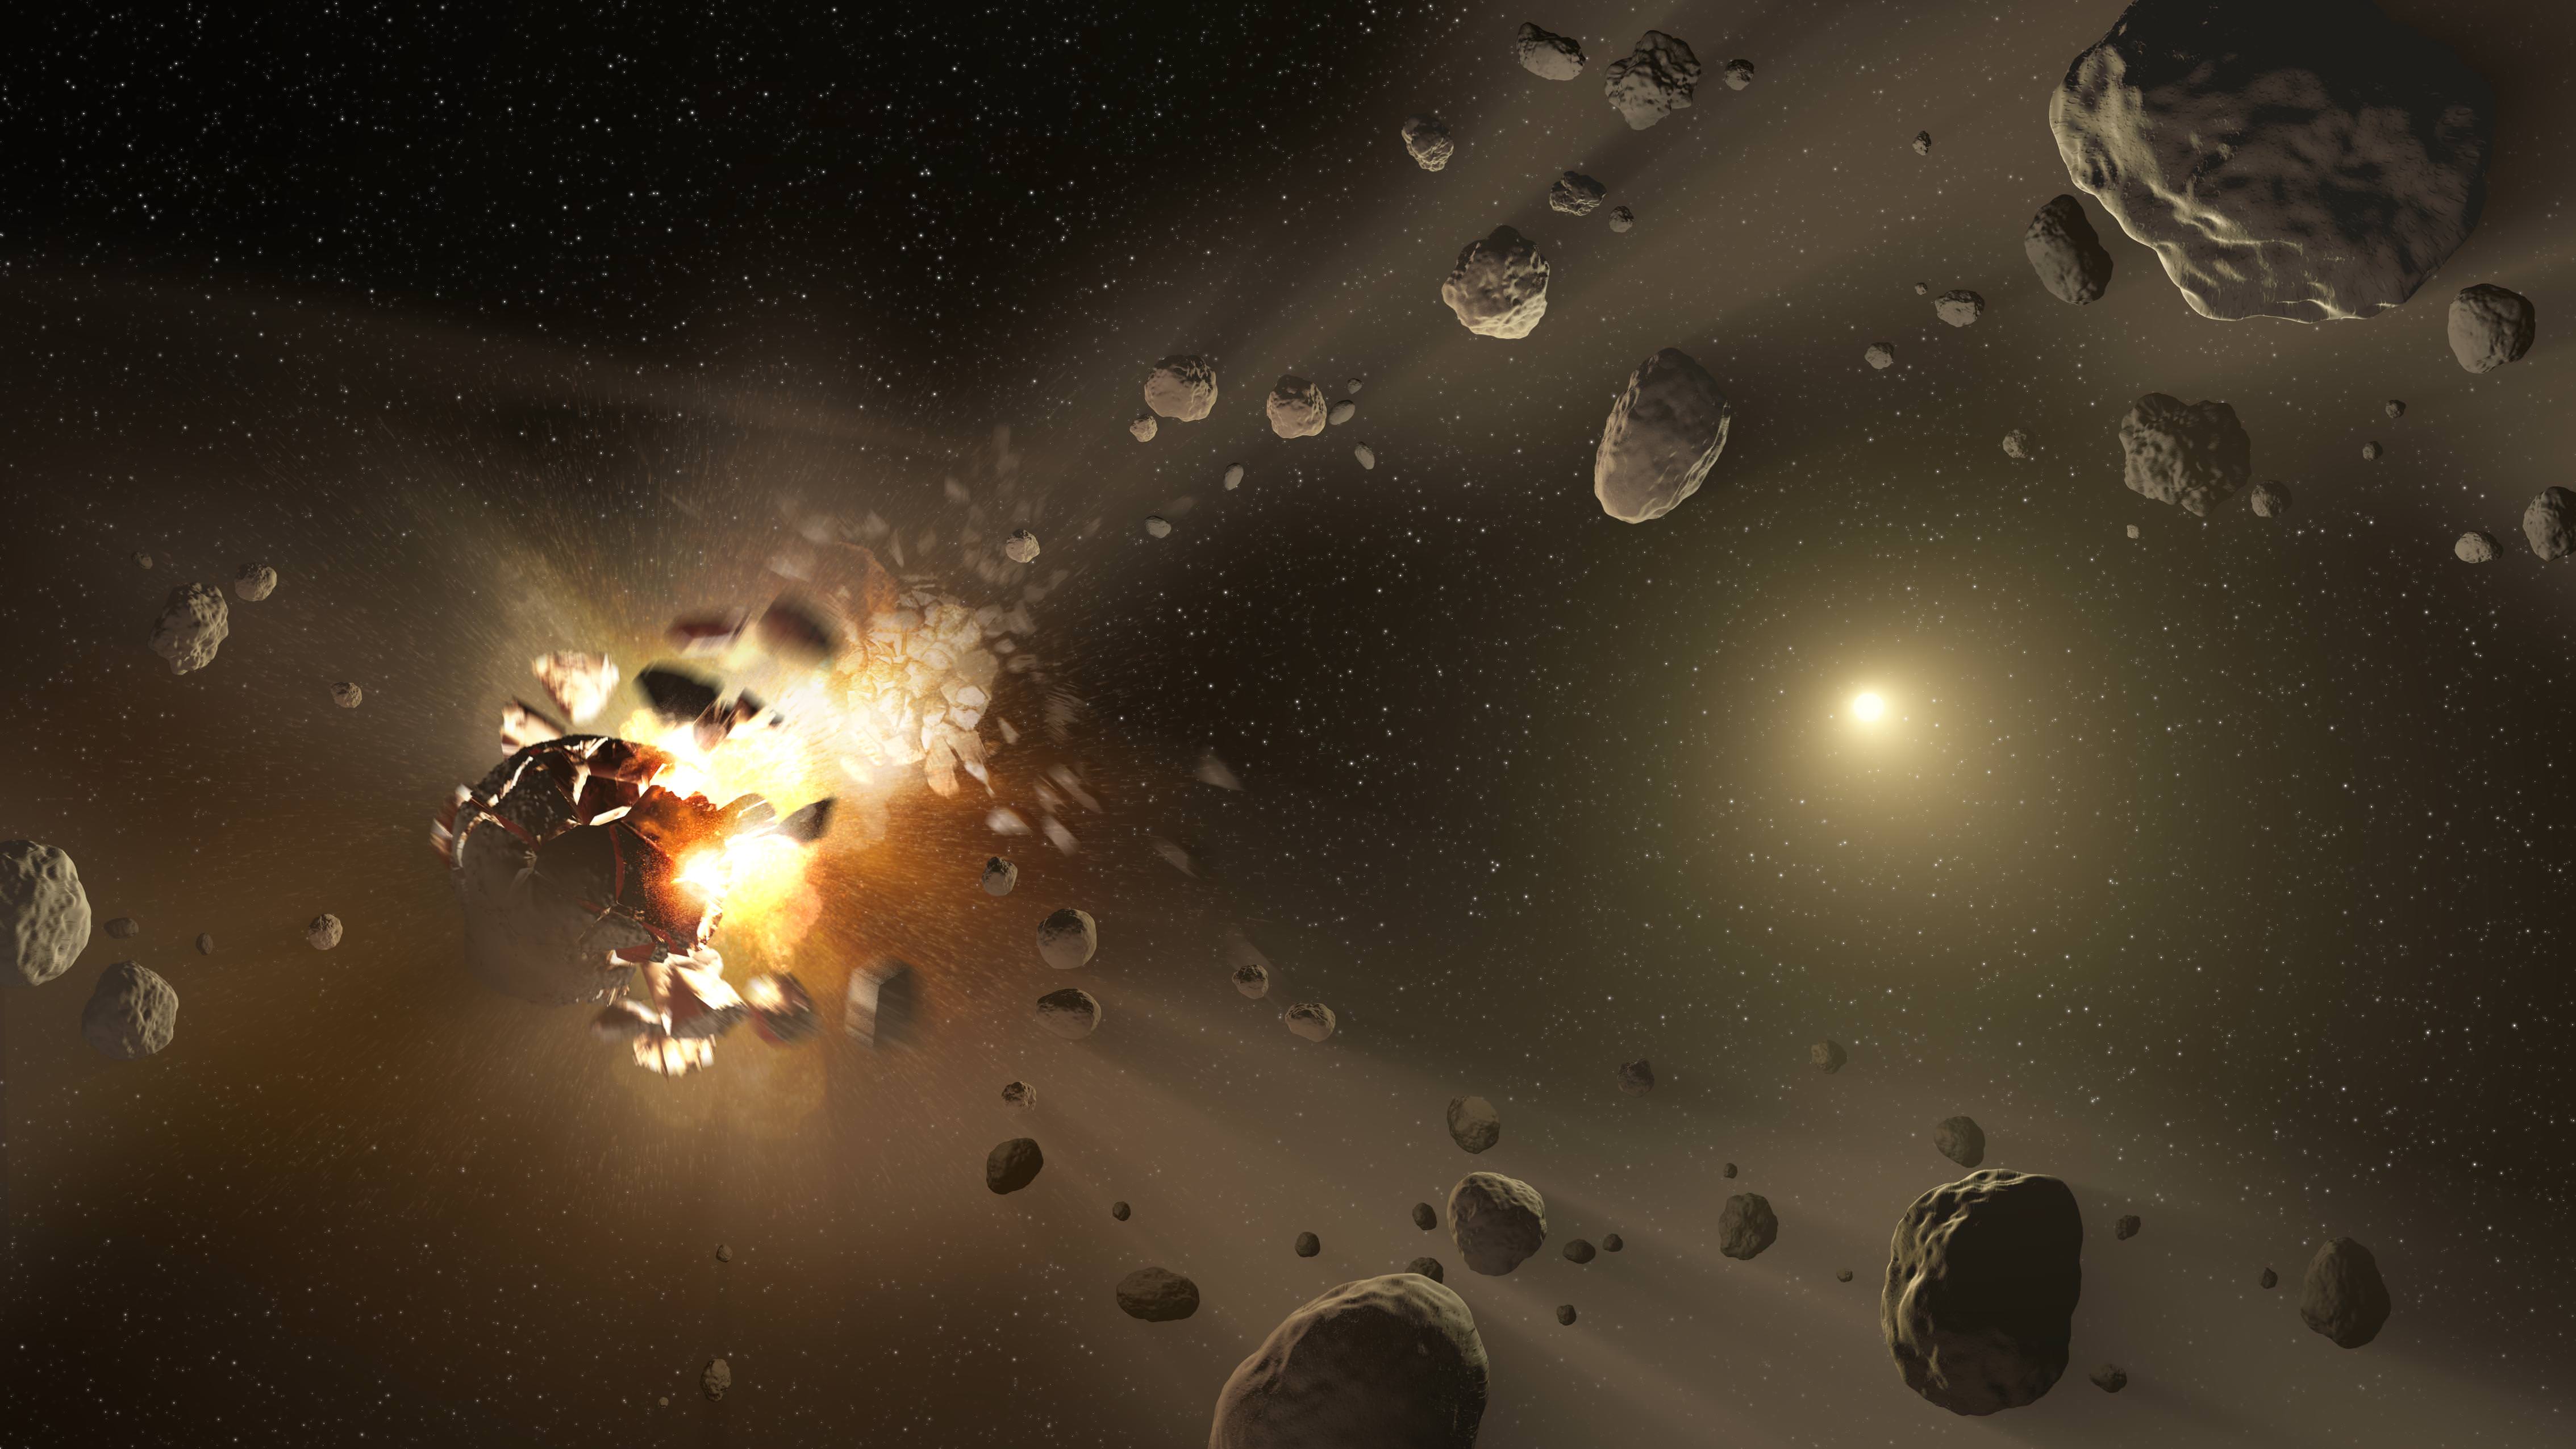
An artist's conception of an asteroid collision, in the belt between Mars and Jupiter. Credit: NASA/JPL-Caltech
In perhaps the neatest astronomical application of geneology yet, astronomers found 28 “hidden” families of asteroids that could eventually show them how some rocks get into orbits that skirt the Earth’s path in space.
From scanning millions of snapshots of asteroid heat signatures in the infrared, these groups popped out in an all-sky survey of asteroids undertaken by NASA’s orbiting Wide-Field Infrared Survey Explorer. This survey took place in the belt of asteroids between Mars and Jupiter, where most near-Earth objects (NEOs) come from.
NEOs, to back up for a second, are asteroids and comets that approach Earth’s orbit from within 28 million miles (45 million kilometers). Sometimes, a gravitational push can send a previously unthreatening rock closer to the planet’s direction. The dinosaurs’ extinction roughly 65 million years ago, for example, is widely attributed to a massive rock collision on Earth.
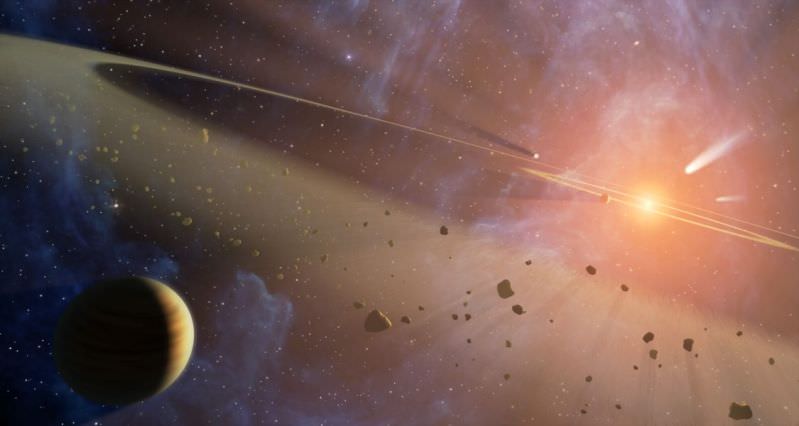
Artist concept of the asteroid belt between Mars and Jupiter. Credit: NASA
There are about 600,000 known asteroids between Mars and Jupiter, and the survey looked at about 120,000 of them. Astronomers then attempted to group some of them into “families”, which are best determined by the mineral composition of an asteroid and how much light it reflects.
While it’s hard to measure reflectivity in visible light — a big, dark asteroid reflects a similar amount of light as a small shiny one — infrared observations are harder to fool. Bigger objects give off more heat.
This allowed astronomers to reclassify some previously studied asteroids (which were previously grouped by their orbits), and come up with 28 new families.
“This will help us trace the NEOs back to their sources and understand how some of them have migrated to orbits hazardous to the Earth,” stated Lindley Johnson, NASA’s program executive for the Near-Earth Object Observation Program.
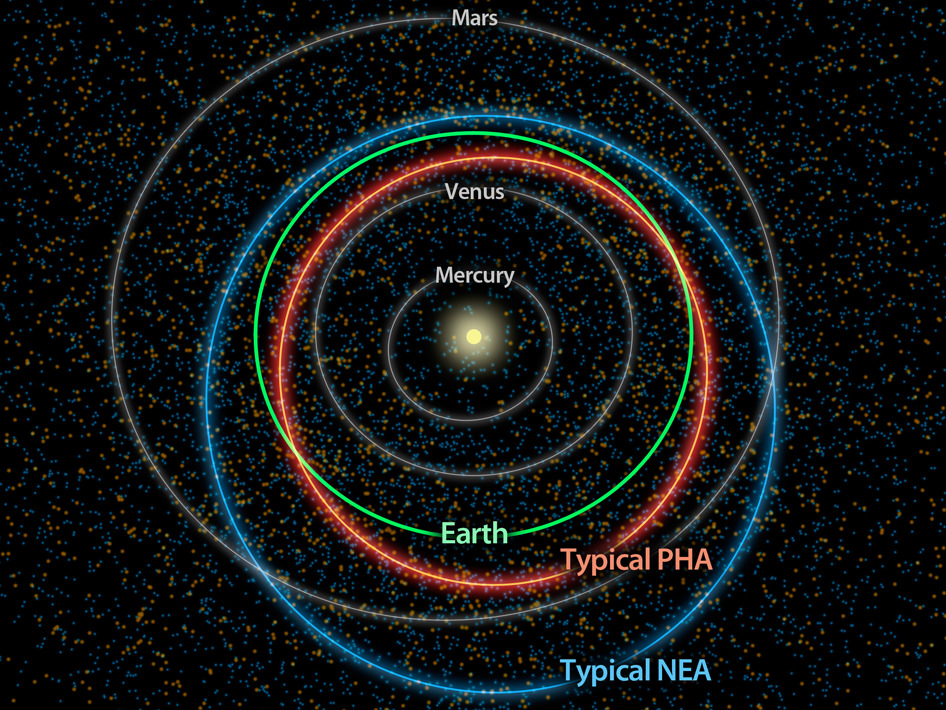
This diagram illustrates the differences between orbits of a typical near-Earth asteroid (blue) and a potentially hazardous asteroid, or PHA (orange). Image credit: NASA/JPL-Caltech
The astronomers next hope to study these different families to figure out their parent bodies. Astronomers believe that many asteroids we see today broke off from something much larger, most likely through a collision at some point in the past.
While Earthlings will be most interested in how NEOs came from these larger bodies and threaten the planet today, astronomers are also interested in learning how the asteroid belt formed and why the rocks did not coalesce into a planet.
The prevailing theory today says that was due to influences from giant Jupiter’s strong gravity, which to this day pulls many incoming comets and asteroids into different orbits if they swing too close. (Just look at what happened to Shoemaker-Levy 9 in 1994, for example.)
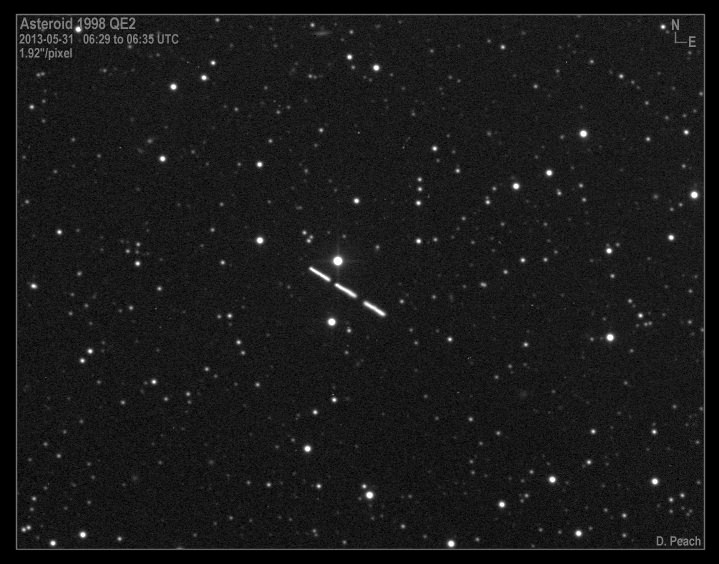
Asteroid 1998 QE2, taken on May 31, 2013 when it was 5.8 million km (3.6 million miles) from Earth and moving at around 21 arc mins per hour. The asteroid was quite bright at around magnitude 11. Credit and copyright: Damian Peach.
Will the flyby of Near Earth Asteroid 285263 (1998 QE2) reveal more surprises? NASA announced yesterday that radar images uncovered a previously unknown small moon orbiting the big asteroid. Now, observatories and amateurs around the world are taking a look at this big, dark space rock, which is about 2.7 kilometers (1.7 miles) in diameter. Here are some of the “early returns” just in!
This asteroid will pass 5.86 million km (3.64 million miles) from the Earth on Friday, May 31st at 20:59 Universal Time (UT) or 4:59PM EDT. That is about 15 times the distance between Earth and the Moon, so no worries. But it is not often an asteroid this big comes by within viewing range of observatories on Earth.
Asteroid (285263) 1998 QE2, on May 31, 2013, taken remotely from the H06 iTelescope Observatory in New Mexico. Credit and copyright: Ernesto Guido and Nick Howes, Remanzacco Observatory.
The Remanzacco Observatory team of Ernesto Guido and Nick Howes provided this image, above, and a great animation of the asteroid, as well:
Animation of (285263) 1998 QE2 on May 31, 2013 by E. Guido & N. Howes
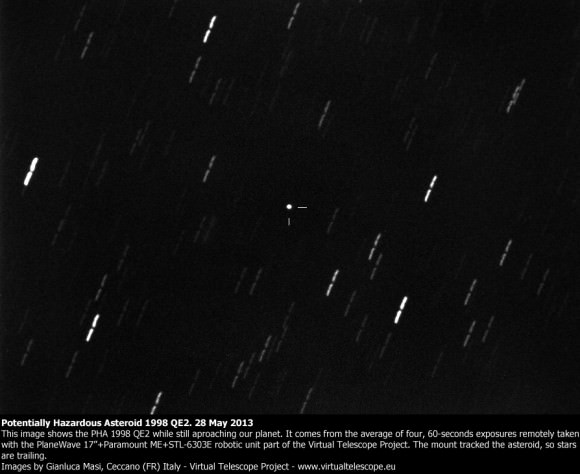
Asteroid 1998 QE2 on May 28, 2013. Credit and copyright: Gianluca Masi, Ceccano, Italy; Virtual Telescope Project.
Masi also provided a video from his May 30 observations:
Animation of Asteroid 1998 QE2, May 31, 2013 taken remotely with iTelescope T9. Credit and copyright: Ian Musgrave.
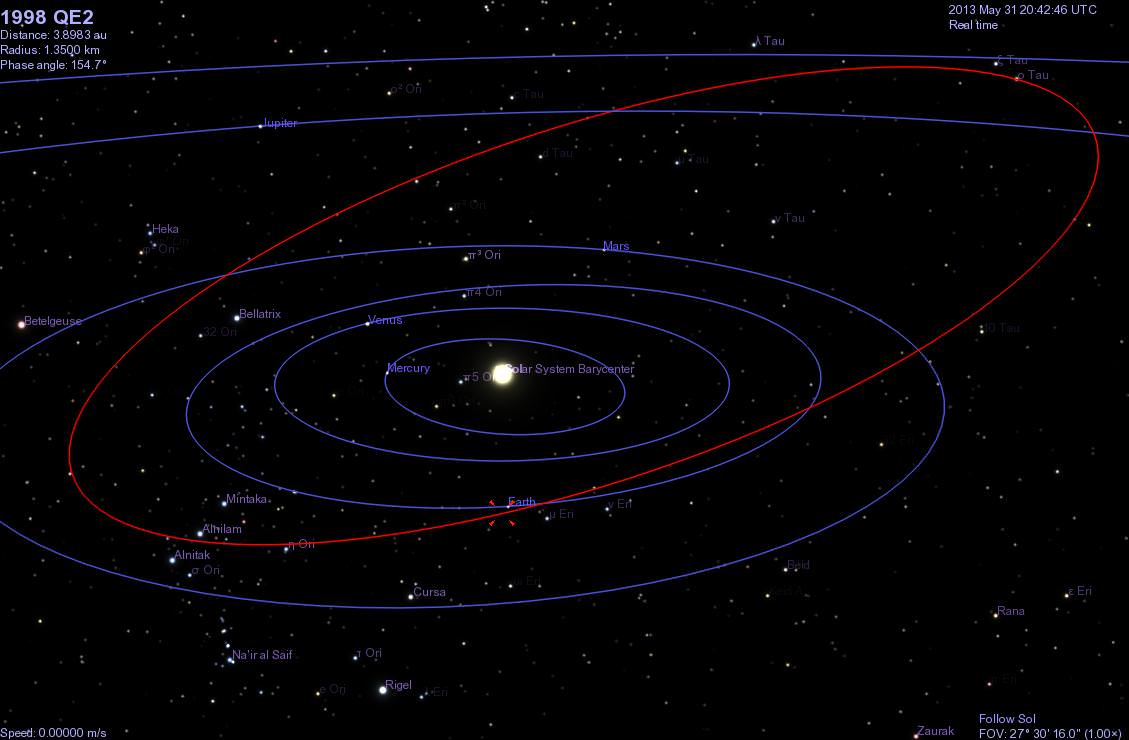
Here’s one from Ian Musgrave. If the animation isn’t working in your browser, click on the image to animate. Ian also has provided this graphic made from Celestia software to show Asteroid 1998 QE2’s orbit:
Orbit of 1998 QE2 simulated in Celestia at closest approach on May 31 20:59 UT. Via Ian Musgrave.
Want to try and see this asteroid for yourself? Our very own David Dickinson has written a great “how-to” for this object, but you are going to need a fairly large backyard telescope, since it will be about 100 times fainter than what can be seen with the naked eye, even at closest approach.
The Slooh online telescope will have views of online tomorrow, which you can watch at their website. The webcast will start at 20:30 UTC (4:30 p.m. EDT) on Friday, May 31.
Also, starting at 20:00 UTC (4:00 p.m. EDT), astrophysicist Gianluca Masi will have a webcast from the Virtual Telescope Project in Italy.
Also, if you want more asteroids, on Friday May 31, the White House is hosting an asteroid-themed “We the Geeks” Google+ Hangout starting at 2 p.m. EDT.
The live video conference will feature Bill Nye the Science Guy, JL Galache from the Minor Planet Center, former astronaut Ed Lu, NASA Deputy Administrator Lori Garver, and Peter Diamandis, co-founder of asteroid mining company Planetary Resources. They will discuss identification, resource potential and threat of asteroids. Here’s the link the White House’s Google+ page.
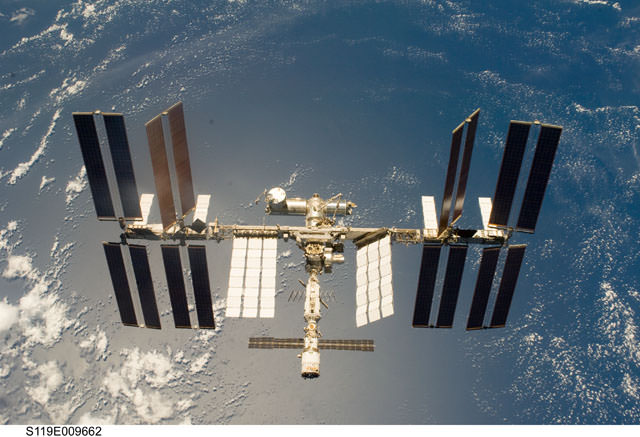
The International Space Station as seen from the crew of STS-119. (Credit: NASA).
Never seen the International Space Station before? Now is a good time to try, as we enter into a very special time of year.
Starting at 12:30 Universal Time/8:30 AM EDT on Monday, June 3rd, the ISS will enter a phase of permanent illumination throughout the length of its orbit. The station will remain in sunlight and will not experience an orbital sunset until five days later, when it briefly dips into the Earth’s shadow on June 8th at 11:50 UT/ 7:50 AM EDT.
This sets us up for a wealth of visible passes worldwide. This unique phenomenon occurs as a product of the station’s highly inclined orbit. Tilted at 51.6° with respect to the Earth’s equator, its orbit can be oriented roughly perpendicular to the Sun within a few weeks of either solstice.
But whereas the December solstice favors multiple summer sightings for the southern hemisphere, the season near the June solstice (which occurs this year on June 21st) favors northern latitudes. In fact, observers in the UK, southern Canada and the northern United States will be able to see multiple ISS passes in one night over the next week. Note that the ISS is nearly in full illumination now, and will remain so well into mid-June.
So, why was the ISS put into such a highly inclined orbit?
This orientation enables international partners to have access to the station from launch complexes worldwide. Whereas the shuttle launched on construction flights from Cape Canaveral at 28.5° north latitude, the Progress and crewed Soyuz missions depart from the Baikonur Cosmodrome in Kazakhstan located at 46° north. This resulted in some dramatic launches from the US Florida Space Coast, as the shuttle chased the ISS up the US Eastern Seaboard and was often visible minutes later crossing over the UK.
Though born of practicality, this happy circumstance also means that the ISS is visible to a wide swath of humanity located from 60° north latitude to 60° south. Only locales such as Antarctica, Greenland, and Iceland miss out.
I’m often asked how I know a moving star is a satellite and not an airplane. Aircraft flash, generating their own light, while satellites shine by reflected sunlight. This means that there’s a window of about an hour after sunset or before local sunrise that objects in low Earth orbit are still illuminated high overhead. In the early morning hours, if often seems as if someone has just “flipped on a switch” and satellites suddenly become visible across the sky.
And yes, satellites can flash as well, but in most instances, this is due to tumbling or the observer catching a glint of sunlight off of a reflective panel or surface just right. The Iridium constellation of satellites is known for this effect, but the ISS and Hubble Space Telescope can also flare in this fashion as well.
At 108.5 x 72.8 metres in size, the ISS is the largest man made object ever constructed in Earth orbit. Its unmistakable to spot as it passes overhead, shining at a maximum illumination brighter than the planet Venus at magnitude -5.2 when 100% illuminated.
Note the time the ISS is passing over your location and the direction its coming from and just start watching, no equipment required. It’s really as simple as that. Many prediction platforms exist for ISS passes. I’ve used Heavens-Above for over a decade now to spot ISS passes worldwide. Probably the simplest tracker out there is provided by Spaceweather. Just enter in your postal code and it kicks out an easy to decipher prediction. NASA also has a “Sighting Opportunities” webpage where you can choose your country and city to find out when the ISS will be passing over your location.
More advanced satellite trackers many want to check out CALSky which can also provide a list of transits of the ISS in front of the Sun or Moon from your location. I’ve managed to catch one each from my backyard utilizing it. I also like to use a free satellite tracking program known as Orbitron, which can be run on a laptop in the field away from an Internet connection.
Screenshot of the ISS orbital pass during full illumination next week. (Credit: Orbitron).
Photographing a pass of the ISS is easy. Just do a wide field exposure with a DSLR camera on a tripod for 10-30 seconds and you’ll get a picture of the ISS streaking across the starry background. Be sure to use manual mode and either set the focus to infinity or focus on something bright such as Venus just prior to the pass. I generally take a series of test exposures prior to get the combination of ISO/f-stop settings correct for the current sky conditions.
A 20 second exposure of the ISS during a July 4th fireworks show in 2011. (Photo by Author).
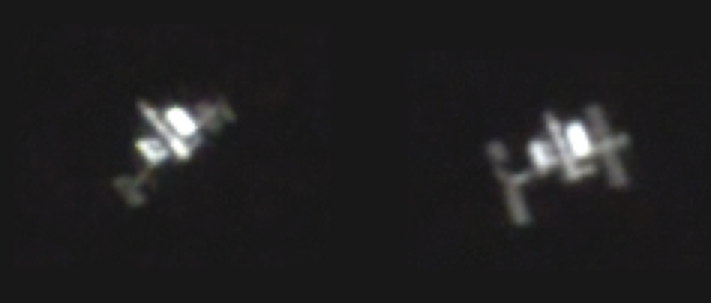
I can just make out structure on the ISS with binoculars as it passes overhead. This appearance can vary greatly depending on its orientation. Sometimes, it looks like a close binary star. Other times it can appear box-shaped. Occasionally, it looks like a tiny luminous Star Wars TIE-fighter!
The station managers typically orient the huge solar arrays to provide a small amount of artificial shadow during phases of full illumination. The ISS extends ~45” across at closest approach, similar in apparent diameter to Saturn including its ring system.
You can even image the ISS through a telescope, with a little skill and luck. Many sophisticated mounts will track the ISS as it crosses the sky, or you can use our own low-tech method;
Be sure to check out an ISS pass coming to a sky near you!
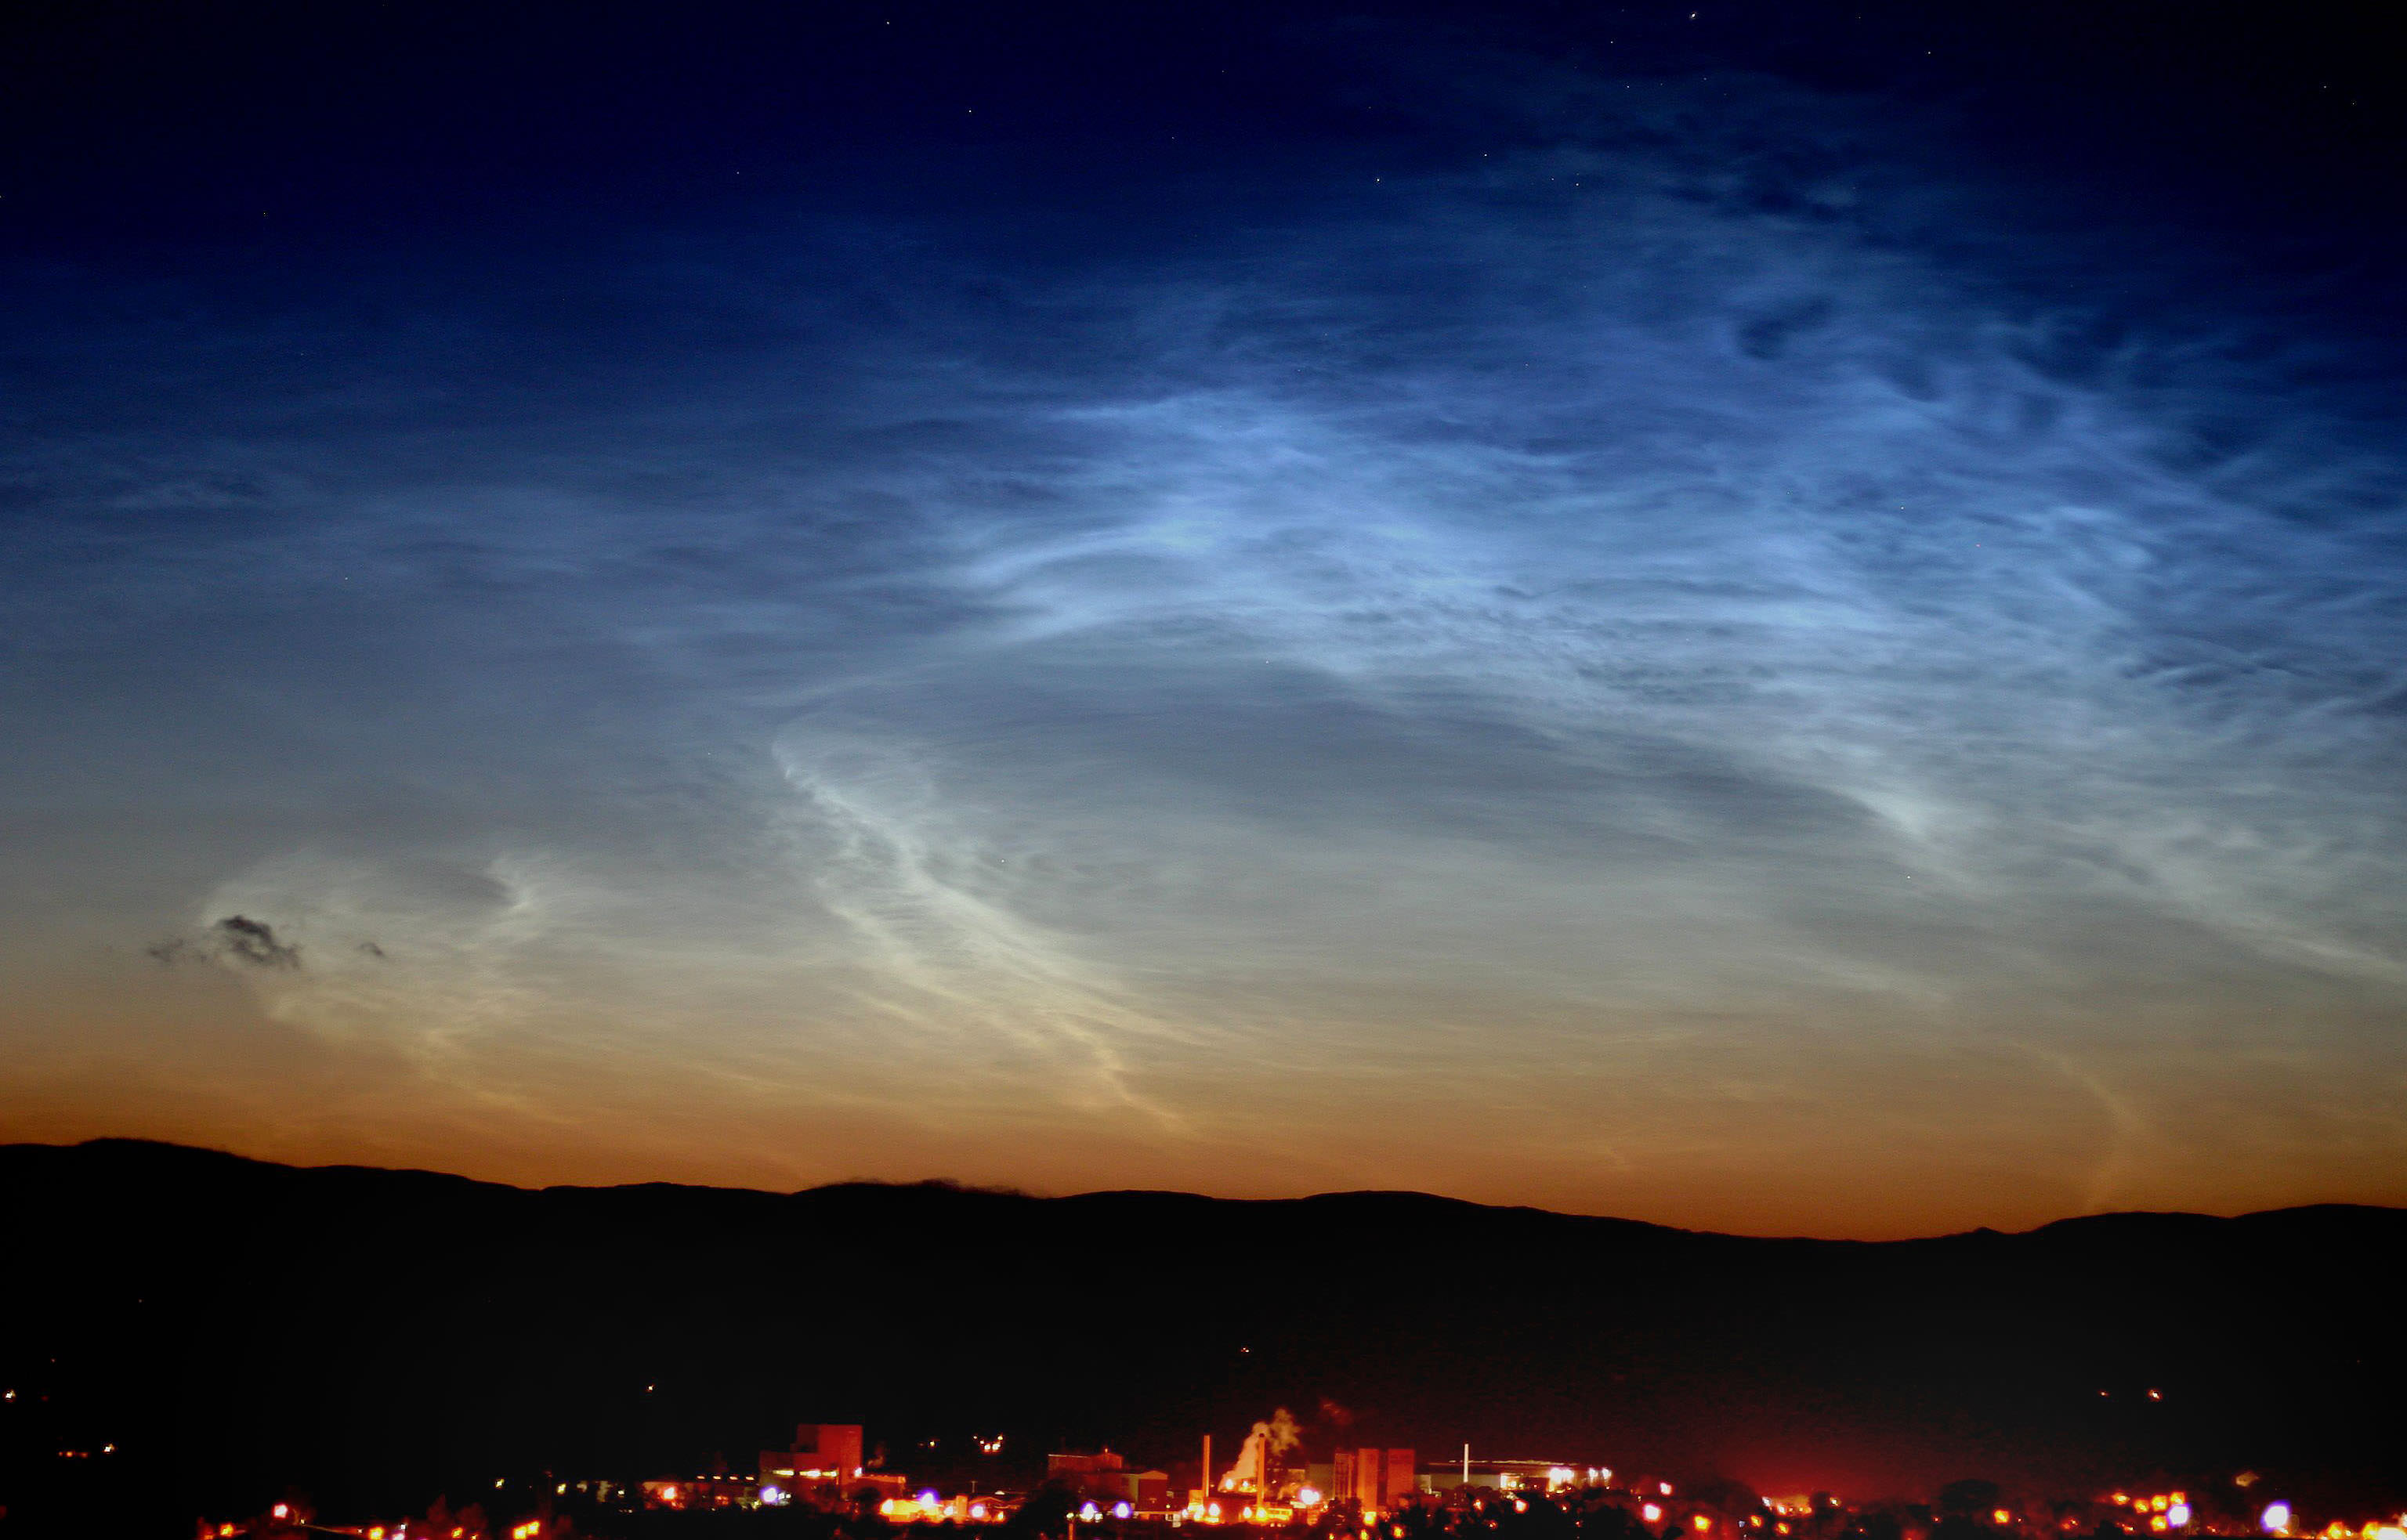
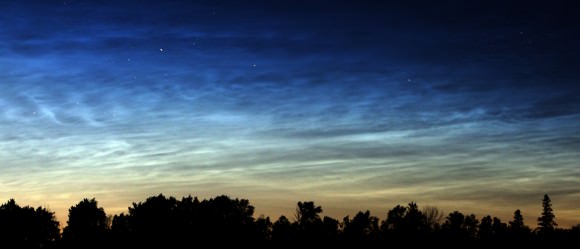
Noctilucent cloud display taken around midnight May 30 near Kendal Castle in northern England by Stuart Atkinson. "Beautiful display, better than all last year's pathetic displays combined - and the season has just started!" said Atkinson
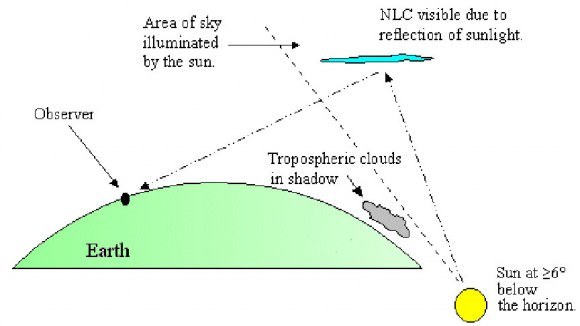
Every year at this time I add a new item to my list of what to watch for in the night sky. Oddly enough, it’s clouds. I must be nuts, right? What astronomer needs more clouds? But these are different. Called noctilucent clouds (NLCs), these skittish objects are visible now and again low in the northern sky during morning and evening twilight. Late May through August is the best time to see them.
What are these wispy, sometimes eerie clouds? And how can you see them?
First a caveat. If you live in Mississippi your chances of spotting them are slimmer than a string bean. Uncommon to begin with, NLCs are typically visible at higher latitudes; the northern U.S., Canada and Europe are prime outposts for an NLC vigil.
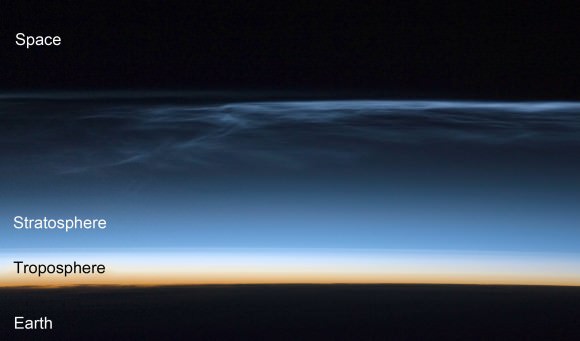
Noctilucent clouds, which form about 50 miles (80 km) high in the chilly mesosphere, lie high far above the troposphere, home to the more familiar clouds. Photo taken from the International Space Station. Credit: NASA
NLCs hole up in Earth’s mesosphere, a rarefied blanket of air extending from 30 to 53 miles (48-85 km) high. Most of the meteors we see burn up in this layer. It’s also extremely cold up there with temperatures at the top dropping to a teeth-rattling -130 F (-90 C). Because of their great height, noctilucent clouds reflect sunlight long after sunset when other clouds have gone gray and colorless. Their color is imparted by the ozone layer located 12-19 miles (19-30 km) overhead. The reds and oranges of reflected sunlight are absorbed by ozone on their way down to our eyes, tinting the clouds blue.
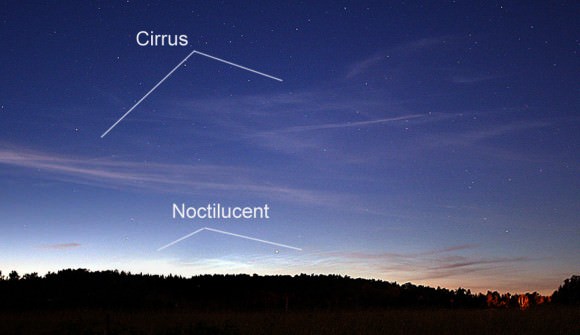
Cirrus clouds often look like fine streaks compared to the pleated, wavy appearance of NLCs. This photo also demonstrates the difference in their altitudes during a typical display across the northern U.S. Credit: Bob King
For any cloud to take shape and grow, water needs to stick to something. In day-to-day clouds, dust from wind storms – especially from the world’s deserts – supplies the necessary “nuclei” for the formation of water droplets and ice crystals.
Cirrus clouds, the ones that look like feathers wafting across the daytime sky, are typically about 10 miles high. Composed of ice crystals, they float near the top of the lowest, thickest layer of air called the troposphere. Noctilucent clouds share the realm of the Greek gods, basking in sunlight well into the night at an altitude of some 50 miles. That’s nearly as high as the aurora borealis, which can shimmy down to a scant 60 miles.
We see noctilucent clouds well after sunset when other clouds have gone dark because they’re much higher up and still able to catch sunlight and reflect it back to Earth. Credit: NASA
Since it’s next to impossible to get dust up high enough to provide nuclei for noctilucent cloud formation, scientists suspect outer space dust from meteoroids and comets provide some of the necessary material. As Earth travels around the sun, it sweeps up some 40,000 tons of interplanetary dust a year, plenty to get the job done. Other sources include volcanic dust and even chemical residues from rocket exhaust from the once-frequent launches of the space shuttle.
Winds from summer storms carry the water vapor into the mesosphere from the lower atmosphere which condenses on terrestrial and extraterrestrial dust nuclei. That’s why NLC displays are most frequent in summer.
Waves of NLCs on June 12, 2012 seen from Duluth, Minn. Credit: Bob King
Here in Duluth, Minn. at 47 degrees north I’ve seen probably half a dozen displays in years of sky watching, but to be honest, I only started looking for them in a dedicated way in the last 5 years. As late May approaches and twilight stretches deep into the evening hours, I scan the sky hoping for their return. The key to spotting NLCs is to find a place with a wide-open view of the northern horizon.
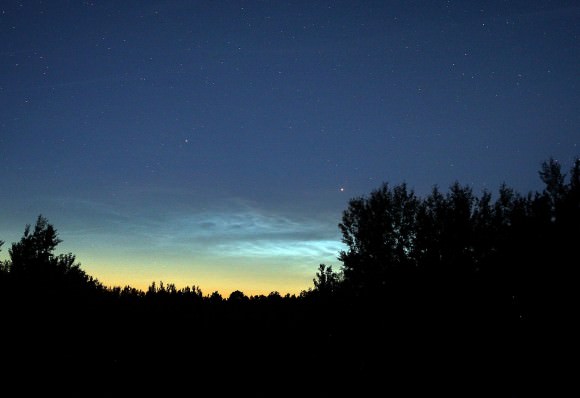
In the north, the sun retires around 9 p.m. and twilight ends more than two hours later. Watch for NLCs starting about an hour after sunset when cirrus clouds have turned pale gray and the stars begin to come out. From my home, they typically hover between 5 and 10 degrees (about a fist held at arm’s length or less) high above the northern horizon. The clouds make their first appearance at the upper end of that range, but as dusk deepens, they shrink back toward the horizon.
Video of NLCs from the Science Photo Library
NLCs look WEIRD. It’s not only their telltale eerie, plasma-blue coloration but their form that gives them away. Stripes, undulations, curls, streaks are mixed together in a way that seems alien. You might expect these on Mars maybe, but Earth? Binoculars are a huge help in appreciating the clouds’ peculiar textures and color. I say this because I’ve forgotten mine on several occasions. Two other dead giveaways – NLCs will grow brighter for a time as the sky grows darker. Regular clouds behave the opposite. NLCs also move and change shape very slowly because they’re so high up and far away.
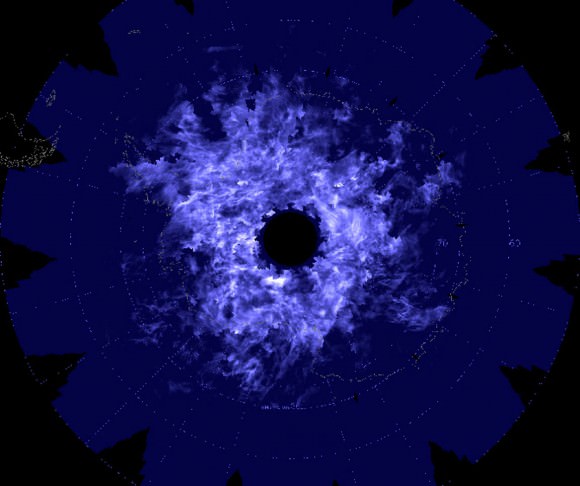
Looking down from above, the Aeronomy of Ice in the Mesosphere (AIM) Mission captured this composite image of noctilucent cloud cover above the South Pole on December 31, 2009. Click to read more about AIM. Credit: NASA/HU/VT/CU LASP
Night-shining clouds remain aglow until nearly twilight’s end. The cut-off viewing time for the northern U.S. is about 2 hours after sunset or earlier if the mosquitos have their way. By then the sun drops too far below the horizon to provide the light to sustain them. Those living farther north in Canada, northern Ireland, England and Finland, where the sky is never truly dark during the early summer months, can enjoy NLC viewing all night.
Dawn display with stars of electric-blue NLCs on June 13, 2012. Credit: Bob King
There are indications that NLC displays are becoming more common, even pushing into lower latitudes in the past 20-30 years. It might have to do with increased levels of carbon dioxide in Earth’s atmosphere. While CO2 helps to warm the lower air layers, it can can cause the upper atmosphere to grow chillier, creating the cold conditions necessary for accelerated noctilucent cloud formation. You can dig deeper into the topic HERE.
For more about Earth’s most unusual clouds, stop by the Noctilucent Cloud Observers’ Homepage. Like the northern lights, a thrilling noctilucent cloud display is a quest worth a trip to the north country.
This article comes from the Universe Today archive, but was updated with this spiffy video.
How old is the Earth? Scientists think that the Earth is 4.54 billion years old. Coincidentally, this is the same age as the rest of the planets in the Solar System, as well as the Sun. Of course, it’s not a coincidence; the Sun and the planets all formed together from a diffuse cloud of hydrogen billions of years ago.
In the early Solar System, all of the planets formed in the solar nebula; the remnants left over from the formation of the Sun. Small particles of dust collected together into larger and larger objects – pebbles, rocks, boulders, etc – until there were many planetoids in the Solar System. These planetoids collided together and eventually enough came together to become Earth-sized.
At some point in the early history of Earth, a planetoid the size of Mars crashed into our planet. The resulting collision sent debris into orbit that eventually became the Moon.
How do scientists know Earth is 4.54 billion years old? It’s actually difficult to tell from the surface of the planet alone, since plate tectonics constantly reshape its surface. Older parts of the surface slide under newer plates to be recycled in the Earth’s core. The oldest rocks ever found on Earth are 4.0 – 4.2 billion years old.
Scientists assume that all the material in the Solar System formed at the same time. Various chemicals, and specifically radioactive isotopes were formed together. Since they decay in a very known rate, these isotopes can be measured to determine how long the elements have existed. And by studying different meteorites from different locations in the Solar System, scientists know that the different planets all formed at the same time.
Failed Methods for Calculating the Age of the Earth
Our current, accurate method of measuring the age of the Earth comes at the end of a long series of estimates made through history. Clever scientists discovered features about the Earth and the Sun that change over time, and then calculated how old the planet Earth is from that. Unfortunately, they were all flawed for various reasons.
Declining Sea Levels – Benoit de Maillet, a French anthropologist who lived from 1656-1738 and guessed (incorrectly) that fossils at high elevations meant Earth was once covered by a large ocean. This ocean had taken 2 billion years to evaporate to current sea levels. Scientists abandoned this when they realized that sea levels naturally rise and fall.
Cooling of the Earth – William Thompson, later known as Lord Kelvin, assumed that the Earth was once a molten ball of rock with the same temperature of the Sun, and then has been cooling ever since. Based on these assumptions, Thompson calculated that the Earth took somewhere between 20 and 400 million years to cool to its current temperature. Of course, Thompson made several inaccurate assumptions, about the temperature of the Sun (it’s really 15 million degrees Kelvin at its core), the temperature of the Earth (with its molten core) and how the Sun is made of hydrogen and the Earth is made of rock and metal.
Cooling of the Sun – In 1856, the German physicist Hermann Ludwig Ferdinand von Helmholtz attempted to calculate the age of the Earth by the cooling of the Sun. He calculated that the Sun would have taken 22 million years to condense down to its current diameter and temperature from a diffuse cloud of gas and dust. Although this was inaccurate, Helmholtz correctly identified that the source of the Sun’s heat was driven by gravitational contraction.
Rock Erosion – In his book, The Origin of Species by Means of Natural Selection, Charles Darwin proposed that the erosion of chalk deposits might allow for a calculation of the minimum age of the planet. Darwin estimated that a chalk formation in the Weald region of England might have taken 300 million years to weather to its current form.
Orbit of the Moon – George Darwin, the son of Charles Darwin, guessed that the Moon might have been formed out of the Earth, and drifted out to its current location. The fission theory proposed that the Earth’s rapid rotation caused a chunk of the planet to spin off into space. Darwin calculated that it had taken the Moon at least 56 million years to reach its current distance from Earth. We now know the Moon was probably formed when a Mars-sized object smashed into the Earth billions of years ago.
Salinity of the Ocean – In 1715, the famous astronomer Edmund Halley proposed that the salinity of the oceans could be used to estimate the age of the planet. Halley observed that oceans and lakes fed by streams were constantly receiving more salt, which then stuck around as the water evaporated. Over time, the water would be come saltier and saltier, allowing an estimate of how long this process has been going on. Various geologists used this method to guess that the Earth was between 80 and 150 million years old. This method was flawed because scientists didn’t realize that geologic processes are extracting salt out of the water as well.
Radiometric Dating Provides an Accurate Method to Know the Age of the Earth
In 1896, the French chemist A. Henri Becquerel discovered radioactivity, the process where materials decay into other materials, releasing energy. Geologists realized that the interior of the Earth contained a large amount of radioactive material, and this would be throwing off their calculations for the age of the Earth. Although this discovery revealed flaws in the previous methods of calculating the age of the Earth, it provided a new method: radiometric dating.
Geologists discovered that radioactive materials decay into other elements at a very predictable rate. Some materials decay quickly, while others can take millions or even billions of years to fully decay. Ernest Rutherford and Frederick Soddy, working at McGill University, determined that half of any isotope of a radioactive element decays into another isotope at a set rate. For example, if you have a set amount of Thorium-232, half of it will decay over a billion years, and then half of that amount will decay in another billion years. This is the source of the term “half life”.
By measuring the half lives of radioactive isotopes, geologists were able to build a measurement ladder that let them accurately calculate the age of geologic formations, including the Earth. They used the decay of uranium into various isotopes of lead. By measuring the amount of three different isotopes of lead (Pb-206, Pb-207, and Pb-208 or Pb-204), geologists can calculate how much Uranium was originally in a sample of material.
If the Solar System formed from a common pool of matter, with uniformly distributed Pb isotopes, then all objects from that pool of matter should show similar amounts of the isotopes. Also, over time, the amounts of Pb-206 and Pb-207 will change because as these isotopes are end-products of uranium decay. This makes the amount of lead and uranium change. The higher the uranium-to-lead ratio of a rock, the more the Pb-206/Pb-204 and Pb-207/Pb-204 values will change with time. Now, supposing that the source of the Solar system was also uniformly distributed with uranium isotopes, then you can draw a data line showing a lead-to-uranium plot and, from the slope of the line, the amount of time which has passed since the pool of matter became separated into individual objects can be computed.
Bertram Boltwood applied this method of dating to 26 different samples of rocks, and discovered that they had been formed between 92 and 570 million years old, and further refinements to the technique gave ages between 250 million to 1.3 billion years.
Geologists set about exploring the Earth, seeking the oldest rock formations on the planet. The oldest surface rock is found in Canada, Australia and Africa, with ages ranging from 2.5 to 3.8 billion years. The very oldest rock was discovered in Canada in 1999, and estimated to be just over 4 billion years old.
This set a minimum age for the Earth, but thanks to geologic processes like weathering and plate tectonics, it could still be older.
Meteorites as the Final Answer to the Age of the Earth
The problem with measuring the age of rocks on Earth is that the planet is under constant geological change. Plate tectonics constantly recycle portions of the Earth, blending it up and forever hiding the oldest regions of the planet. But assuming that everything in the Solar System formed at the same time, meteorites in space have been unaffected by weathering and plate tectonics here on Earth.
Geologists used these pristine objects, such as the Canyon Diablo meteorite (the fragments of the asteroid that impacted at Barringer Crater) as a way to get at the true age of the Solar System, and therefore the Earth. By using the radiometric dating system on these meteorites, geologists have been able to determine that the Earth is 4.54 billion years old within a margin of error of about 1%.
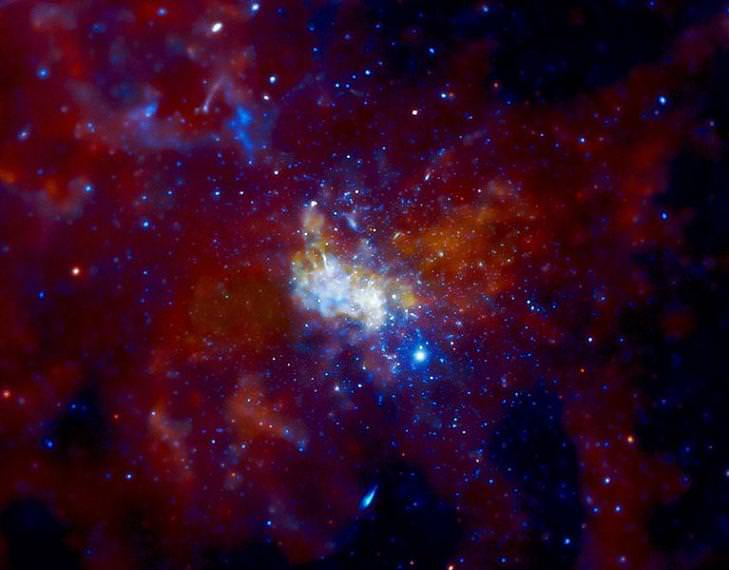
Sgr A Chandra Image Courtesy of NASA/CXC/MIT/F. Baganoff, R. Shcherbakov et al.
Deep in the heart of the Milky Way resides a black hole. However, that is not the mysterious object which scientists Fabio Antonini, of the Canadian Institute for Theoretical Astrophysics, and David Merritt, of the Rochester Institute of Technology, have been endeavoring to explain. The objects of their attention are the orbits of massive young stars which attend it. They are called “S-stars”.
No. That’s not a stutter. S-Stars are a legitimate phenomenon which enable researchers to even more closely examine black hole activity. Their very presence causes astronomers to question what they know. For example, how is it possible for these massive young stars to orbit so close to a region where it would be highly unlikely for them to form there? The sheer force of the strong gravity near a black hole means these stars had to have once been further away from their observed position. However, when theoreticians created models to depict how S-stars might have traveled to their current orbital positions, the numbers simply didn’t match up. How could their orbits be so radically removed from predictions?
Today, Dr. Antonini offered his best explanation of this enigma at the annual meeting of the Canadian Astronomical Society (CASCA). In “The Origin of the S-star Cluster at the Galactic Center,” he gave a unified theory for the origin and dynamics of the S-stars. It hasn’t been an easy task, but Antonini has been able to produce a very viable theory of how these stars were able to get in close proximity to a supermassive black hole in only tens of millions of years since their formation.
“Theories exist for how migration from larger distances has occurred, but have up until now been unable to convincingly explain why the S-stars orbit the galactic center the way they do,” Antonini said. “As main-sequence stars, the S-stars cannot be older than about 100 million years, yet their orbital distribution appears to be ‘relaxed’, contrary to the predictions of models for their origin.”
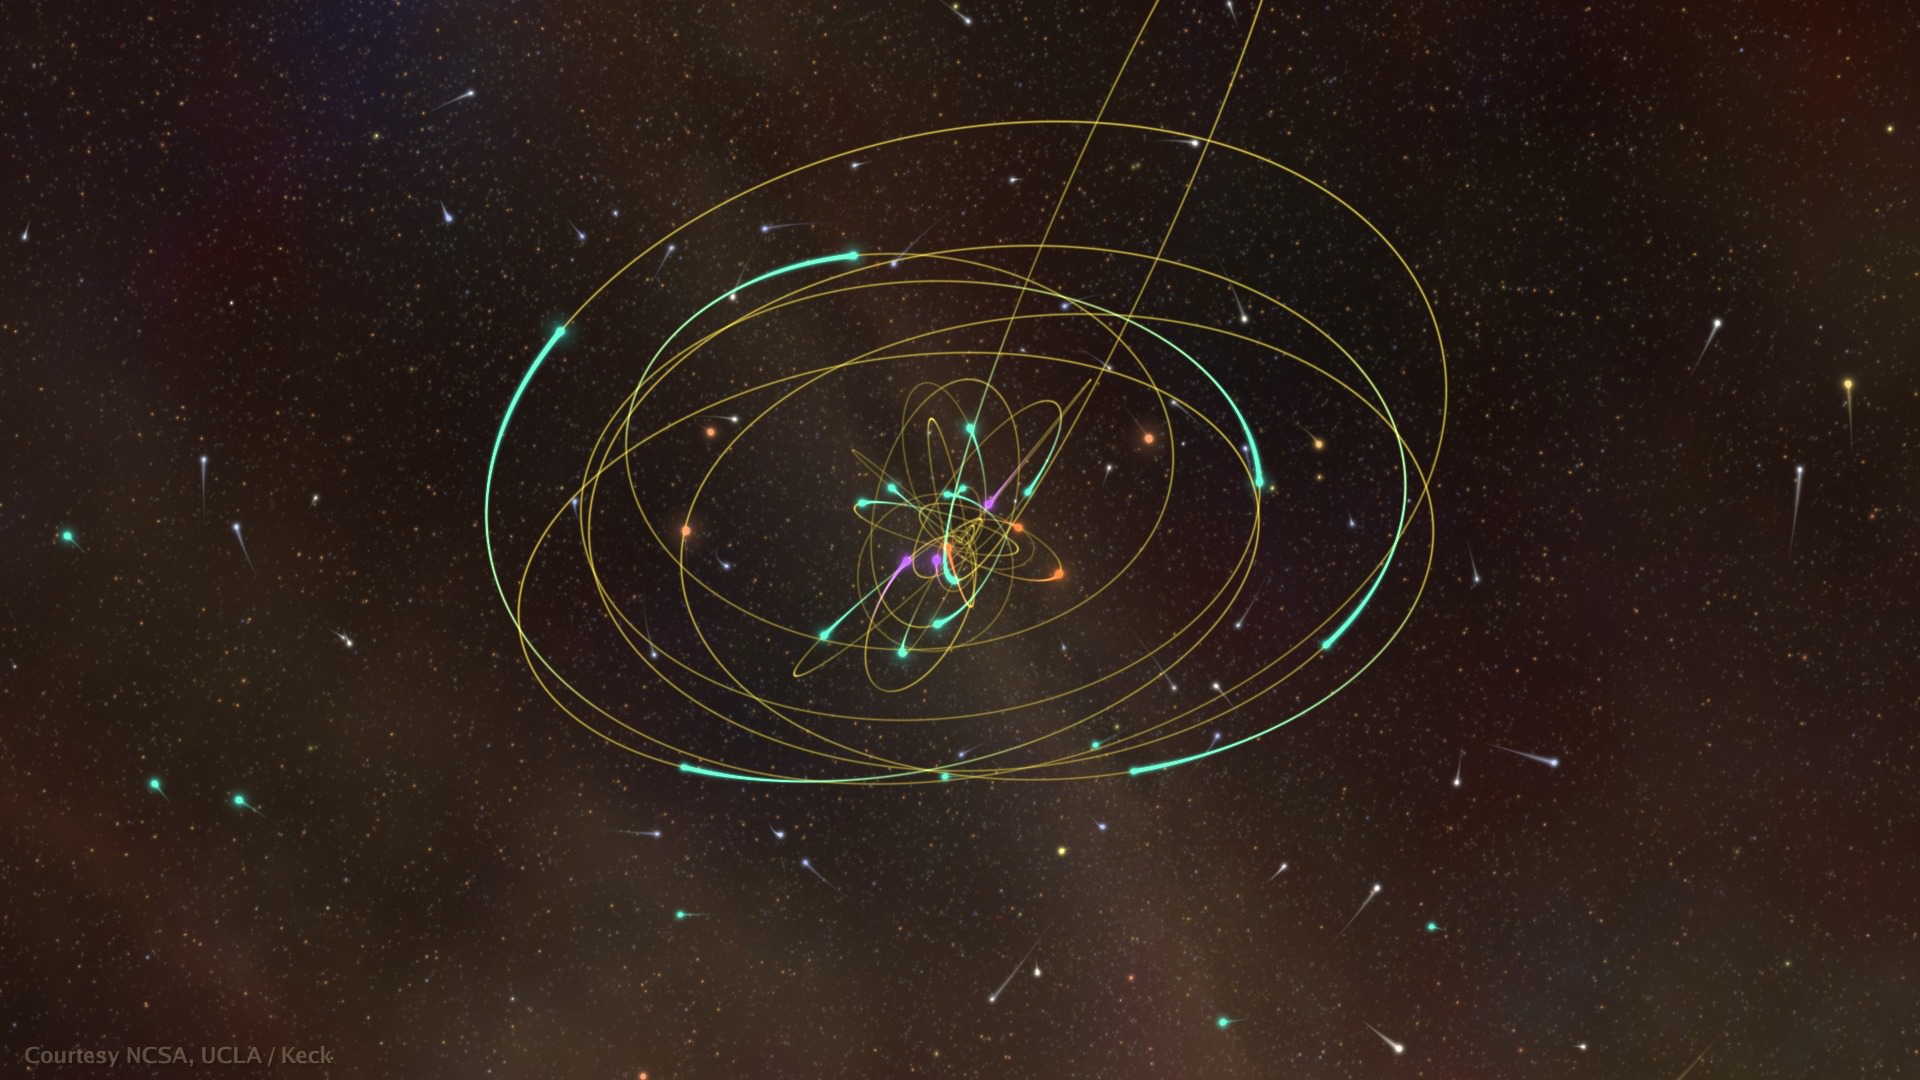
3-dimensional visualization of the stellar orbits in the Galactic center based on data obtained by the W. M. Keck Telescopes between 1995 and 2012. Stars with the best determined orbits are shown with full ellipses and trails behind each star span ~15-20 years. These stars are color-coded to represent their spectral type: Early-type (young) stars are shown in teal green, late-type (old) stars are shown in orange, and those with unknown spectral type are shown in magenta. Stars without ellipses are from a statistical sample and follow the observed radial distributions for the early (white) or late (yellow/orange) type stars. These stars are embedded in a model representation of the inner Milky Way provided by NCSA/AVL to provide context for the visualization.
According to Antonini and Merritt’s model, S-stars began much further away from the galactic center. Normal? Yep. Normal mode. Then these seemingly normal orbiting stars encountered the black hole’s gravity and began their spiral inward. As they made the inexorable trek, they then encountered the gravity of other stars in the vicinity which then changed the S-stars orbital pattern. It’s a simple insight, and one that verifies how the galactic center evolves from the conjoined influence of a supermassive black holes relativistic effects and the handiwork of gravitational interactions.
“Theoretical modeling of S-star orbits is a means to constrain their origin, to probe the dynamical mechanisms of the region near the galactic center and,” says Merritt, “indirectly to learn about the density and number of unseen objects in this region.”
Although the presence of supermassive black holes at the center of nearly all massive galaxies isn’t a new concept, further research into how they take shape and evolve leads to a better understanding of what we see around them. These regions are deeply connected to the very formation of the galaxy where they exist. With the center of our own galaxy – Sagittarius A – so near to home, it has become the perfect laboratory to observe manifestations such as S-stars. Tracking their orbits over an extended period of time has validated the presence of a supermassive black hole and enlightened our thinking of our own galaxy’s many peculiarities.
Original Story Source: Canadian Astronomical Society Press Release
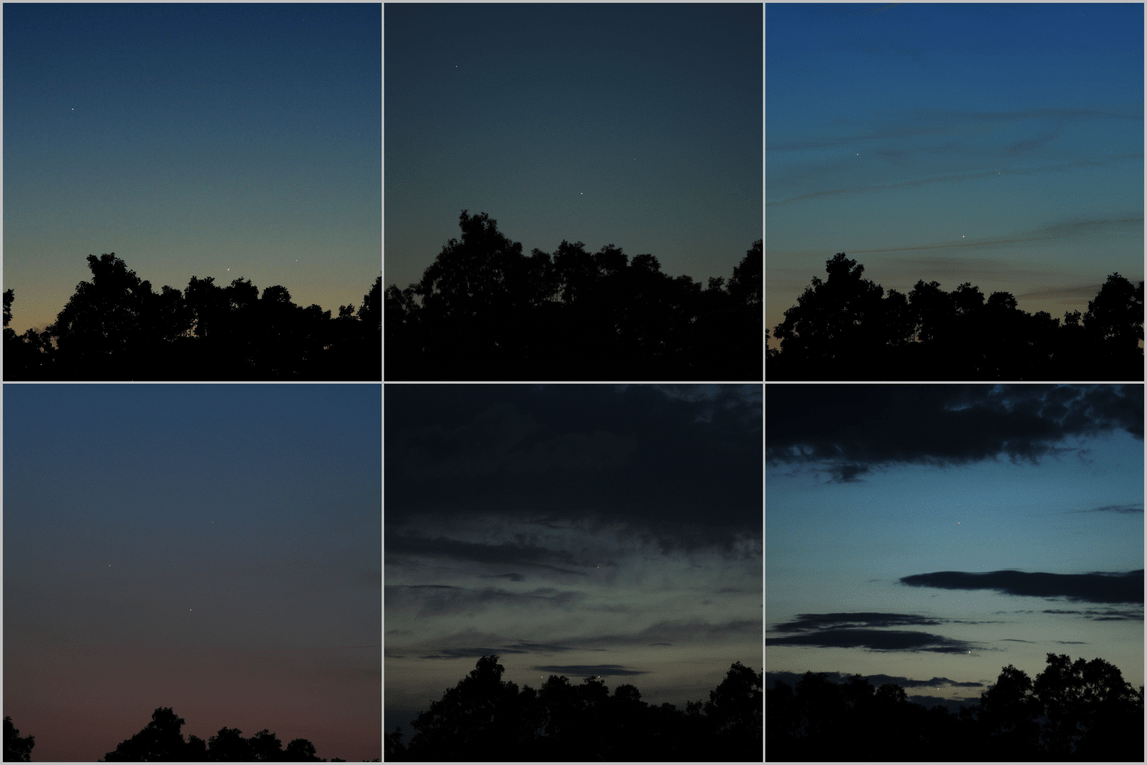
A sequence of 6 consecutive Jupiter-Venus-Mercury conjunction photos taken on May 23 - 28, 2013. Credit and copyright: Joe Shuster.
We’ve shared oodles of great images from the recent planetary conjunction of Jupiter, Mercury and Venus, visible in the evening skies last week. But this video from astrophotographer César Cantú is just plain beautiful. On the evening of May 25, the conjunction of the three planets formed a triangle that moved through the sky, as seen from Big Bear Park in California, USA. César said via Twitter that the “star” effect was create by processing the video or with 4,6 or 8 point star filters.
And we’ve got one more conjunction image to share — actually six.
Joe Shuster from Salem, Missouri had six great evenings of photographing the planetary conjunction, and put them together into one collage. He used a Canon T1i and Nikkon 105mm lens. Lucky guy!
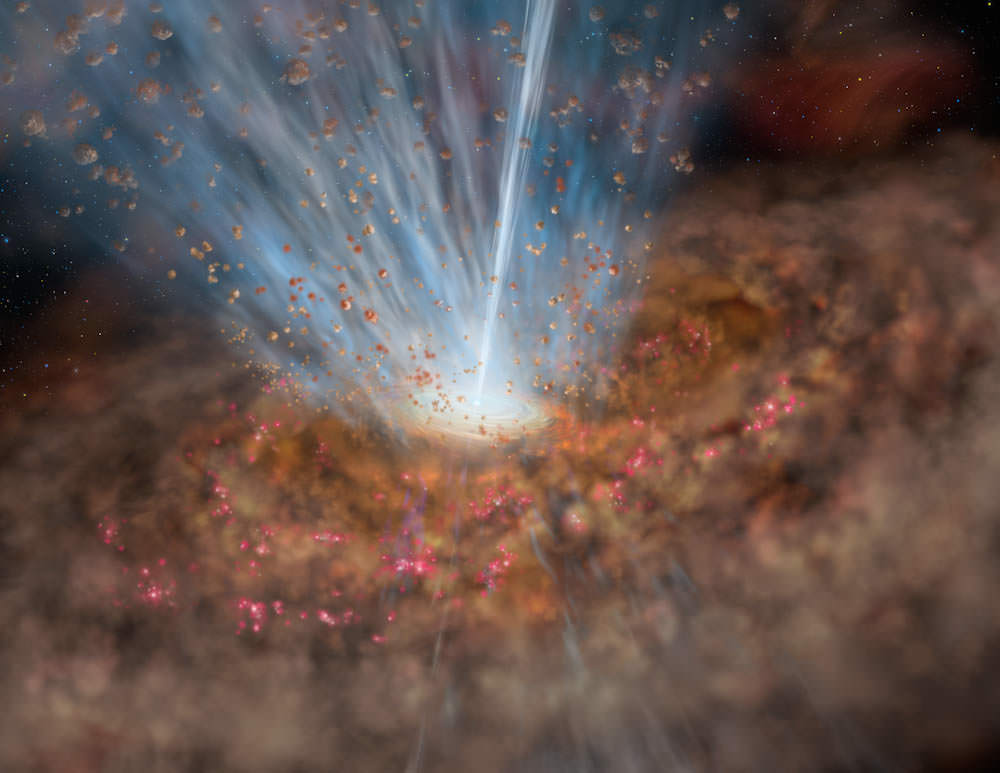
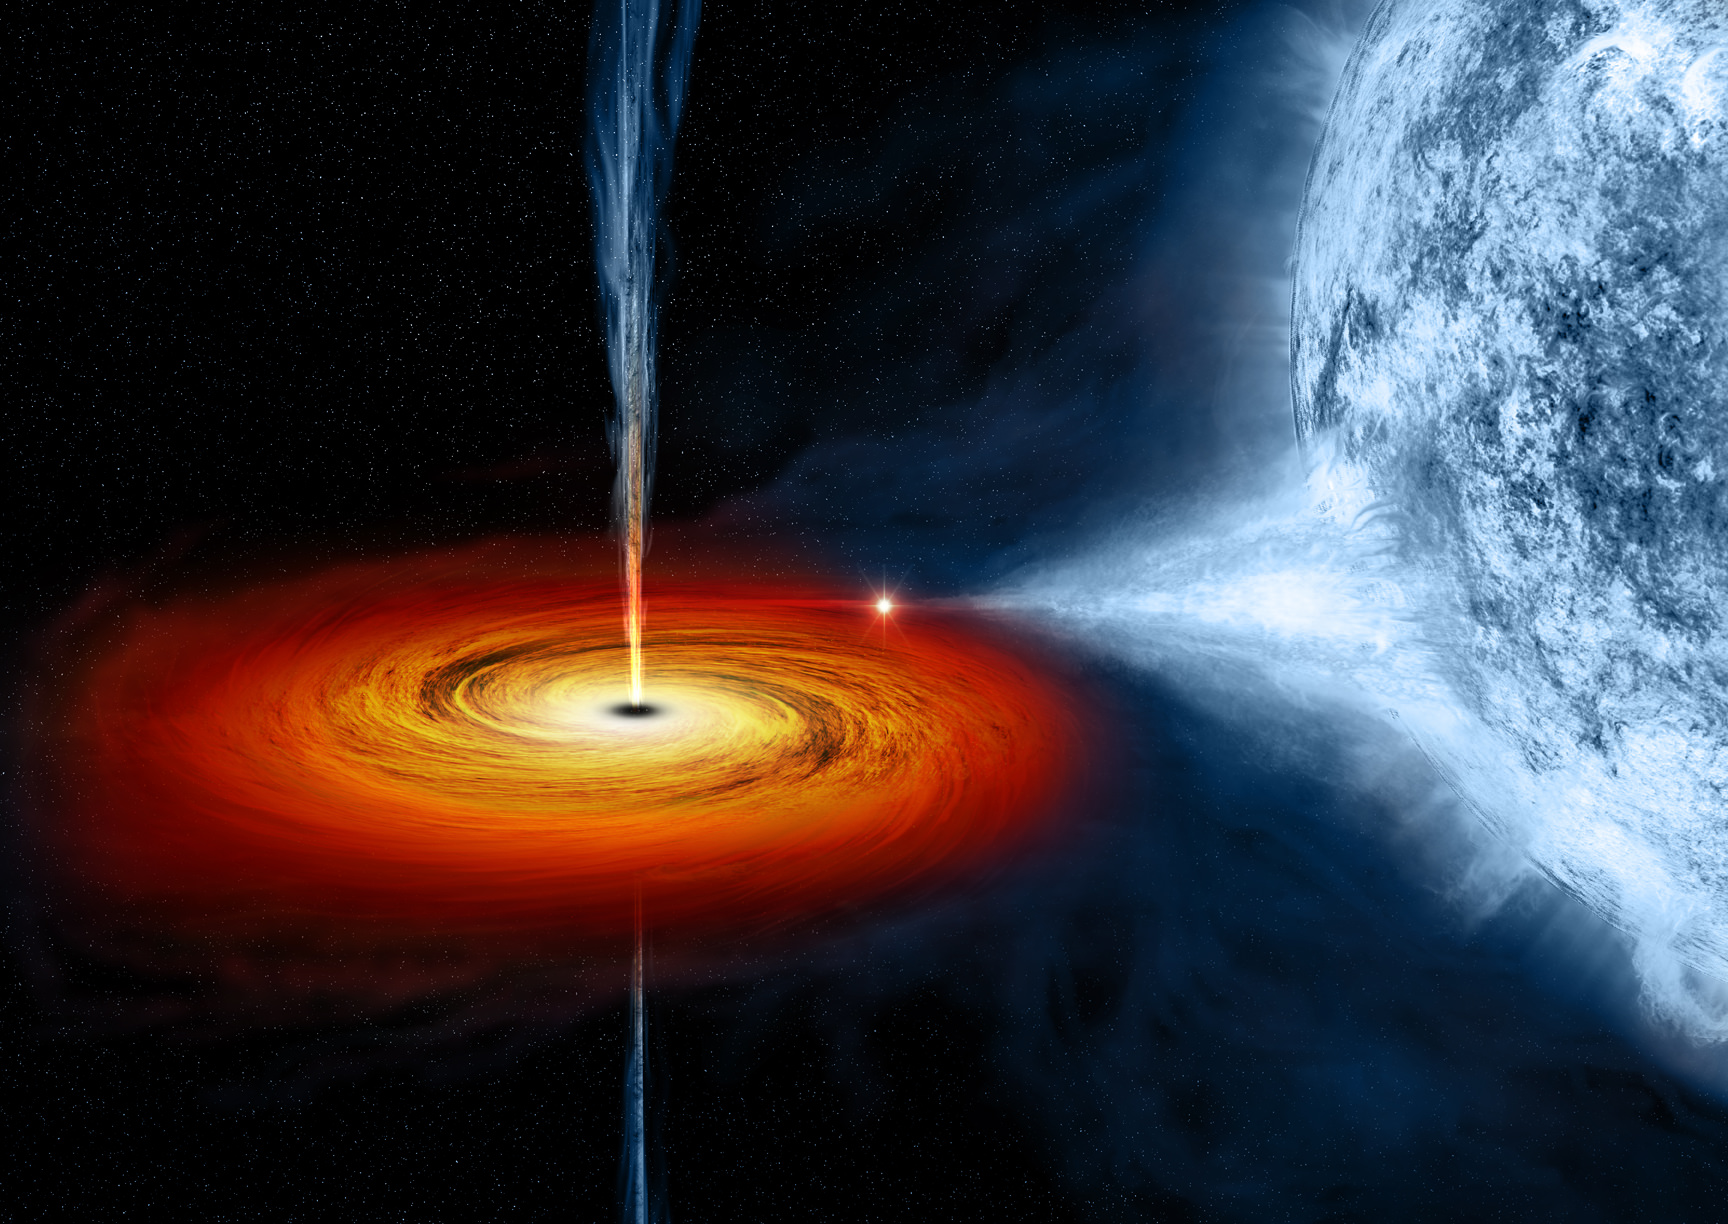
Artist’s rendering of the environment around the supermassive black hole at the center of Mrk 231. The broad outflow seen in the Gemini data is shown as the fan-shaped wedge at the top of the accretion disk around the black hole, in side view. A similar outflow is probably present under the disk as well. The total amount of material entrained in the broad flow is at least 400 times the mass of the sun per year. Credit: Gemini Observatory/AURA, artwork by Lynette Cook
Right now, as you read this article, it’s quite possible that the ultra-huge black hole at the center of our galaxy is feasting on asteroids or supercooked gas.
We’ve seen these supermassive black holes in other spots in the universe, too: merging together, for example. They’re huge heavyweights, typically ranging between hundreds of thousands to billions of times the mass of the Sun. But we also know, paradoxically, that mini supermassive black holes exist.
So while we’ve observed the gravitational effects of these monsters, a University of Alberta researcher today (May 30) is going to outline the big question: how the heck some of them got so massive. For now, no one knows for sure, but scientists are naturally taking a stab at trying to figure this out.
Maybe they were your ordinary stellar black holes, just three to 100 times the mass of the sun, that underwent a growth spurt. There’s a sticking point with that theory, though: “To do this, the black holes would have to gorge excessively, at rates that require new physics,” stated the Canadian Astronomical Society.
Illustration of Cygnus X-1, a stellar-mass black hole located 6070 ly away. (NASA/CXC/M.Weiss)
“We might also expect to see some black holes that are intermediate in mass between stellar-mass and supermassive black holes in our nearby universe,” the society added, “like a band that is consistently releasing albums, but never making it truly big.”
Anyway, Jeanette Gladstone (a postdoctoral researcher) will make a presentation at CASCA’s annual meeting in Vancouver today outlining some ideas. Gladstone, by the way, focuses on X-rays (from black holes) in her work. Here’s what she said on her research page:
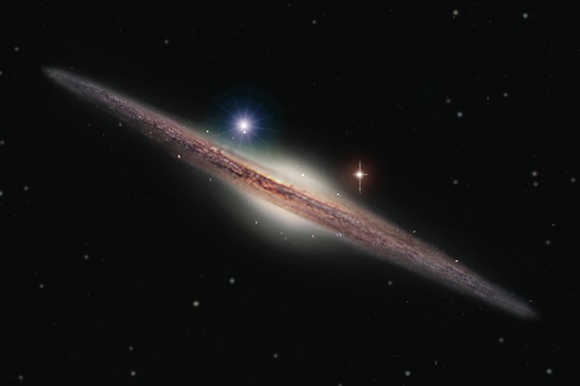
HLX-1 in the periphery of the edge-on spiral galaxy ESO 243-49. Credit: Heidi Sagerud.
“I am currently trying to understand a strange group of curiously bright X-ray binaries. These ultraluminous X-ray sources emit too much X-ray radiation to be explained by standard accretion [of] only a regular stellar mass black hole,” she wrote.
“So I use various parts of the electromagnetic spectrum to try and understand what makes them appear so bright. More recently I have started looking at the very brightest of these sources, a group of objects that have recently become a class in their own right. These are the hyperluminous X-ray sources.”
For context, here’s more info on a hyperluminous X-ray source (and its black hole) in spiral galaxy ESO 234-9, as studied by the Hubble Space Telescope and the Swift X-Ray Telescope.
Astronomers were pretty excited with this 2012 work: “For the first time, we have evidence on the environment, and thus the origin, of this middle-weight black hole,” said Mathieu Servillat, a member of the Harvard-Smithsonian Center for Astrophysics research team, at the time.
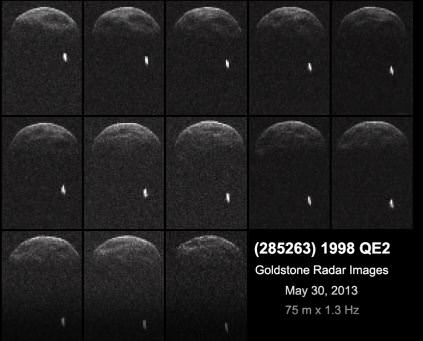
Radar images from May 30, 2012 of Asteroid 1998 QE2, showing its binary companion. Credit: NASA.
Late yesterday, NASA turned the 230-foot (70-meter) Deep Space Network antenna at Goldstone, California towards Asteroid 1998 QE2 as it was heading towards its closest approach to Earth, and they got a big surprise: the asteroid is a binary system. 1998 QE2 itself is 1.7 miles (2.7 kilometers) in diameter, and the newly found orbiting moon is about 600 meters in diameter.
The radar images were taken were taken on May 29, 2013, when the asteroid was about 3.75 million miles (6 million kilometers) from Earth.
“Radar really helps to pin down the orbit of an asteroid as well as the size of it,” said Paul Chodas of NASA’s Near-Earth Object Program office, speaking during a JPL webcast about this asteroid on May 30. “We now know our size estimates were pretty good, but finding it was a binary was surprising.”
NASA said that about 16 percent of asteroids are binary or even triple systems.
Each of the images above are snippets of about 5 minutes of radar data. You can watch a movie of the data, below:
Other surprises were several radar-dark features, which may be cavities or impact craters, said Marina Brozovic, a scientist at JPL. The asteroid is also rotating more slowly than originally thought.
Near Earth Asteroid (NEA) 285263 (1998 QE2) will pass 5.86 million km from the Earth on Friday, May 31st at 20:59 Universal Time (UT) or 4:59PM EDT. This is the closest approach of 1998 QE2 for this century, and it poses no threat – and there’s not any threat in the future – as it is passing over 15 times as distant as the Earth’s Moon. But the rather large size of this space rock makes it an object of interest for astronomers.
Chodas added that they will continue to take radar data of this asteroid while they can to improve its orbital parameters, and that the presence of the moonlet means they can get an even more precise mass estimate of the asteroid.
Want to try and see this asteroid for yourself? Our very own David Dickinson has written a great “how-to” for this object, but you are going to need a fairly large backyard telescope, since it will be about 100 times fainter than what can be seen with the naked eye, even at closest approach.
The Slooh online telescope will have views of online tomorrow, which you can watch at their website. The webcast will start at 20:30 UTC (4:30 p.m. EDT) on Friday, May 31.
Also, starting at 20:00 UTC (4:00 p.m. EDT), astrophysicist Gianluca Masi will have a webcast from the Virtual Telescope Project in Italy.
Additionally, if you want to have a Bruce Willis-type view of this asteroid, check out NASA’s Eyes on the Solar System. They have a special feature on this asteroid, and you can “ride along with it for the next few days,” said Doug Ellison, Visualization Producer at JPL, speaking during the webcast.
This amazing tool creates realistic simulated views based on real data, and allows you to travel to any planet, moon or spacecraft across time and space, in 3D and in real time — or speed up to see the future.
Just go to the Eyes on the Solar System website, and when the window opens, click on “Tours and Features” in the upper right hand corner, then click on “1998 QE2” in the dropdown box, and away you go. If you click on the “Live” button the left, you’ll see the current location; click on “Ride Along” and find yourself sitting on the asteroid heading towards Earth.
At the bottom control panel “dock” (click on the bottom box on the lower right side if the panel isn’t showing), you can speed up time and see how far from Earth this asteroid will get and where it will go in the future.
Ellison added that right now the imagery on Eyes on the Solar System doesn’t have the moonlet orbiting 1998 QE2, but they will be adding it soon to make the visualization as realistic as possible.
NASA’s @AsteroidWatch Twitter account shared the news about the moon:
Also, if you want more asteroids, on Friday May 31, the White House is hosting an asteroid-themed “We the Geeks” Google+ Hangout starting at 2 p.m. EDT.
The live video conference will feature Bill Nye the Science Guy, former astronaut Ed Lu, NASA Deputy Administrator Lori Garver, and Peter Diamandis, co-founder of asteroid mining company Planetary Resources. They will discuss identification, resource potential and threat of asteroids. Here’s the link the White House’s Google+ page.
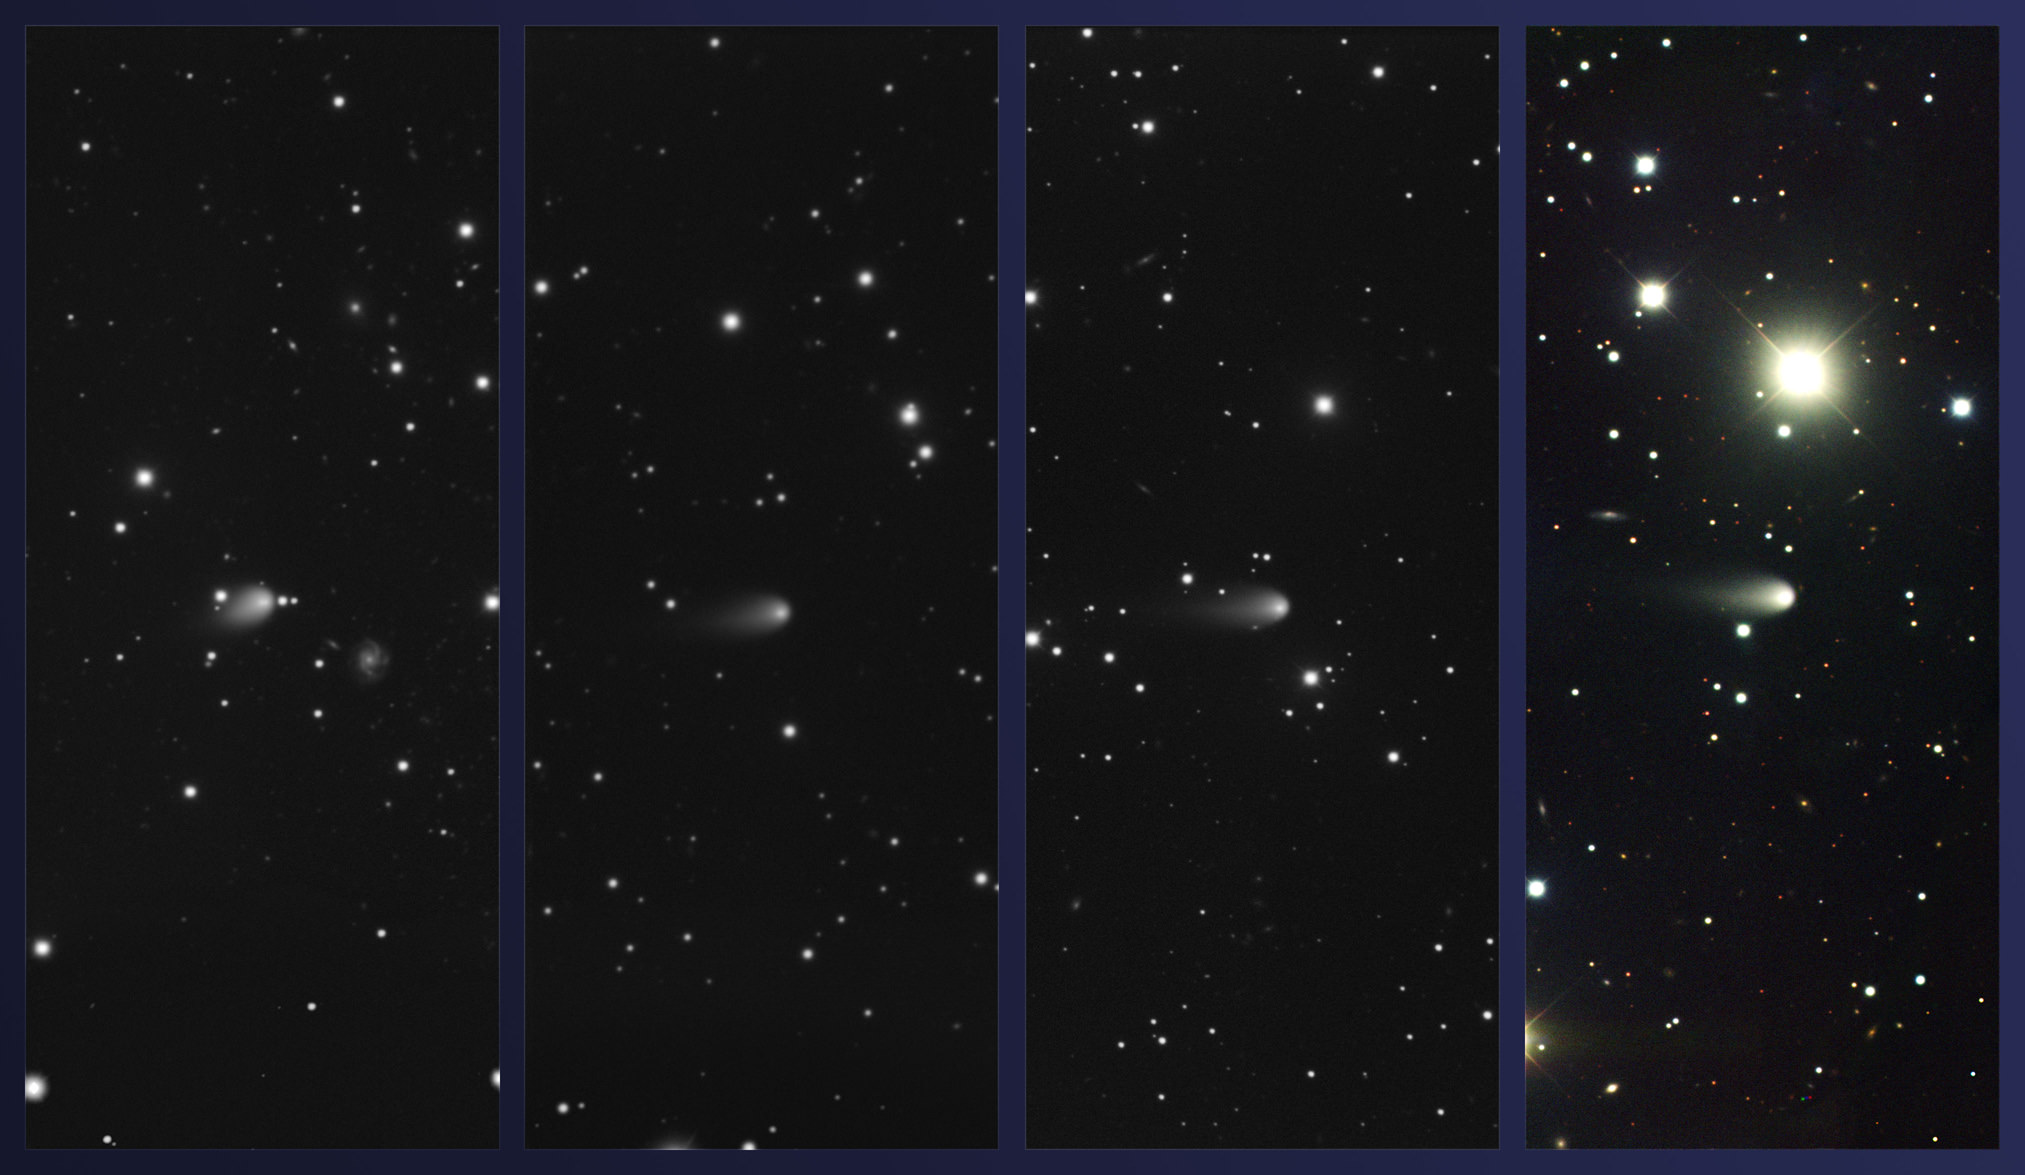
Images of Comet ISON obtained using the Gemini Multi-Object Spectrograph at Gemini North on February 4, March 4, April 3, and May 4, 2013 (left to right, respectively; Comet ISON at center in all images). Color composite produced by Travis Rector, University of Alaska Anchorage. Credit: Gemini Observatory/AURA
As Comet C/2012 S1 (ISON) heads closer to Earth, we’re getting a better view of what has been billed by some as the “Comet of the Century.” Astronomers say these new photos from the Gemini North telescope on Mauna Kea, Hawai‘i provide hints of how well this comet might survive one of the closest comet encounters with the Sun ever recorded, on November 28, 2013.
With astronomy enthusiasts hopeful and optimistic about having a spectacular comet visible in our skies, it’s anyone’s guess if the comet will actually survive its extremely close pass of the Sun to become early morning eye-candy in early December 2013.
The time-sequence images, spanning early February through May 2013, show that the comet is quite active, despite how distant it is from the Sun.
When Gemini obtained these images, the comet ranged between roughly 455-360 million miles (730-580 million kilometers; or 4.9-3.9 astronomical units) from the Sun, or just inside the orbital distance of Jupiter. Each image in the series, taken with the Gemini Multi-Object Spectrograph at the Gemini North telescope on Mauna Kea, Hawai‘i, shows the comet in the far red part of the optical spectrum, which emphasizes the comet’s dusty material already escaping from the nucleus. The final image in the sequence, obtained in early May, consists of three images, including data from other parts of the optical spectrum, to produce a color composite image.
Gemini astronomers say the images show the comet sporting a well-defined parabolic hood in the sunward direction that tapers into a short and stubby tail pointing away from the Sun. These features form when dust and gas escape from the comet’s icy nucleus and surround that main body to form a relatively extensive atmosphere called a coma. Solar wind and radiation pressure push the coma’s material away from the Sun to form the comet’s tail, which we see here at a slight angle (thus its stubby appearance).
“Early analysis of our models shows that ISON’s brightness through April can be reproduced by outgassing from either carbon monoxide or carbon dioxide,” said Karen Meech, at the University of Hawaii’s Institute for Astronomy (IfA) in Honolulu. “The current decrease may be because this comet is coming close to the Sun for the first time, and a “volatile frosting” of ice may be coming off revealing a less active layer beneath. It is just now getting close enough to the Sun where water will erupt from the nucleus revealing ISON’s inner secret.”
Comet ISON will come within 800,000 miles (1.3 million km) of the Sun’s surface on November 28. Shortly before that critical passage, the comet may appear bright enough for expert observers using proper care to see it close to the Sun in daylight.
“Comets may not be completely uniform in their makeup and there may be outbursts of activity as fresh material is uncovered,” added IfA astronomer Jacqueline Keane. “Our team, as well as astronomers from around the world, will be anxiously observing the development of this comet into next year, especially if it gets torn asunder, and reveals its icy interior during its exceptionally close passage to the Sun in late November.”
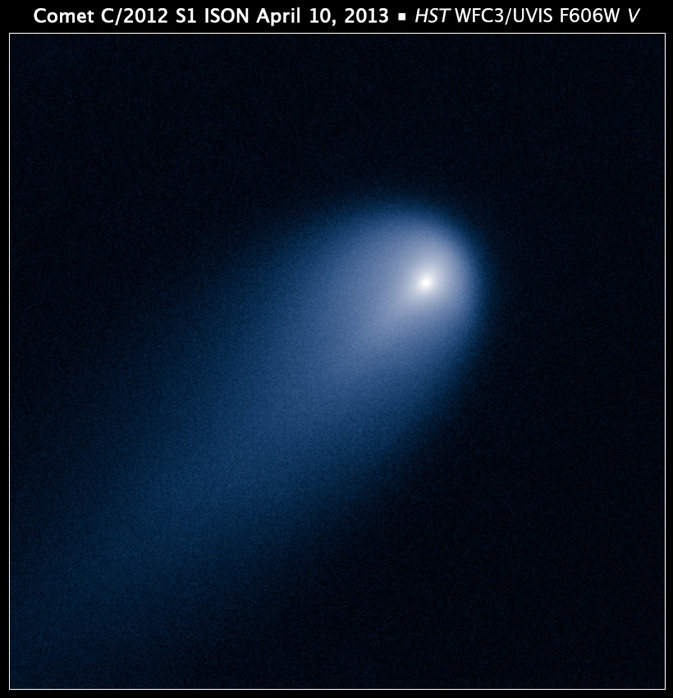
NASA’s Hubble Space Telescope provides a close-up look of Comet ISON (C/2012 S1), as photographed on April 10, when the comet was slightly closer than Jupiter’s orbit at a distance of 386 million miles from the sun. Credit:NASA, ESA, J.-Y. Li (Planetary Science Institute), and the Hubble Comet ISON Imaging Science Team.
NASA’s Swift satellite and the Hubble Space Telescope (HST) have also imaged Comet ISON recently in this region of space. Swift’s ultraviolet observations determined that the comet’s main body was spewing some 850 tons of dust per second at the beginning of the year, leading astronomers to estimate the comet’s nucleus diameter is some 3-4 miles (5-6 kilometers). HST scientists concurred with that size estimate, adding that the comet’s coma measures about 3100 miles (5000 km) across.
The comet gets brighter as the outgassing increases and pushes more dust from the surface of the comet. Scientists are using the comet’s brightness, along with information about the size of the nucleus and measurements of the production of gas and dust, to understand the composition of the ices that control the activity. Most comets brighten significantly and develop a noticeable tail at about the distance of the asteroid belt (about 3 times the Earth-Sun distance –– between the orbits of Mars and Jupiter) because this is when the warming rays of the Sun can convert the water ice inside the comet into a gas. This comet was bright and active outside the orbit of Jupiter — when it was twice as far from the Sun. This meant that some gas other than water was controlling the activity.
Meech said that Comet ISON “…could still become spectacularly bright as it gets very close to the Sun” but also added caution. “I’d be remiss, if I didn’t add that it’s still too early to predict what’s going to happen with ISON since comets are notoriously unpredictable,” she said.


 William Thompson, later known as Lord Kelvin, assumed that the Earth was once a molten ball of rock with the same temperature of the Sun, and then has been cooling ever since. Based on these assumptions, Thompson calculated that the Earth took somewhere between 20 and 400 million years to cool to its current temperature. Of course, Thompson made several inaccurate assumptions, about the temperature of the Sun (it’s really 15 million degrees Kelvin at its core), the temperature of the Earth (with its molten core) and how the Sun is made of hydrogen and the Earth is made of rock and metal.