Ever find yourself thinking about how the Universe came to be, or how humans have evolved to their current level of intelligence, or just why that certain song tugs at your heartstrings? Self-professed wonder junkie Jason Silva has a new video series that feature his reflections on the human condition, the nature of what it means to be alive, and the role of philosophy in everyday life.
Called “Shots of Awe” these under three-minute videos are what Silva calls “inspired nuggets of techno-rapture,” and every week can provide a nudge to contemplate your life; whether it be to look at the complex systems of society, technology, or the beauty of nature and science.
Hang on, though; Silva’s faster-than-thought dialogue takes you for a ride that might leave you spinning … but in a good way!
There are new episodes every Tuesday and below is today’s newest, titled “Singularity.”
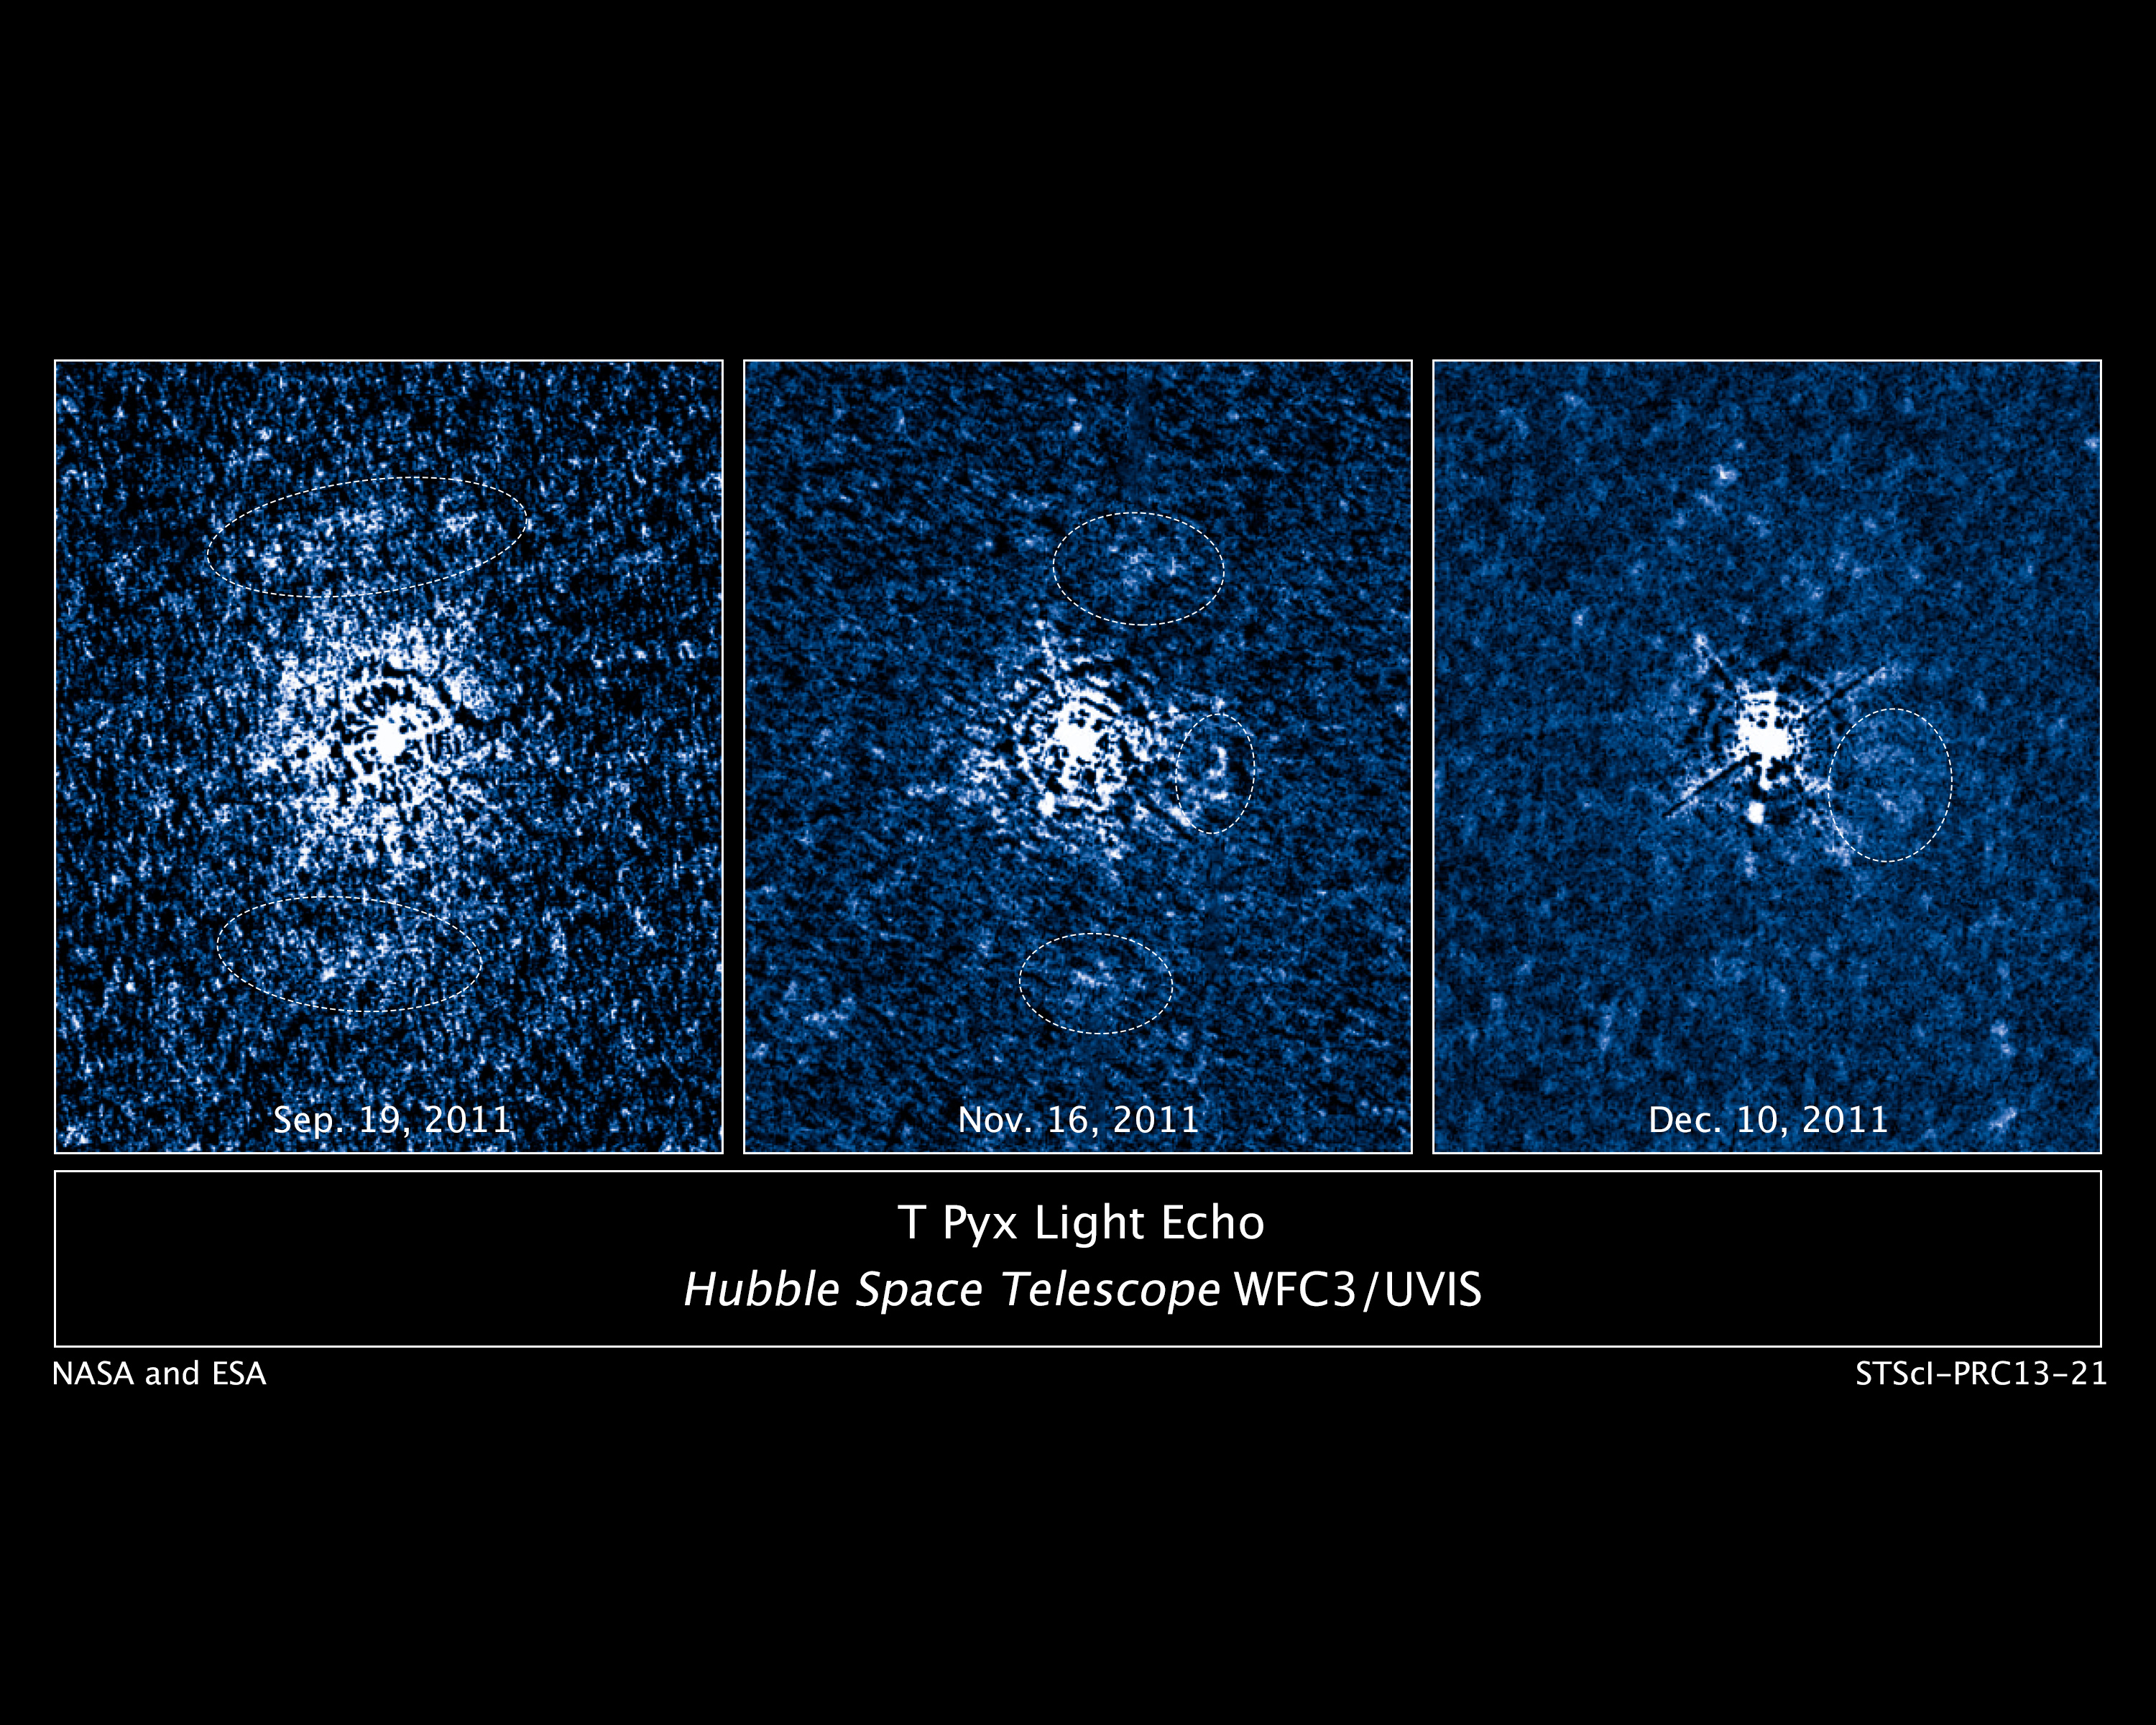
A sequence of images showing the light echo (circled) enshrouding T Pyxidis months after the April 2011 outburst. (Credit: NASA/ESA/A. Crotts/J. Sokoloski, H. Uthas & S. Lawrence).
Some of the most violent events in our Universe were the topic of discussion this morning at the 222nd meeting of the American Astronomical Society in Indianapolis, Indiana as researchers revealed recent observations of light echoes seen as the result of stellar explosions.
A light echo occurs when we see dust and ejected material illuminated by a brilliant nova. A similar phenomenon results in what is termed as a reflection nebula. A star is said to go nova when a white dwarf star siphons off material from a companion star. This accumulated hydrogen builds up under terrific pressure, sparking a brief outburst of nuclear fusion.
A very special and rare case is a class of cataclysmic variables known as recurrent novae. Less than dozen of these types of stars are known of in our galaxy, and the most famous and bizarre case is that of T Pyxidis.
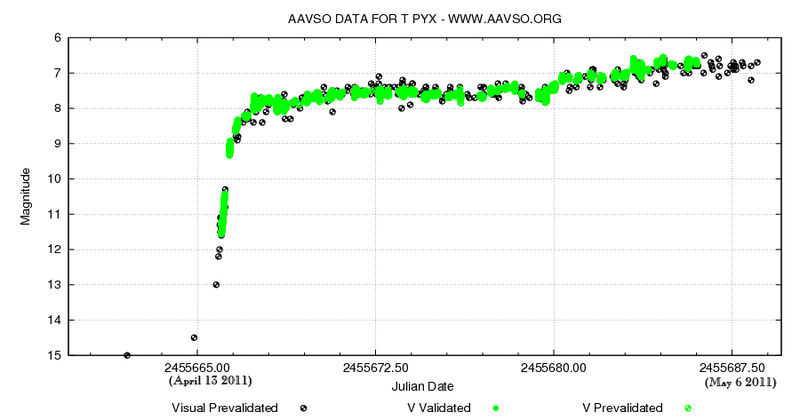
Located in the southern constellation of Pyxis, T Pyxidis generally hovers around +15th magnitude, a faint target even in a large backyard telescope. It has been prone, however, to great outbursts approaching naked eye brightness roughly every 20 years to magnitude +6.4. That’s a change in brightness almost 4,000-fold.
But the mystery has only deepened surrounding this star. Eight outbursts were monitored by astronomers from 1890 to 1966, and then… nothing. For decades, T Pyxidis was silent. Speculation shifted from when T Pyxidis would pop to why this star was suddenly undergoing a lengthy phase of silence.
Could models for recurrent novae be in need of an overhaul?
T Pyxidis finally answered astronomers’ questions in 2011, undergoing its first outburst in 45 years. And this time, they had the Hubble Space Telescope on hand to witness the event.
Light curve of the 2011 eruption of T Pyxidis. (Credit: AAVSO).
In fact, Hubble had just been refurbished during the final visit of the space shuttle Atlantis to the orbiting observatory in 2009 on STS-125 with the installation of its Wide Field Camera 3, which was used to monitor the outburst of T Pyxidis.
The Hubble observation of the light echo provided some surprises for astronomers as well.
“We fully expected this to be a spherical shell,” Said Columbia University’s Arlin Crotts, referring to the ejecta in the vicinity of the star. “This observation shows it is a disk, and it is populated with fast-moving ejecta from previous outbursts.”
Indeed, this discovery raises some exciting possibilities, such as providing researchers with the ability to map the anatomy of previous outbursts from the star as the light echo evolves and illuminates the 3-D interior of the disk like a Chinese lantern. The disk is inclined about 30 degrees to our line of sight, and researchers suggest that the companion star may play a role in the molding of its structure from a sphere into a disk. The disk of material surrounding T Pyxidis is huge, about 1 light year across. This results in an apparent ring diameter of 6 arc seconds (about 1/8th the apparent size of Jupiter at opposition) as seen from our Earthly vantage point.
Paradoxically, light echoes can appear to move at superluminal speeds. This illusion is a result of the geometry of the path that the light takes to reach the observer, crossing similar distances but arriving at different times.
And speaking of distance, measurement of the light echoes has given astronomers another surprise. T Pyxidis is located about 15,500 light years distant, at the higher 10% end of the previous 6,500-16,000 light year estimated range. This means that T Pyxidis is an intrinsically bright object, and its outbursts are even more energetic than thought.
Light echoes have been studied surrounding other novae, but this has been the first time that scientists have been able to map them extensively in 3 dimensions.
An artist’s conception of the disk of material surrounding T Pyxidis. (Credit: ESA/NASA & A. Feild STScl/AURA).
“We’ve all seen how light from fireworks shells during the grand finale will light up the smoke and soot from the shells earlier in the show,” said team member Stephen Lawrence of Hofstra University. “In an analogous way, we’re using light from T Pyx’s latest outburst and its propagation at the speed of light to dissect its fireworks displays from decades past.”
Researchers also told Universe Today of the role which amateur astronomers have played in monitoring these outbursts. Only so much “scope time” exists, very little of which can be allocated exclusively to the study of light echoes. Amateurs and members of the American Association of Variable Star Observers (AAVSO) are often the first to alert the pros that an outburst is underway. A famous example of this occurred in 2010, when Florida-based backyard observer Barbara Harris was the first to spot an outburst from recurrent novae U Scorpii.
And although T Pyxidis may now be dormant for the next few decades, there are several other recurrent novae worth continued scrutiny:
Name
Max brightness
Right Ascension
Declination
Last Eruption
Period(years)
U Scorpii
+7.5
16H 22’ 31”
-17° 52’ 43”
2010
10
T Pyxidis
+6.4
9H 04’ 42”
-32° 22’ 48”
2011
20
RS Ophiuchi
+4.8
17H 50’ 13”
-6° 42’ 28”
2006
10-20
T Coronae Borealis
+2.5
15H 59’ 30”
25° 55’ 13”
1946
80?
WZ Sagittae
+7.0
20H 07’ 37”
+17° 42’ 15”
2001
30
Clearly, recurrent novae have a tale to tell us of the role they play in the cosmos. Congrats to Lawrence and team on the discovery… keep an eye out from future fireworks from this rare class of star!
Artist's concept of Jupiter-sized exoplanet that orbits relatively close to its star (aka. a "hot Jupiter"). Credit: NASA/JPL-Caltech)
Overheated and overinflated, hot Jupiters are some of the strangest extrasolar planets to be discovered by the Kepler mission… and they may be even more exotic than anyone ever thought. A new model proposed by Florida Gulf Coast University astronomer Dr. Derek Buzasi suggests that these worlds are intensely affected by electric currents that link them to their host stars. In Dr. Buzasi’s model, electric currents arising from interactions between the planet’s magnetic field and their star’s stellar wind flow through the interior of the planet, puffing it up and heating it like an electric toaster.
In effect, hot Jupiters are behaving like giant resistors within exoplanetary systems.
Many of the planets found by the Kepler mission are of a type known as “hot Jupiters.” While about the same size as Jupiter in our own solar system, these exoplanets are located much closer to their host stars than Mercury is to the Sun — meaning that their atmospheres are heated to several thousands of degrees.
One problem scientists have had in understanding hot Jupiters is that many are inflated to sizes larger than expected for planets so close to their stars. Explanations for the “puffiness” of these exoplanets have generally involved some kind of extra heating process — but no model successfully explains the observation that more magnetically active stars tend to have puffier hot Jupiters orbiting around them.
“This kind of electric heating doesn’t happen very effectively on planets in our solar system because their outer atmospheres are cold and don’t conduct electricity very well,” says Dr. Buzasi. “But heat up the atmosphere by moving the planet closer to its star and now very large currents can flow, which delivers extra heat to the deep interior of the planet — just where we need it.”
More magnetically active stars have more energetic winds, and would provide larger currents — and thus more heat — to their planets.
The currents start in the magnetosphere, the area where the stellar wind meets the planetary magnetic field, and enter the planet near its north and south poles. This so-called “global electric circuit” (GEC) exists on Earth as well, but the currents involved are only a few thousand amps at 100,000 volts or less.
On the hot Jupiters, though, currents can amount to billions of amps at voltages of millions of volts — a “significant current,” according to Dr. Buzasi.
A Spitzer-generated exoplanet weather map showing temperatures on hot Jupiter HAT-P-2b.
“It is believed that these hot Jupiter planets formed farther out and migrated inwards later, but we don’t yet fully understand the details of the migration mechanism,” Dr. Buzasi says. “The better we can model how these planets are built, the better we can understand how solar systems form. That in turn, would help astronomers understand why our solar system is different from most, and how it got that way.”
Other electrical heating processes have previously been suggested by other researchers as well, once hints of magnetic fields in exoplanets were discovered in 2003 and models of atmospheric wind drag — generating frictional heating — as a result of moving through these fields were made in 2010.
(And before anyone attempts to suggest this process supports the alternative “electric universe” (EU) theory… um, no.)
“No, nothing EU-like at all in my model,” Dr. Buzasi told Universe Today in an email. “I just look at how the field aligned currents that we see in the terrestrial magnetosphere/ionosphere act in a hot Jupiter environment, and it turns out that a significant fraction of the resulting circuit closes inside the planet (in the outer 10% of the radius, mostly) where it deposits a meaningful amount of heat.”
“Being gay doesn’t necessarily define you, it’s just one factor of who you are.”
– NASA Johnson Space Center Deputy Chief of Staff
For over 50 years NASA has inspired people of all ages around the world to set their sights above the sky, to believe in the power of innovation and to not only hope for a better future, but to make it happen. Now, in celebration of LGBT Equality Month, team members from NASA’s Johnson Space Center (and a certain former Starfleet helmsman) tell young people struggling with their identity, “it gets better.”
It’s yet another example of NASA’s commitment to inspiration — regardless of your orientation.
The NASA JSC It Gets Better video is a video project created by the “Out & Allied @ JSC Employee Resource Group” of NASA’s Johnson Space Center. It was created as an outreach tool primarily directed at high school and college-aged lesbian, gay, bisexual, transgender, queer and questioning (LGBTQ) individuals who are victims of bullying and/or have been affected by bullying. This video sends the message to current and future NASA employees that it is OK to be LGBTQ, and that NASA JSC management supports and encourages an inclusive, diverse workforce in our workplace.
Established in 1961 as the Manned Spaceflight Center, NASA’s Johnson Space Center has served as a hub of human spaceflight activity for more than half a century. As the nucleus of the nation’s astronaut corps and home to International Space Station mission operations and a host of future space developments, the center plays a pivotal role in surpassing the physical boundaries of Earth and enhancing technological and scientific knowledge to benefit all of humankind.
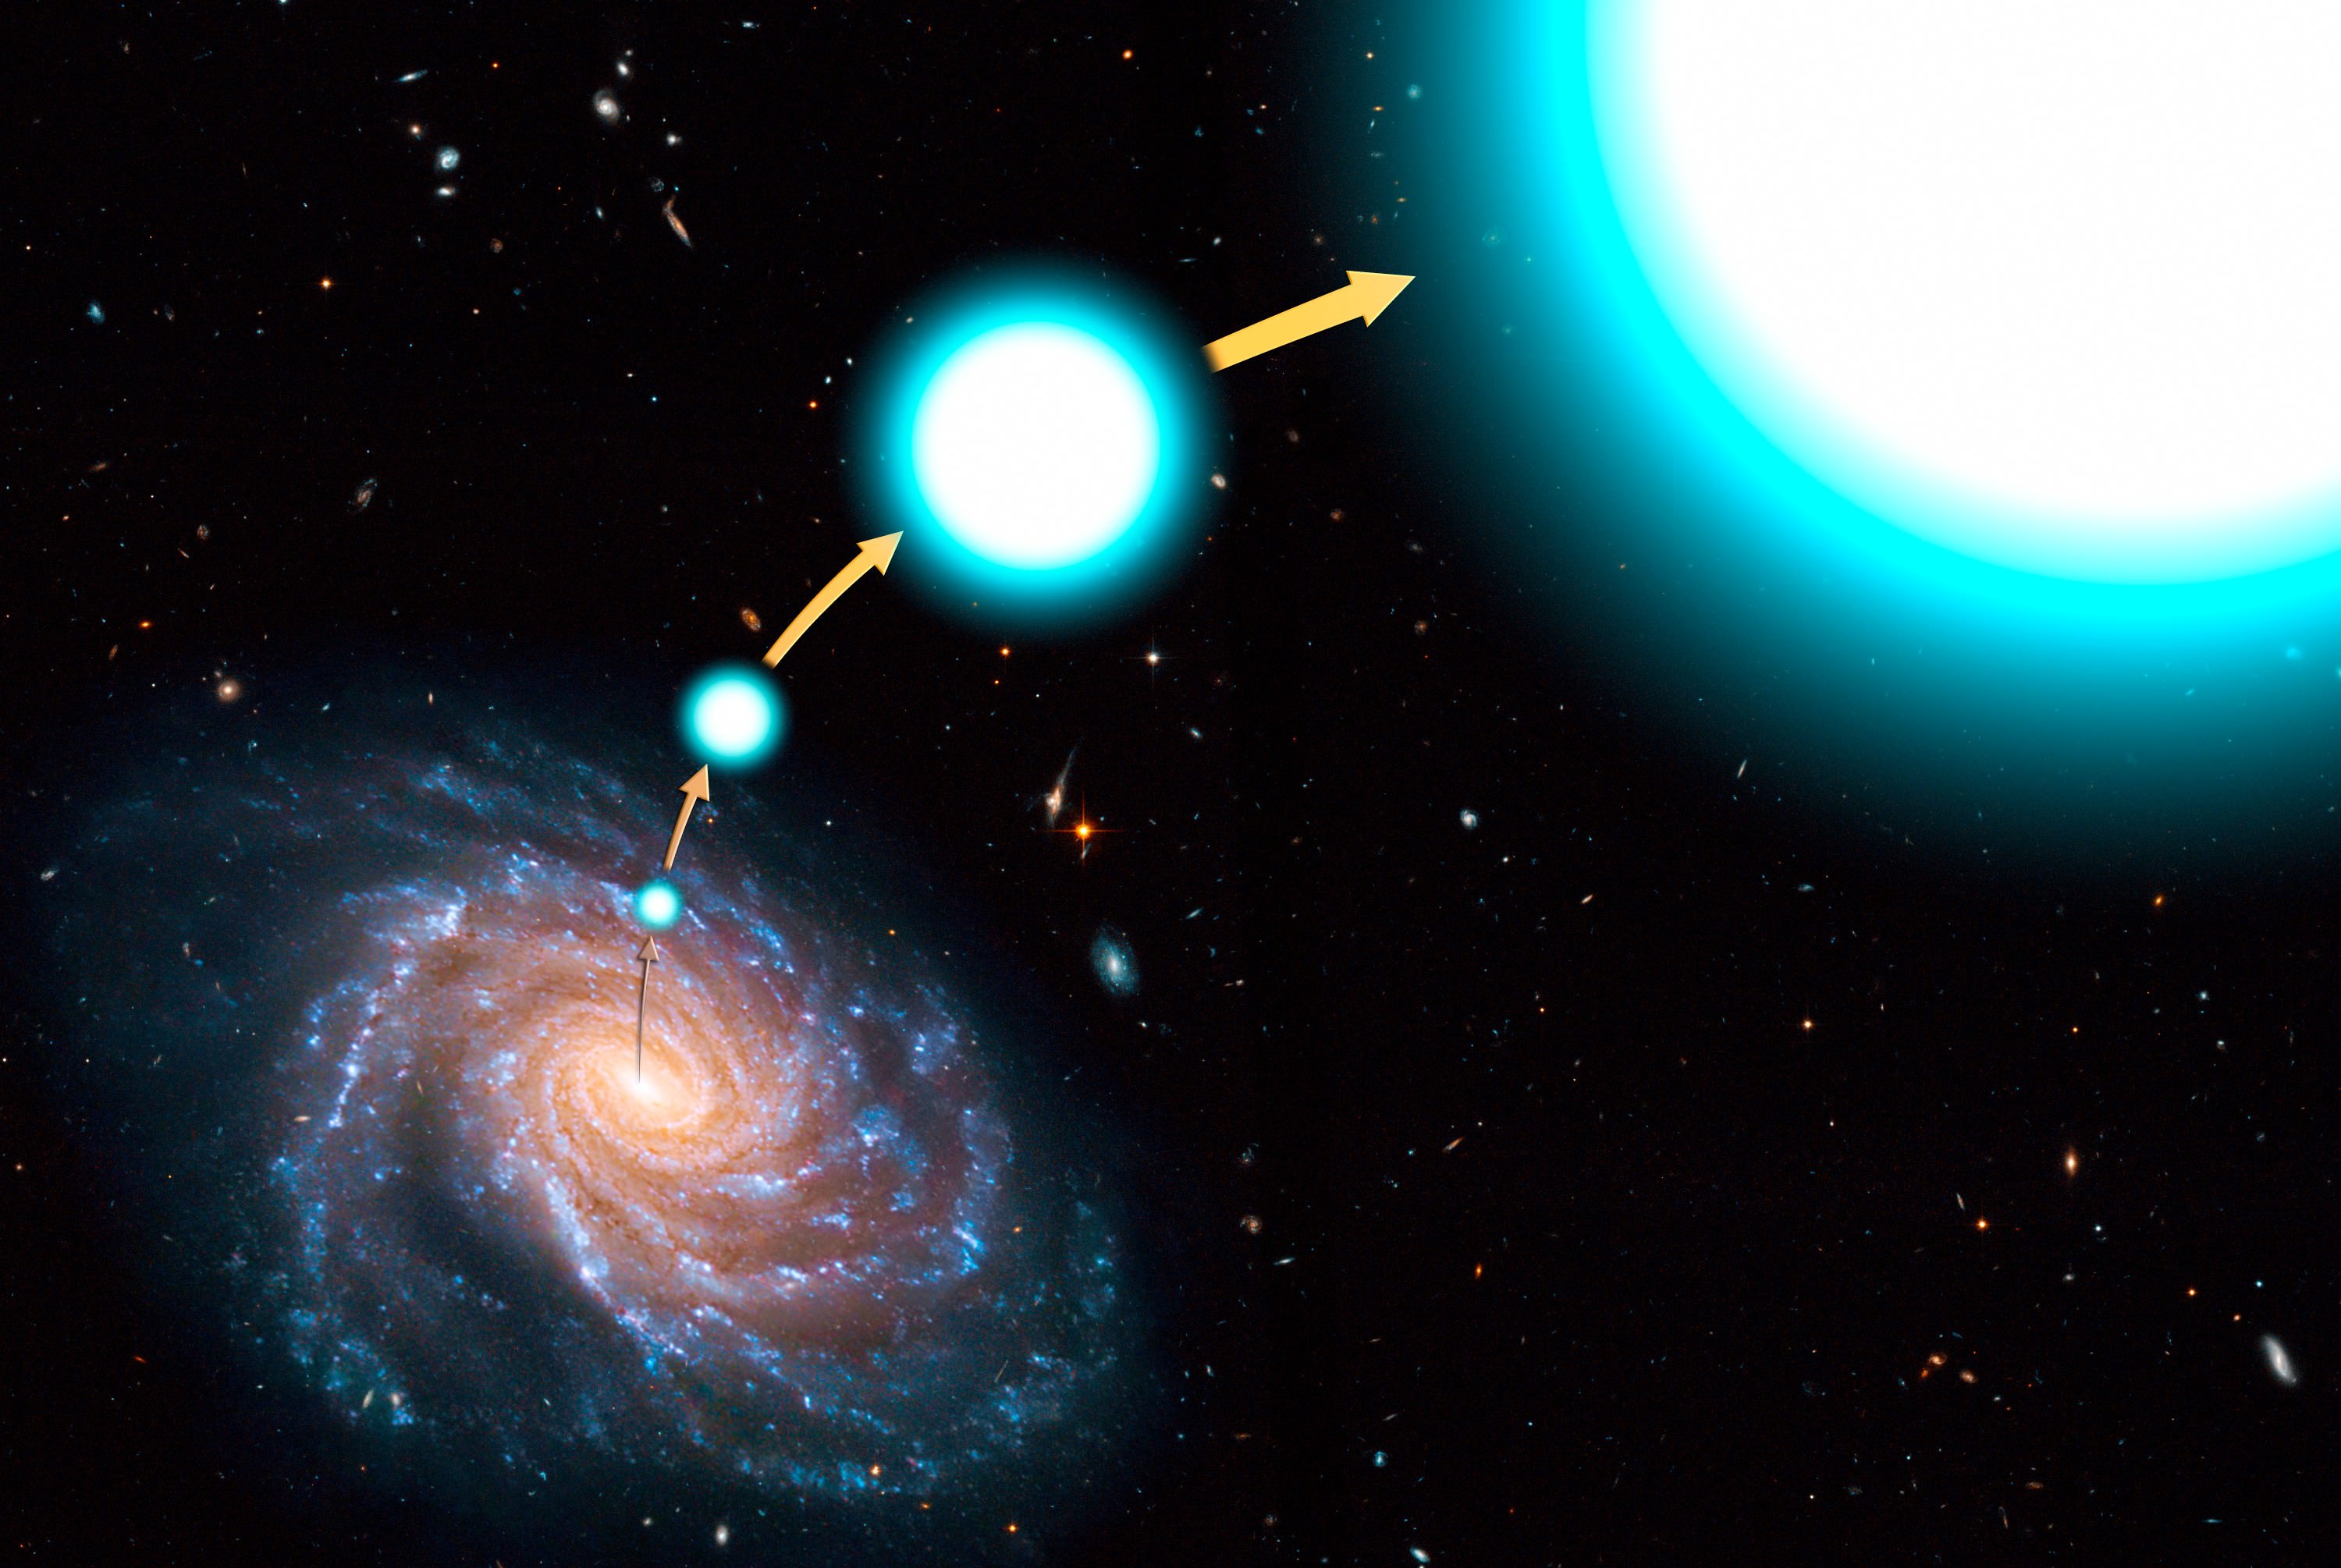
An artist's conception of a hypervelocity star that has escaped the Milky Way. Credit: NASA
The Sun is racing through the Galaxy at a speed that is 30 times greater than a space shuttle in orbit (clocking in at 220 km/s with respect to the galactic center). Most stars within the Milky Way travel at a relatively similar speed. But certain stars are definitely breaking the stellar speed limit. About one in a billion stars travel at a speed roughly 3 times greater than our Sun – so fast that they can easily escape the galaxy entirely!
We have discovered dozens of these so-called hypervelocity stars. But how exactly do these stars reach such high speeds? Astronomers from the University of Leicester may have found the answer.
The first clue comes in observing hypervelocity stars, where we can note their speed and direction. From these two measurements, we can trace these stars backward in order to find their origin. Results show that most hypervelocity stars begin moving quickly in the Galactic Center.
We now have a rough idea of where these stars gain their speed, but not how they reach such high velocities. Astronomers think two processes are likely to kick stars to such great speeds. The first process involves an interaction with the supermassive black hole (Sgr A*) at the center of our Galaxy. When a binary star system wanders too close to Sgr A*, one star is likely to be captured, while the other star is likely to be flung away from the black hole at an alarming rate.
The second process involves a supernova explosion in a binary system. Dr. Kastytis Zubovas, lead author on the paper summarized here, told Universe Today, “Supernova explosions in binary systems disrupt those systems and allow the remaining star to fly away, sometimes with enough velocity to escape the Galaxy.”
There is, however, one caveat. Binary stars in the center of our Galaxy will both be orbiting each other and orbiting Sgr A*. They will have two velocities associated with them. “If the velocity of the star around the binary’s center of mass happens to line up closely with the velocity of the center of mass around the supermassive black hole, the combined velocity may be large enough to escape the Galaxy altogether,” explained Zubovas.
In this case, we can’t sit around and wait to observe a supernova explosion breaking up a binary system. We would have to be very lucky to catch that! Instead, astronomers rely on computer modeling to recreate the physics of such an event. They set up multiple calculations in order to determine the statistical probability that the event will occur, and check if the results match observations.
Astronomers from the University of Leicester did just this. Their model includes multiple input parameters, such as the number of binaries, their initial locations, and their orbital parameters. It then calculates when a star might undergo a supernova explosion, and depending on the position of the two stars at that time, the final velocity of the remaining star.
The probability that a supernova disrupts a binary system is greater than 93%. But does the secondary star then escape from the galactic center? Yes, 4 – 25% of the time. Zubovas described, “Even though this is a very rare occurrence, we may expect several tens of such stars to be created over 100 million years.” The final results suggest that this model ejects stars with rates high enough to match the observed number of hypervelocity stars.
Not only do the number of hypervelocity stars match observations but also their distribution throughout space. “Hypervelocity stars produced by our supernova disruption method are not evenly distributed on the sky,” said Dr. Graham Wynn, a co-author on the paper. “They follow a pattern which retains an imprint of the stellar disk they formed in. Observed hypervelocity stars are seen to follow a pattern much like this.”
In the end, the model was very successful at describing the observed properties of hypervelocity stars. Future research will include a more detailed model that will allow astronomers to understand the ultimate fate of hypervelocity stars, the effect that supernova explosions have on their surroundings, and the galactic center itself.
It’s likely that both scenarios – binary systems interacting with the supermassive black hole and one undergoing a supernova explosion – form hypervelocity stars. Studying both will continue to answer questions about how these speedy stars form.
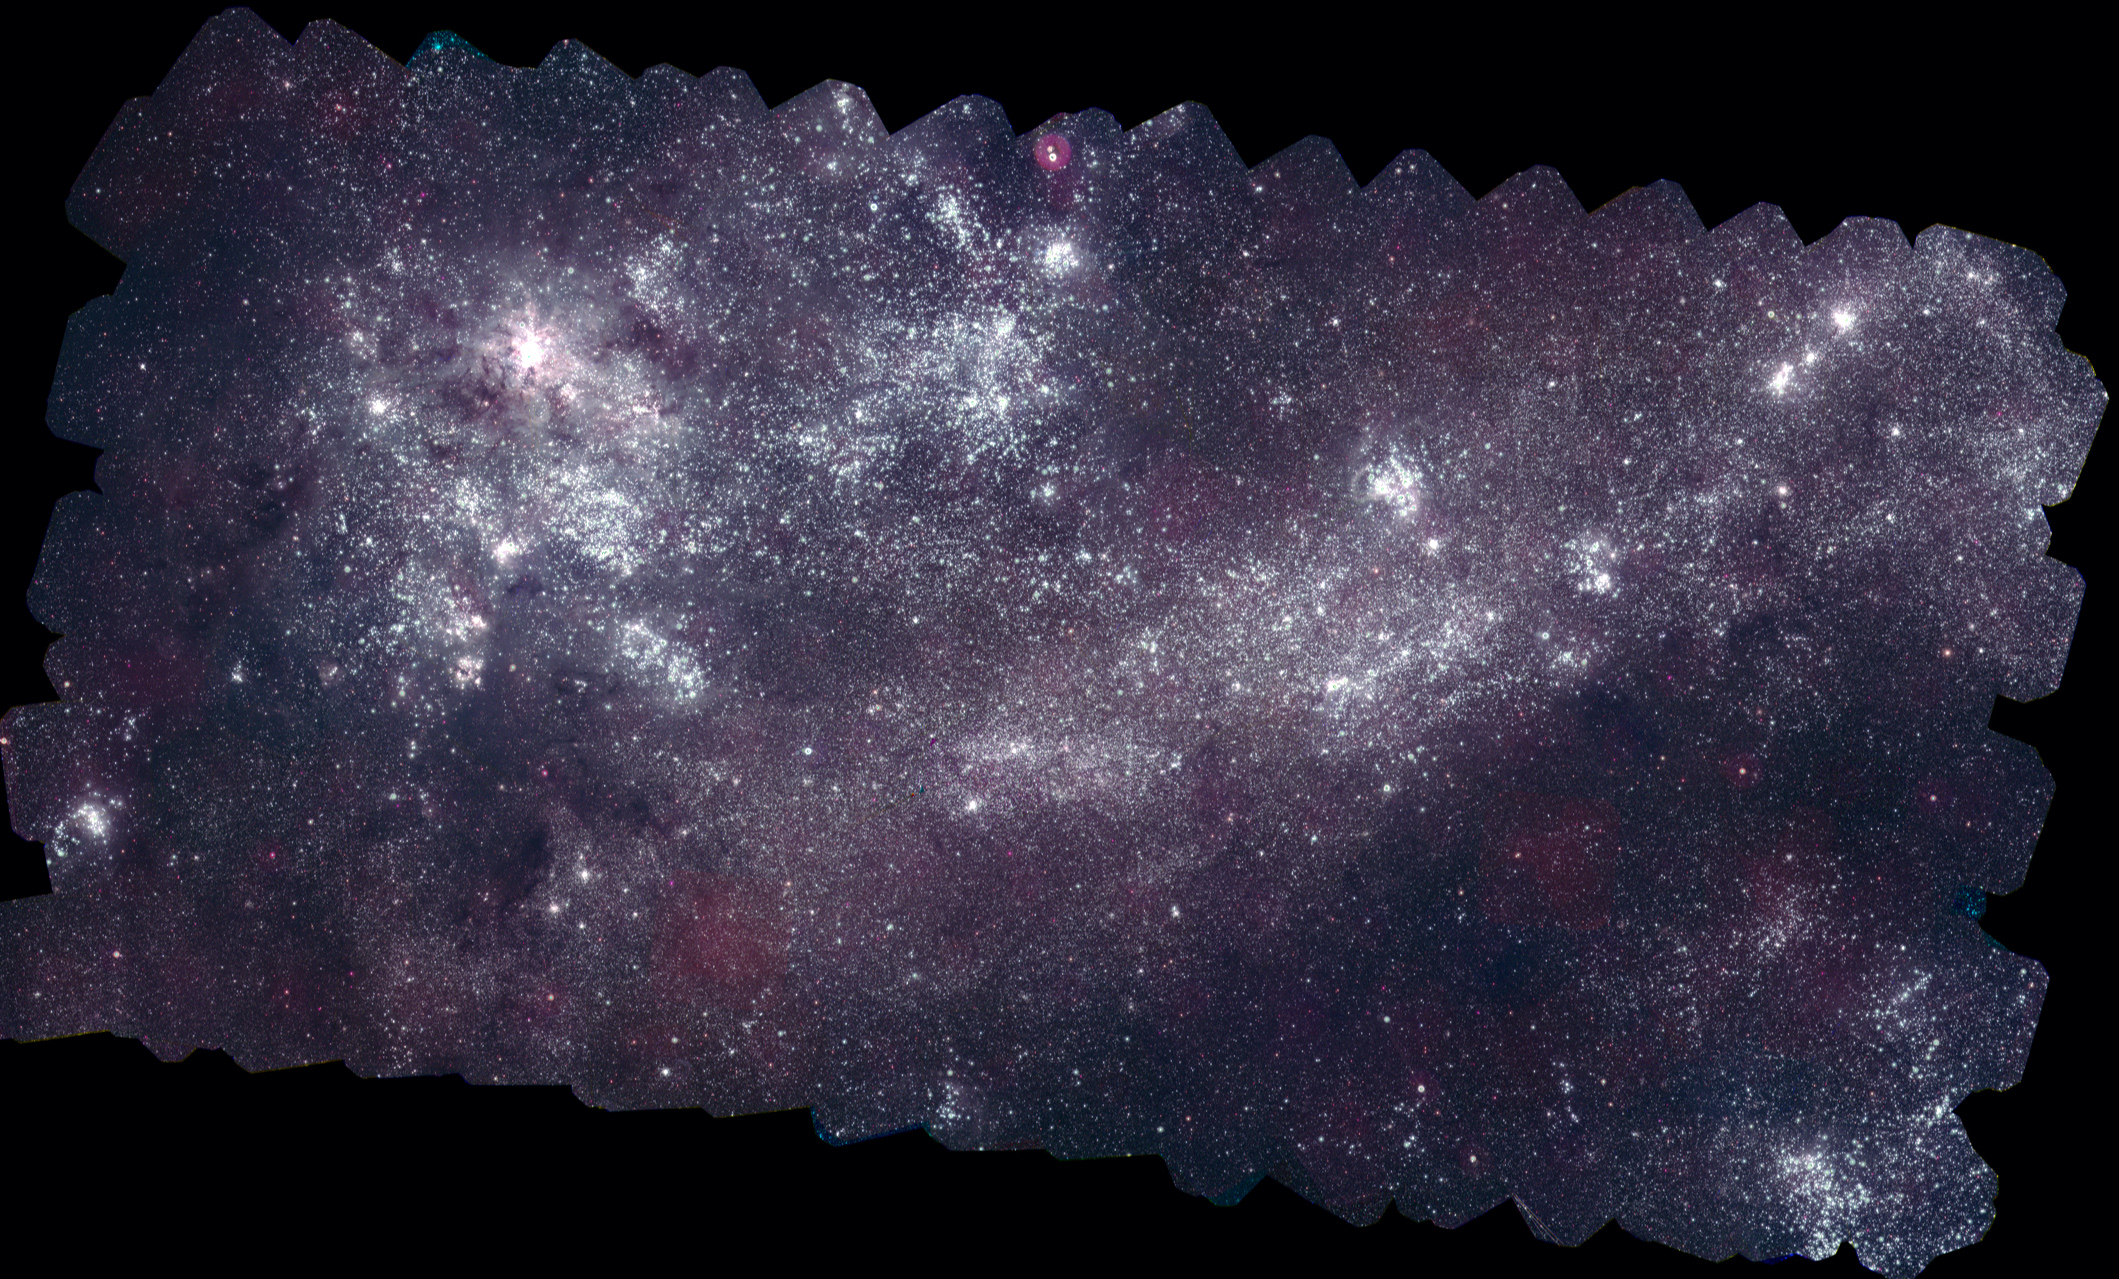
An ultraviolet view of the Large Magellanic Cloud from Swift's Ultraviolet/Optical Telescope. Almost 1 million ultraviolet sources are visible in the image, which took 5.4 days of cumulative exposure to do. The wavelengths of UV shown in this picture are mostly blocked on Earth's surface. Credit: NASA/Swift/S. Immler (Goddard) and M. Siegel (Penn State)
Earth’s galactic next-door neighbors shine brighter than ever in new pictures taken by an orbiting telescope, focusing on ultraviolet light that is tricky to image from the surface.
The Large Magellanic Cloud (LMC) and Small Magellanic Cloud (SMC) — the two largest major galaxies near our own, the Milky Way — were imaged in 5.4 days and 1.8 days of cumulative exposure time, respectively. These produced two gorgeous, high-resolution photos in a spot of the light spectrum normally invisible to humans.
“Prior to these images, there were relatively few UV observations of these galaxies, and none at high resolution across such wide areas, so this project fills in a major missing piece of the scientific puzzle,” stated Michael Siegel, lead scientist for Swift’s Ultraviolet/Optical Telescope at the Swift Mission Operations Center at Pennsylvania State University.
Science isn’t interested in these pictures — taken in wavelengths ranging from 1,600 to 3,300 angstroms, mostly blocked in Earth’s atmosphere — because of their pretty face, however. Ultraviolet light pictures let the hottest stars and star-forming areas shine out, while in visible light those hotspots are suppressed.
“With these mosaics, we can study how stars are born and evolve across each galaxy in a single view, something that’s very difficult to accomplish for our own galaxy because of our location inside it,” stated Stefan Immler, an associate research scientist at NASA Goddard Space Flight Center and the lead of the SWIFT guest investigator program.
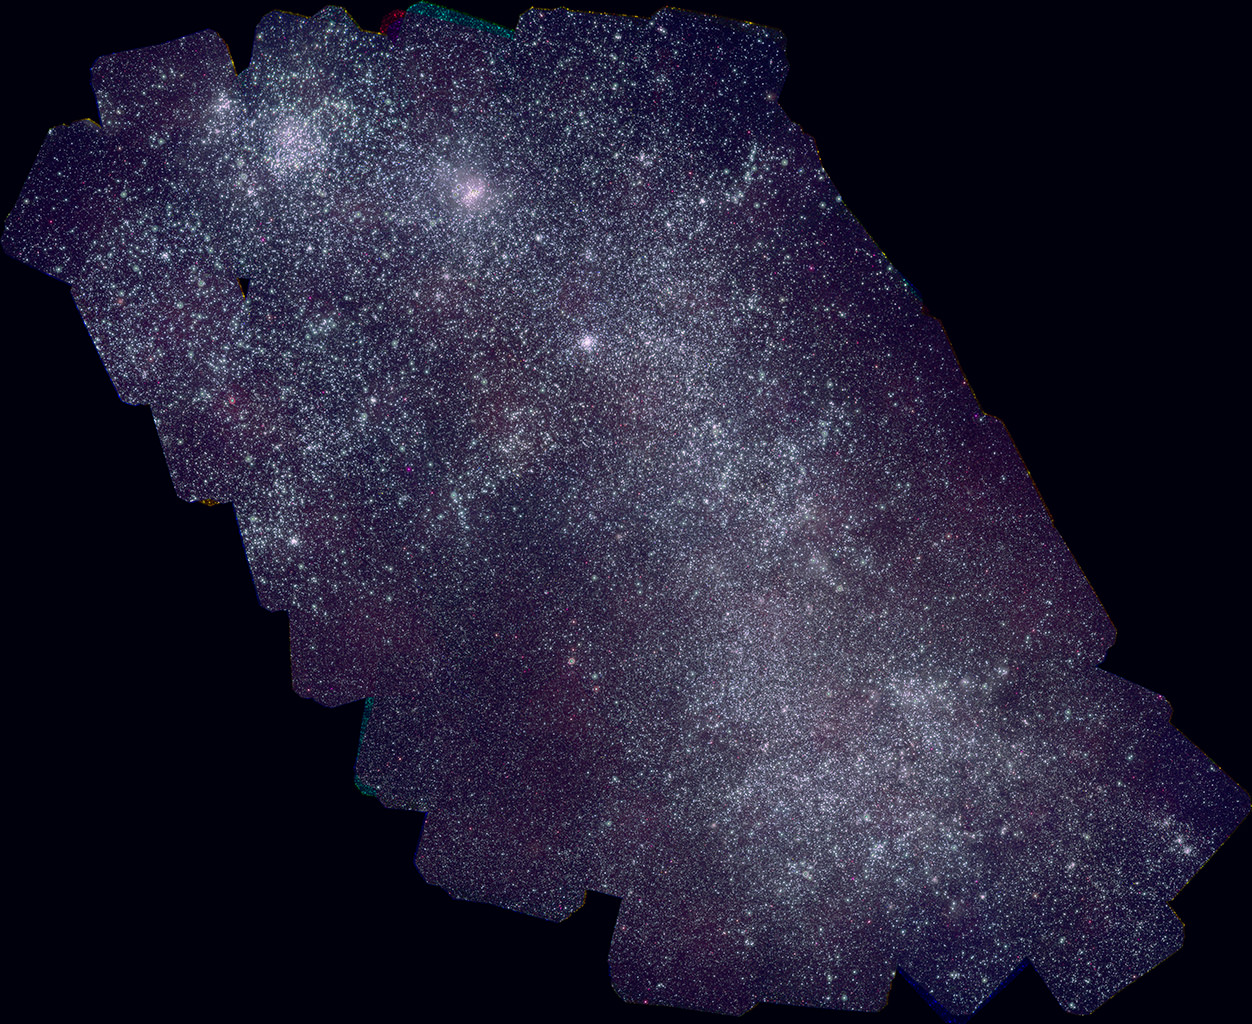
The Small Magellanic Cloud as seen by Swift’s Ultraviolet/Optical Telescope. This composite of 656 separate pictures has a cumulative exposure time of 1.8 days. Credit: NASA/Swift/S. Immler (Goddard) and M. Siegel (Penn State)
Although the galaxies are relatively small, they easily shine in our night sky because they’re so close to Earth — 163,000 light-years for the LMC, and 200,000 light years for the SMC.
The LMC is only about 1/10 of the Milky Way’s size, with 1% of the Milky Way’s mass. The punier SMC is half of LMC’s size with only two-thirds of that galaxy’s mass.
Immler revealed the large images — 160 megapixels for the LMC, and 57 megapixels for the SMC — at the American Astronomical Society meeting in Indianapolis on Monday (June 3.)
NASA’s CIBER experiment seeks clues to the formation of the first stars and galaxies. It will study the total sky brightness, to probe the component from first stars and galaxies using spectral signatures, and searches for the distinctive spatial pattern seen in this image, produced by large-scale structures from dark matter. This shows a numerical simulation of the density of matter when the universe was one billion years old. Galaxies formation follows the gravitational wells produced by dark matter, where hydrogen gas coalesces, and the first stars ignite. Credit: Volker Springel/Virgo Consortium.
When did the first stars and galaxies form in the universe and how brightly did they burn?
Scientists are looking for tell-tale signs of galaxy formation with an experimental payload called CIBER.
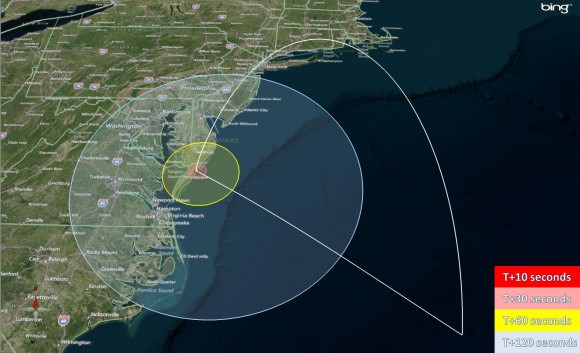
NASA will briefly turn night into day near midnight along the mid-Atlantic coastline on June 4 – seeking answers to illuminate researchers theories about the beginnings of our Universe with the launch of the Cosmic Infrared Background ExpeRiment (CIBER) from NASA’s launch range at the Wallops Flight Facility along Virginia’s eastern shoreline. See viewing map below.
CIBER will blast off atop a powerful four stage Black Brant XII suborbital rocket at 11 PM EDT Tuesday night, June 4. The launch window extends until 11:59 PM EDT.
Currently the weather forecast is excellent.
The public is invited to observe the launch from an excellent viewing site at the NASA Visitor Center at Wallops which will open at 9:30 PM on launch day.
The night launch will be visible to spectators along a long swath of the US East coast from New Jersey to North Carolina; if the skies are clear as CIBER ascends to space to an altitude of over 350 miles and arcs over on a southeasterly trajectory.
Backup launch days are available from June 5 through 10.
Launch visibility map for the CIBER payload launch from NASA Wallops, Va, on June 4, 2013 at 11 PM EDT. Credit: NASA
“The objectives of the experiment are of fundamental importance for astrophysics: to probe the process of first galaxy formation. The measurement is extremely difficult technically,” said Jamie Bock, CIBER principal investigator from the California Institute of Technology
Over the past several decades more than 20,000 sounding rockets have blasted off from an array of launch pads at Wallops, which is NASA’s lead center for suborbital science.
The Black Brant XII sounding rocket is over 70 feet tall.
The launch pad sits adjacent to the newly constructed Pad 0A of the Virginia Spaceflight Authority from which the Orbital Sciences Antares rocket blasted off on its maiden flight on April 21, 2013.
“The first massive stars to form in the universe produced copious ultraviolet light that ionized gas from neutral hydrogen. CIBER observes in the near infrared, as the expansion of the universe stretched the original short ultraviolet wavelengths to long near-infrared wavelengths today.”
“CIBER investigates two telltale signatures of first star formation — the total brightness of the sky after subtracting all foregrounds, and a distinctive pattern of spatial variations,” according to Bock.
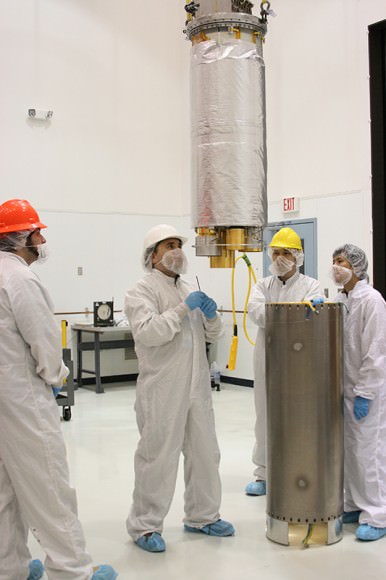
Preparing the CIBER instrument for flight. The optics and detectors are cooled by liquid nitrogen to -19C (77 K, -312F) during the flight to eliminate infrared emission from the instrument and to achieve the best detector sensitivity. Photo: NASA/Berit Bland
This will be the fourth launch of CIBER since 2009 but the first from Wallops. The three prior launches were all from the White Sands Missile Range, N.M. and in each case the payload was recovered and refurbished for reflight.
However the June 4 launch will also be the last hurrah for CIBER.
The scientists are using a more powerful Black Brant rocket to loft the payload far higher than ever before so that it can make measurements for more than twice as long as ever before.
The consequence of flying higher is that CIBER will splashdown in the Atlantic Ocean, about 400 miles off the Virgina shore and will not be recovered.
You can watch the launch live on NASA Ustream beginning at 10 p.m. on launch day at: http://www.ustream.com/channel/nasa-wallops
I will be onsite at Wallops for Universe Today.
And don’t forget to “Send Your Name to Mars” aboard NASA’s MAVEN orbiter- details here. Deadline: July 1, 2013
…………….
Learn more about Conjunctions, Mars, Curiosity, Opportunity, MAVEN, LADEE and NASA missions at Ken’s upcoming lecture presentations
June 4: “Send your Name to Mars on MAVEN” and “CIBER Astro Sat, LADEE Lunar & Antares Rocket Launches from Virginia”; Rodeway Inn, Chincoteague, VA, 8:30 PM
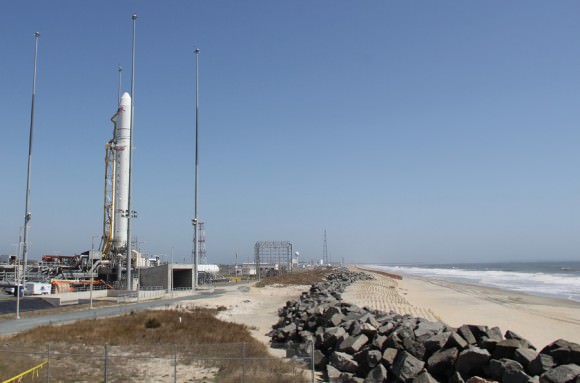
NASA’s CIBER payload will launch from a suborbital launch pad located directly behind this Antares rocket erected at Pad 0A at the NASA Wallops Flight Facility along the Eastern shore of Virginia. Only a few hundred feet of beach sand and a miniscule sea wall separate the Wallops Island pads from the Atlantic Ocean waves and Mother Nature.
Credit: Ken Kremer (kenkremer.com)
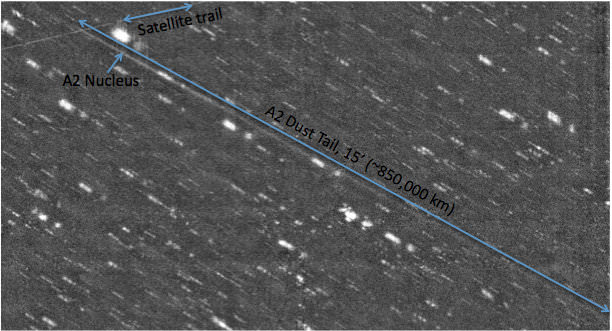
The dust tail on Asteroid P/2010 A2 (LINEAR) has grown to over 1 million kilometers long. Image taken with the new One Degree Imager (ODI), a wide field optical camera at the WIYN telescope on Kitt Peak.
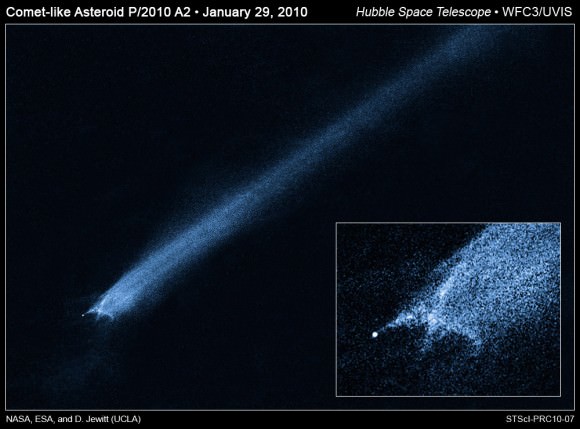
A strange comet-like object discovered in 2010 ended up being an asteroid that had been the victim of a head-on collision from another space rock. The object created a bit of buzz because of its mysterious X-shaped debris pattern and long, trailing streamers of dust. Named P/2010 A2 (LINEAR), the object is located in the asteroid belt between Mars and Jupiter, and has been the focus of much study, including images taken by the Hubble Space Telescope and many ground-based observatories. But over time, the asteroid’s long dust tail has grown to be so long that the entire object can’t fit into the field of view of most observatories.
“Here, we are watching the death of an asteroid,” said Jayadev Rajagopal, a scientist at the WIYN (Wisconsin Indiana at Yale NOAO) Telescope, speaking today at the American Astronomical Society meeting in Indianapolis, Indiana. “We know of dozens of asteroids this has happened to in the past, but this is the only one showing us the event as it is happening.”
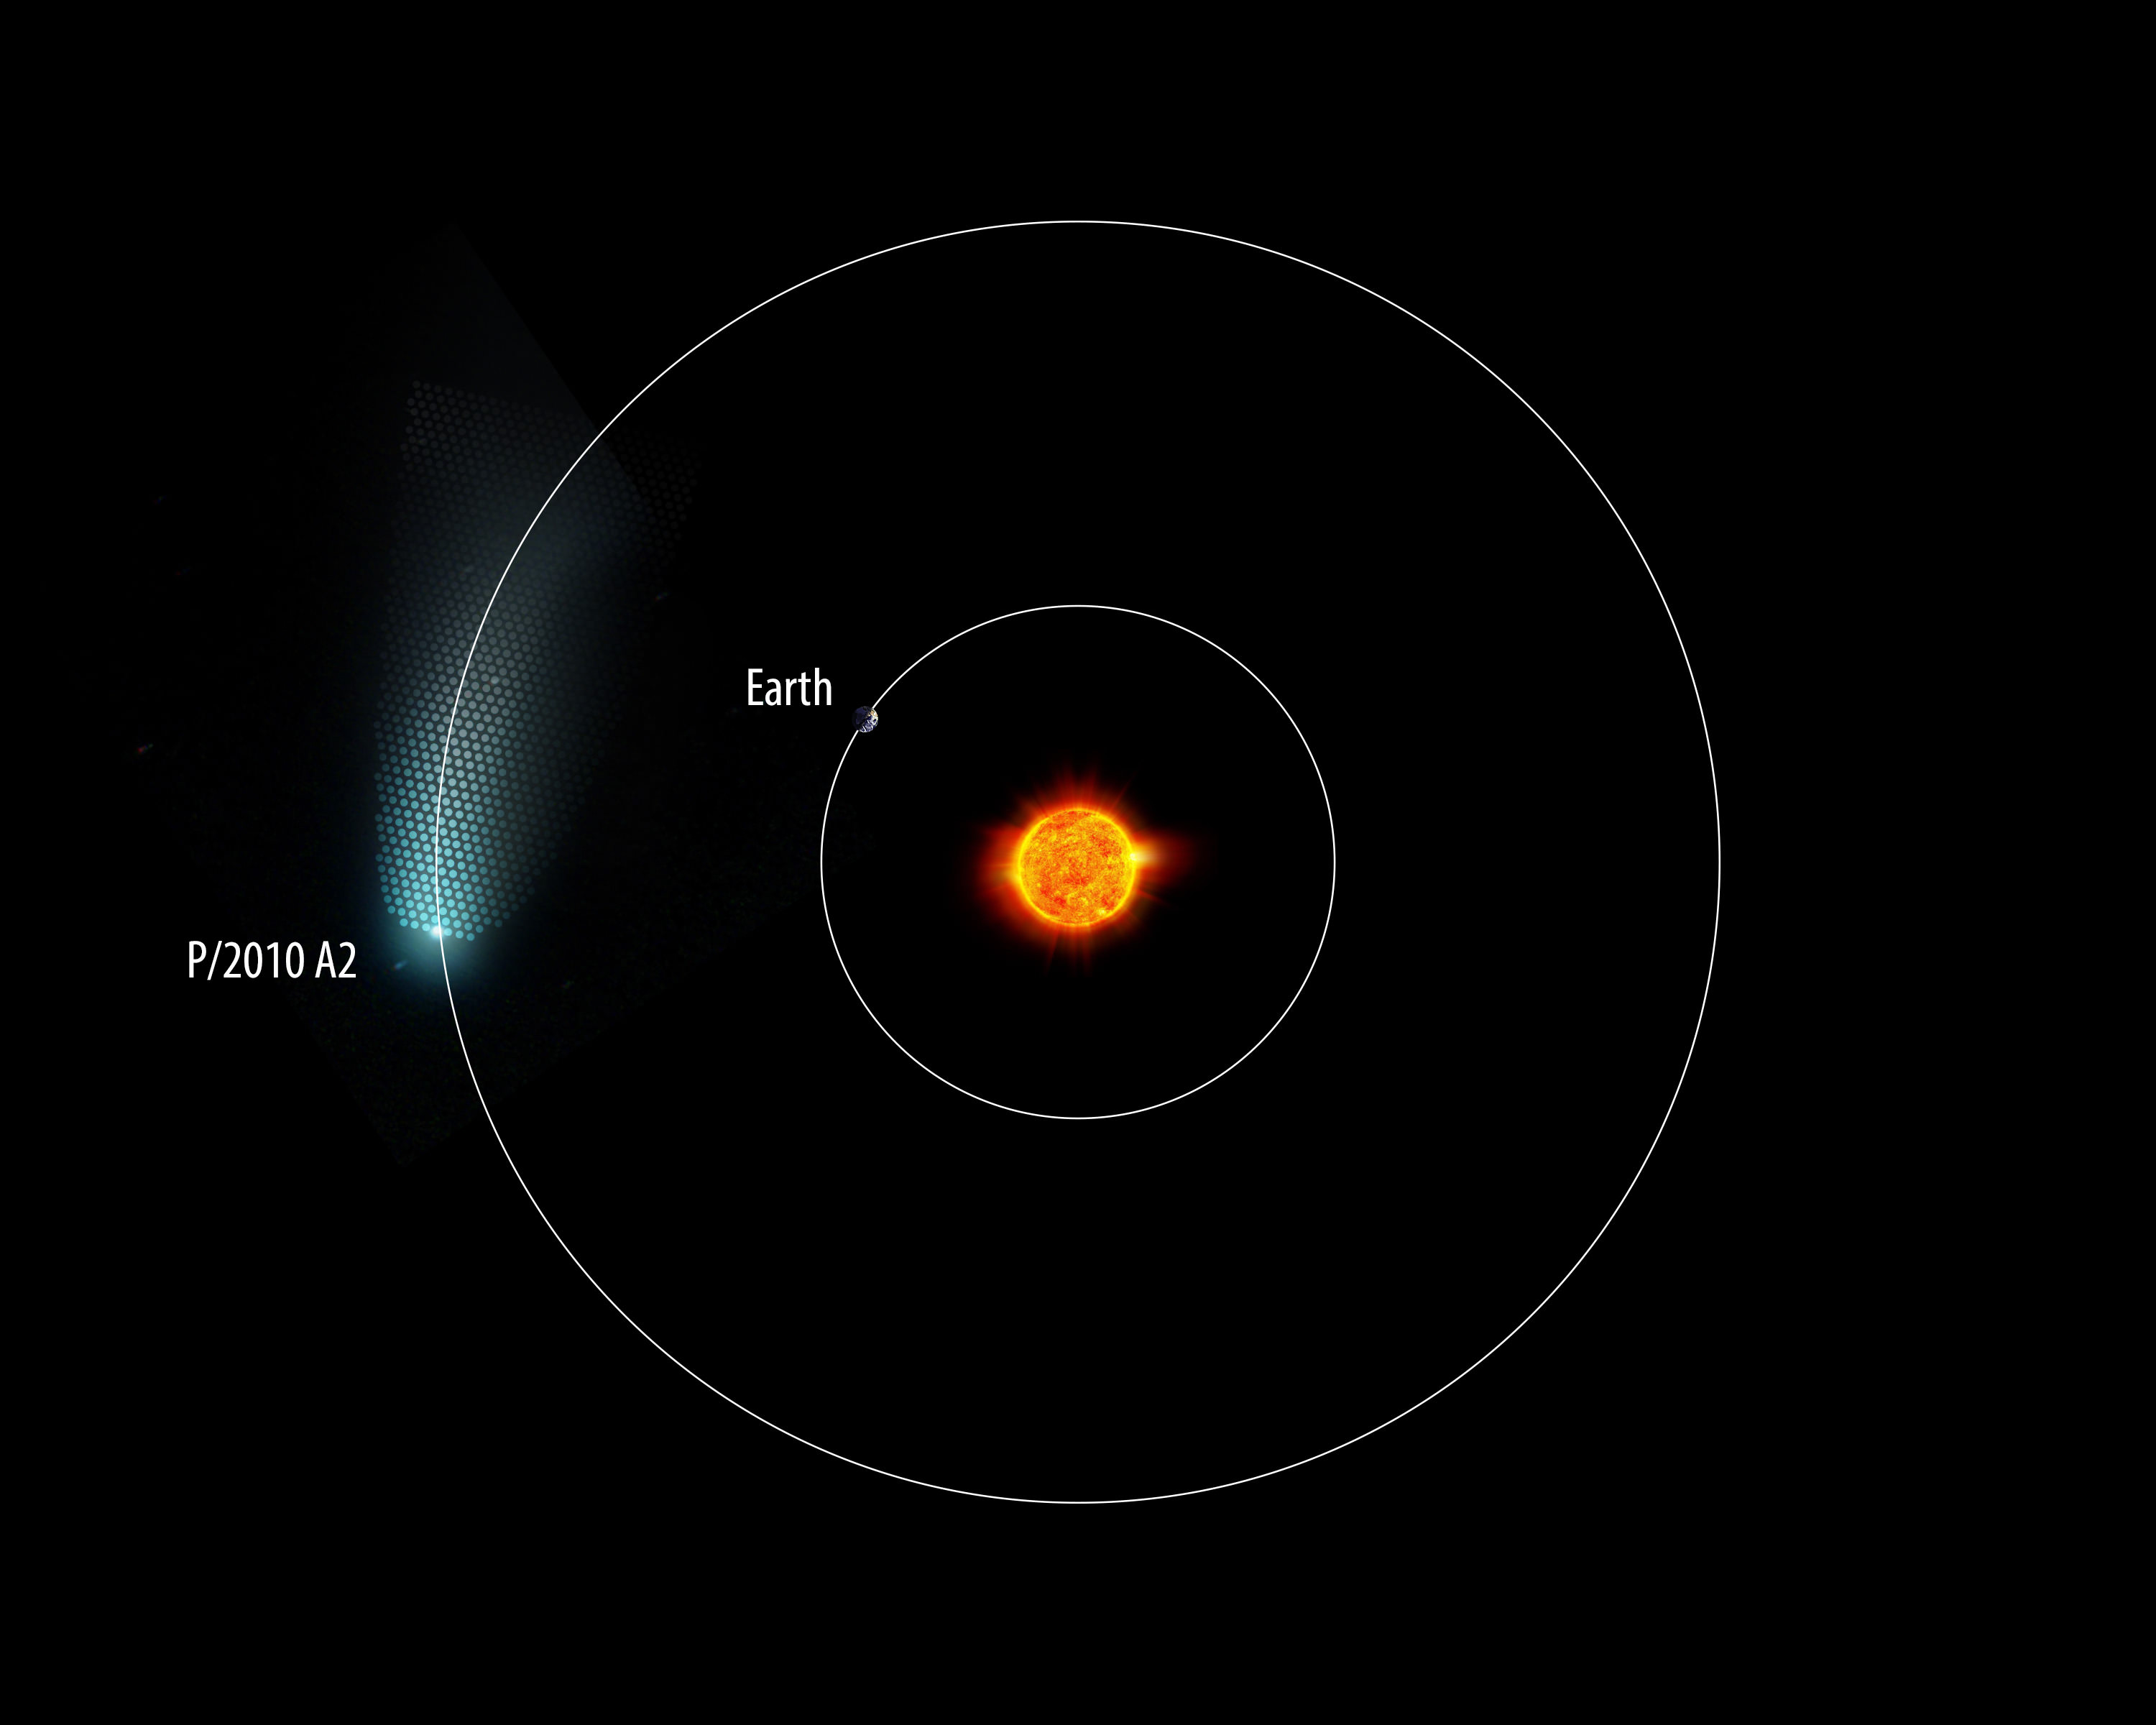
A graphic showing the orbit of Asteroid P/2010 A2. Credit: WIYN telescope.
Using the new wide-field camera at the WIYN 3.5 meter telescope, Rajagopal and his team have found that the peculiar asteroid P/2010 A2’s tail is much longer than was previously supposed. The tail is about a million kilometers long, roughly three times the distance from the Earth to the Moon. The new One Degree Imager (ODI) can currently image an area of the sky about the size of the full moon: a future upgrade will increase the size of the field to about four times as large.
“Three and a half years after the initial disruption, and almost a full orbit around the Sun, the tail is still visible and growing,” said Rajagopal. “One of the reasons it is so long is that radiation pressure and gravity are stretching out the tail. It will progressively grow and sweep out into the ecliptic.”
He added that imaging the full extent of the tail will help pin down the total mass in the dust tail, as well as helping to determine the size of dust particles.
Hubble Views of Comet-like Asteroid P/2010 A2. Credit: NASA, ESA, and D. Jewitt (UCLA)
Asteroid collisions are thought to be a commonplace occurrence, and are responsible for kicking up dust in our Solar System and probably other planetary systems, too. Just how much dust is produced, and how frequent the collisions happen is still a hazy topic. But the observations of P/2010 A2 are helping astronomers to better model this phenomenon. By figuring out how much dust is produced by the process of ‘collisional grinding,’ astronomers can better model the dusty debris disks of other planetary systems, as well as our own.
“This object is giving us insight into the interplay between asteroids and debris disks,” Rajagopal said. “How much dust do objects like this contribute to our zodiacal dust disk to keep it replenished? This dust must be constantly replenished because it is constantly being destroyed by radiation. The very unusual tail of this active asteroid will help us pin down the mass of the tail, and in a broader context, help us understand how asteroids brought organics and other materials into the inner planets.”
Rajagopal also said this the tail of Asteroid P/2010 A2 is a meteor stream in the making. “It will eventually sweep into the Earth’s orbit and give us a meteorite stream, sending some meteorites our way, maybe a million years from now.”
When we look at the night sky, filled with stars, it’s hard to resist counting. Just with the unaided eye, in dark skies, you can see a few thousand.
How many stars are there in the entire Universe? Before we get to that massive number, let’s consider what you can count with the tools available to you.
Perfect vision in dark skies allows us to see stars down to about magnitude 6. But to really make an accurate census of the total number of stars, you’d need to travel to both the Northern and Southern Hemispheres, since only part of the sky is visible from each portion of the Earth. Furthermore, you’d need to make your count over several months, since a portion of the sky is obscured by the Sun. If you had perfect eyesight and traveled to completely dark skies in both the Northern and Southern Hemispheres, and there was no Moon, you might be able to get to count up almost 9,000 stars.
With a good pair of binoculars, that number jumps to about 200,000, since you can observe stars down to magnitude 9. A small telescope, capable of resolving magnitude 13 stars will let you count up to 15 million stars. Large observatories could resolve billions of stars.
But how many stars are out there? How many stars are there in the Milky Way?
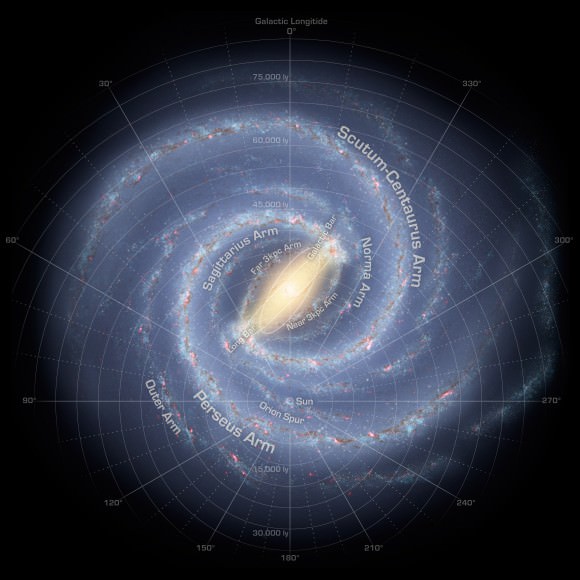
Milky Way. Image credit: NASA
According to astronomers, our Milky Way is an average-sized barred spiral galaxy measuring up to 120,000 light-years across. Our Sun is located about 27,000 light-years from the galactic core in the Orion arm. Astronomers estimate that the Milky Way contains up to 400 billion stars of various sizes and brightness.
A few are supergiants, like Betelgeuse or Rigel. Many more are average-sized stars like our Sun. The vast majority of stars in the Milky Way are red dwarf stars; dim, low mass, with a fraction of the brightness of our Sun.
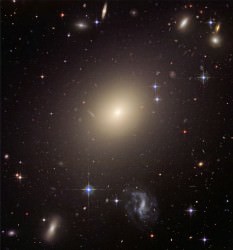
As we peer through our telescopes, we can see fuzzy patches in the sky which astronomers now know are other galaxies like our Milky Way. These massive structures can contain more or less stars than our own Milky Way.
Elliptical galaxy ESO 325-G004. ESO
There are spiral galaxies out there with more than a trillion stars, and giant elliptical galaxies with 100 trillion stars.
And there are tiny dwarf galaxies with a fraction of our number of stars.
So how many galaxies are there?
According to astronomers, there are probably more than 170 billion galaxies in the observable Universe, stretching out into a region of space 13.8 billion light-years away from us in all directions.
And so, if you multiply the number of stars in our galaxy by the number of galaxies in the Universe, you get approximately 1024 stars. That’s a 1 followed by twenty-four zeros.
That’s a septillion stars.
But there could be more than that.
It’s been calculated that the observable Universe is a bubble of space 47 billion years in all directions.
It defines the amount of the Universe that we can see, because that’s how long light has taken to reach us since the Big Bang.
This is a minimum value, the Universe could be much bigger – it’s just that we can’t ever detect those stars because they’re outside the observable Universe. It’s even possible that the Universe is infinite, stretching on forever, with an infinite amount of stars. So add a couple more zeros. Maybe an infinite number of zeroes.
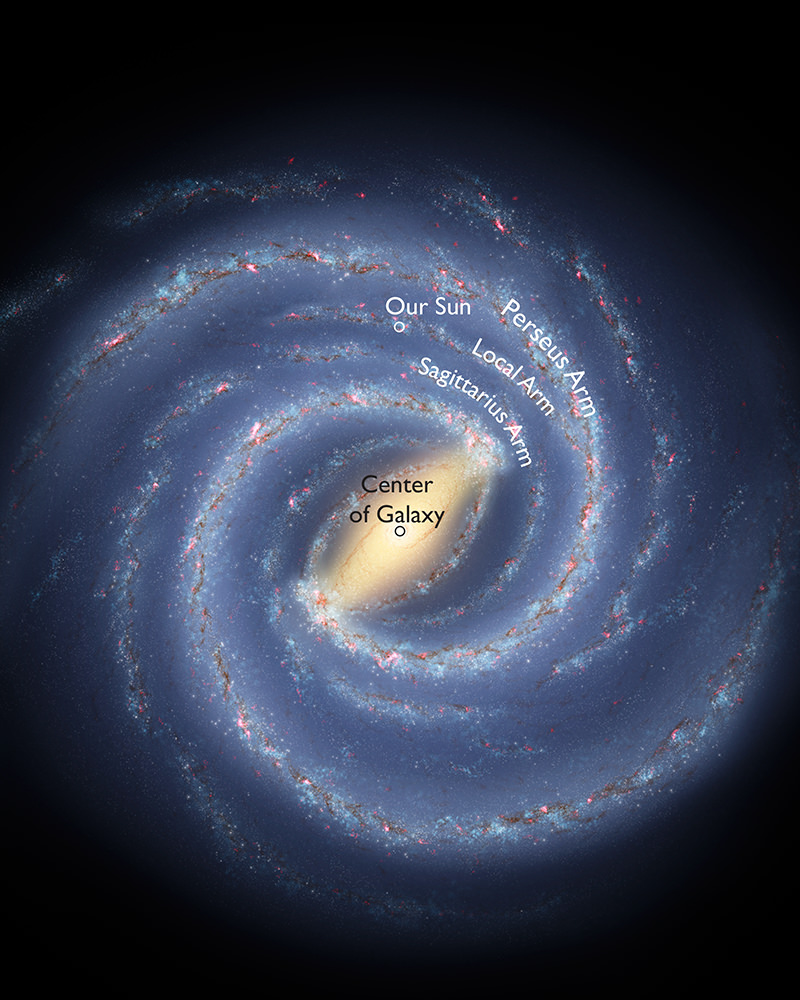
The sun's newly classified neighborhood -- the Local Arm, as shown in this picture -- is more prominent than previously supposed. Credit: Robert Hurt, IPAC; Bill Saxton, NRAO/AUI/NSF
Some cultures used to say the Earth was the center of the Universe. But in a series of “great demotions,” as astronomer Carl Sagan put it in his book Pale Blue Dot, we found out that we are quite far from the center of anything. The Sun holds the prominent center position in the center of the Solar System, but our star is just average-sized, located in a pedestrian starry suburb — a smaller galactic arm, far from the center of the Milky Way Galaxy.
But perhaps our suburb isn’t as quiet or lowly as we thought. A new model examining the Milky Way’s structure says our “Local Arm” of stars is more prominent than we believed.
“We’ve found there is not a lot of difference between our Local Arm and the other prominent arms of the Milky Way, which is in contrast what astronomers thought before,” said researcher Alberto Sanna, of the Max-Planck Institute for Radio Astronomy, speaking today at the American Astronomical Society’s annual meeting in Indianapolis, Indiana.
Sanna said that one of the main questions in astronomy is how the Milky Way would appear to an observer outside our galaxy.
If you imagine the Milky Way as a rippled cookie, our star is in a neighborhood in between two big ripples (the Sagittarius Arm and the Perseus Arm). Before, we thought the Local Arm (or Orion Arm) was just a small spur between the arms. New research using trigonometric parallax measurements, however, suggests the Local Arm could be a “significant branch” of one of those two arms.
In a few words, our stellar neighborhood is a bigger and brighter one than we thought it was.
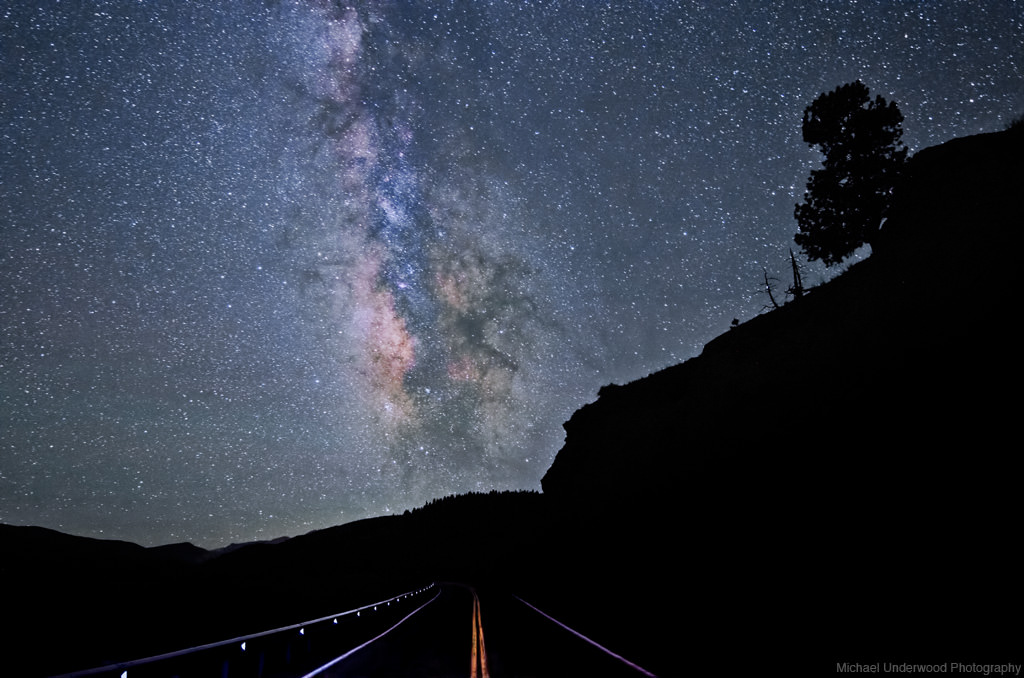
Colorado Milky Way. Credit: Michael Underwood
As part of the BeSSeL Survey (Bar and Spiral Structure Legacy Survey) using the Very Long Baseline Array (VLBA), astronomers are able to make more precise measurements of cosmic distances. The VLBA uses a network of 10 telescopes that work together to figure out how far away stars and other objects are.
It’s hard to figure out the distance from the Earth to other stars. Generally, astronomers use a technique called parallax, which measures how much a star moves when we look at it from the Earth.
VLBA telescope locations, courtesy of NRAO/AUI
When our planet is at opposite sites of its orbit — in spring and fall, for example — the apparent location of stellar objects changes slightly.
The more precisely we can measure this change, the better a sense we have of a star’s distance.
The VLBA undertook a search for spots in our galaxy where water and methanol molecules (also known as masers) enhance radio waves — similar to how lasers strengthen light waves. Masers are like stellar lighthouses for radio telescopes, the National Radio Astronomy Observatory stated.
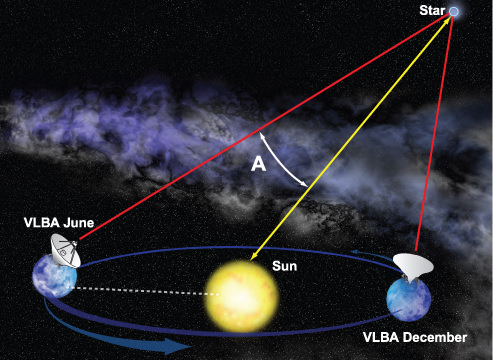
Trigonometric Parallax method determines distance to star or other object by measuring its slight shift in apparent position as seen from opposite ends of Earth’s orbit. CREDIT: Bill Saxton, NRAO/AUI/NSF
Between 2008 and 2012, the VLBA tracked the distances to (and movements of) several masers to higher precision than previously, leading to the new findings.
Will the findings help ease our “inferiority complex” after all those great demotions?
“I would say yes, that’s a nice conclusion to say we are more important,” Sanna told Universe Today. “But more importantly, we are now mapping the Milky Way and discovering how the Milky Might appear to an outside observer. We now know the Local Arm arm is something that an observer from afar would definitely notice!”