Safely back on Earth on Sept. 10, astronaut Chris Cassidy happily chatters about his daily trips to the gym — “I feel real solid with my walking”, he says — and cracks one-liners during one of a series of media interviews on Thursday.
“It was such a treat being up there with [Chris] Hadfield, and I think I need to get credit for filming some of those videos,” joked Cassidy in a phone interview from Houston with Universe Today. His favorite video with Canada’s Expedition 35 commander? A remake of David Bowie’s Space Oddity that got props from Bowie himself.
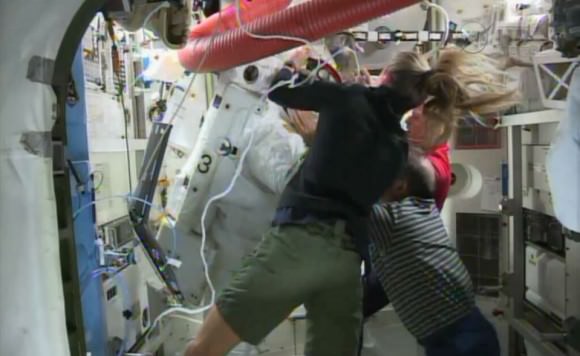
Cassidy’s half-year voyage in space was full of these light moments, such as his decision to shave his head in homage to his bald crewmate, Luca Parmitano, who arrived on the International Space Station as a part of Expedition 36 on May 29. Weeks later, however, the men’s mood turned serious during a July 16 spacewalk; Parmitano reported water pooling at the back of his head.
“I was watching out when we were face to face outside,” Cassidy said. “Once it got onto his eyebrow hair area, it whipped across the top of his forehead and then sort of slid around his eyeballs. It migrates from hair to hair, and the little wispy hairs around your eyes, kind of, and then it travelled towards his eyelids and eyelashes. That was the scary part.”
Cassidy is a former Navy SEAL who passed, first try, the grueling “hell week” all recruits go through. In 5.5 days, SEAL trainees get just four hours of rack time while having to move for up to 200 miles. A veteran of shuttle mission STS-127, Cassidy also accumulated more than 18 hours of spacewalking experience across three excursions. All of his knowledge was brought to bear as he watched the water travelling across Parmitano’s head.

“From my experience in the military, I know bad things don’t get better fast, but they get worse fast. I wanted to get as quickly to the airlock as we could,” Cassidy said. NASA prudently ended the spacewalk and told Parmitano to head back to the hatch. Cassidy quickly did a cleanup at the work site and followed Parmitano.
“When we left each other at the work site and we had to go our separate ways back, at first I wasn’t too concerned,” Cassidy said. “And then when we left each other, the sun set. It was dark. His comm was going in and out and I could tell from his voice he was getting less and less comfortable … He didn’t have a whole lot of EVA experience, and it was nighttime, which is significant. It was pitch dark. You just have to know your way back, and he couldn’t see that well.”
Back in the hatch, Cassidy and Parmitano communicated through hand squeezes as the water was soaking Parmitano’s communications system. Cassidy carefully watched Parmitano’s mouth to see if the water was getting near there.
“I didn’t think he would drown, to be honest … but if it got close to his mouth I was going to immediately open the valve that equalizes pressure [inside the hatch.]” Cassidy added that usually, NASA goes slow during repressurization for ear safety and some technical reasons, but in this case he was prepared to flood the compartment if necessary. But it wasn’t. The rest of the crew then opened the hatch and got Parmitano out of his spacesuit as quickly as they could.
“Just from a human interest point of view, it was a lot of water,” Cassidy said. “When you try to describe an amount of water it’s difficult to put it in terms that people get it. But it was definitely more than a softball or two softballs of water inside the helmet.”
You can read Parmitano’s blogged account of the spacewalk here. The astronaut is currently unavailable for interviews while he is in orbit, the European Space Agency told Universe Today. NASA is still investigating the cause — the agency, in fact, also has a parallel investigation to look at spacewalk safety procedures in general. Cassidy attempted to change a filter and do other repairs in orbit, but the leak still happened, as these videos show. More detailed analysis will happen when the spacesuit goes back to Earth on a future SpaceX Dragon cargo flight, Cassidy said.
Cassidy also performed an emergency spacewalk in May when a coolant leak was discovered on the station itself as Hadfield’s Expedition 35 crew was set to return home. In just days — a typical spacewalk takes at least months to plan — NASA swiftly implemented a successful fix. Cassidy said his work was the easiest bit of all. “All I had to do was go out there and change the pump,” he said.
Despite the mishaps, however, science productivity on the station has reached a high when compared to maintenance activities. Expedition 35 reportedly had the most productive science mission to date, and Cassidy said Expedition 36 will likely show similar results. “We had a real nice successful six month stretch there where things were just working, and that allowed us to do a lot of science,” Cassidy said. One experiment involved playing with rovers.
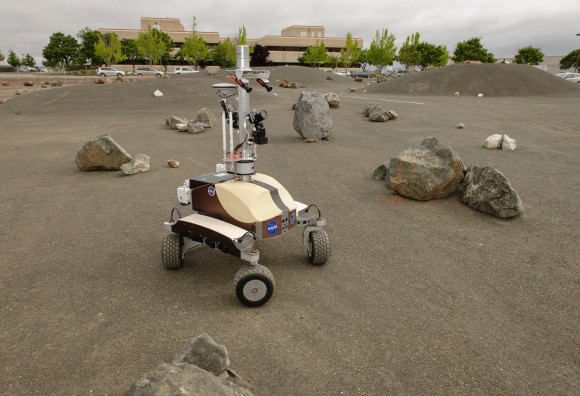
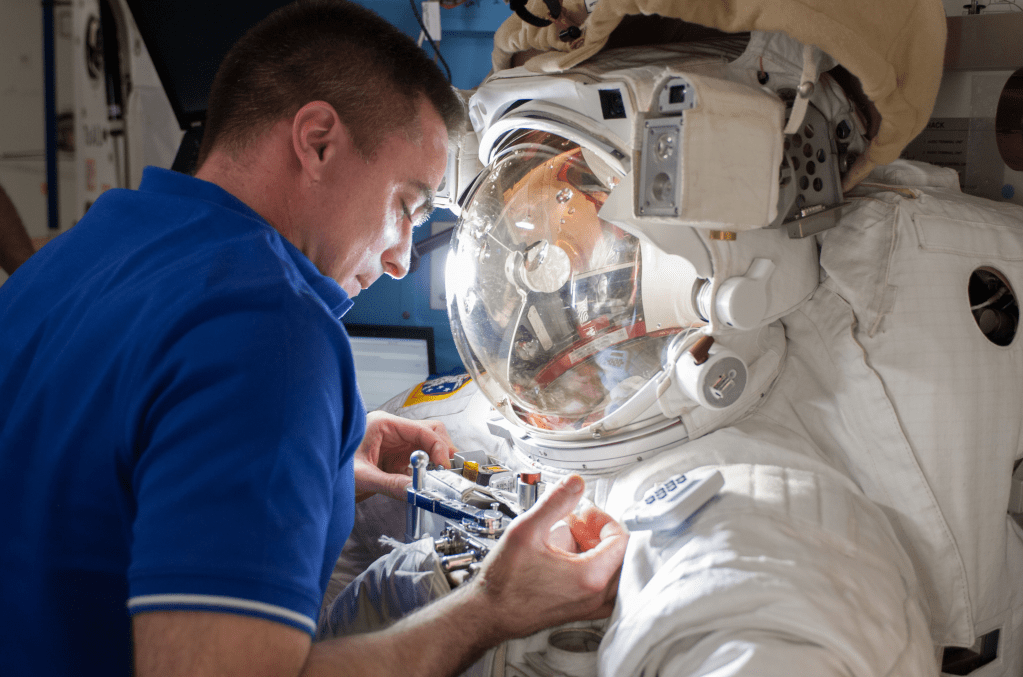
Credit: NASA/Dominic Hart
Cassidy, Parmitano and Karen Nyberg each took turns operating the K10 rover prototype, a NASA Ames Research Center project. The goal is to simulate how astronauts could control a rover on an asteroid, the moon or Mars rather than heading down to the surface themselves.
“That was really cool to know we were on the space station, flying around the planet, with this actual real thing in California moving around,” Cassidy said. “It was more testing of what user interfaces are most intuitive and most useful for this kind of application … and in my opinion they pretty much nailed it, it was so intuitive.”
Now back on Earth, Cassidy said he generally feels great from a health perspective. His first set of exercises came about an hour after landing. He was carried into a medical tent and asked to do a quick series: sit in a chair and then stand up for 10 seconds. Lie on the ground for about a minute, then try standing for three minutes.
“My legs got wobbly for fatigue. They weren’t used to holding that weight,” Cassidy said, but observed that he readjusted to Earth’s gravity quickly during his first day back, which was mainly spent flying from Kazakhstan back to Houston.
The new in-the-field experiments will be the first of a dataset on astronaut health, meant to provide more information ahead of the first one-year trip to the International Space Station.