Is time real or is it just an illusion of the human experience? An intriguing new book “Time Reborn” by theoretical physicist Lee Smolin discusses this concept. You can read our full review of this here, but we also have three free copies of this book to give away.
In order to be entered into the giveaway drawing, just put your email address into the box at the bottom of this post (where it says “Enter the Giveaway”) before Wednesday June 5, 2013. We’ll send you a confirmation email, so you’ll need to click that to be entered into the drawing.
If you’d like to purchase the book, you can find it on Amazon.
Time Reborn: From the Crisis of Physics to the Future of the Universe is one of those books intended to provoke discussion. Right from the first pages, author Lee Smolin — a Canadian theoretical physicist who also teaches philosophy — puts forward a position: time is real, and not an illusion of the human experience (as other physicists try to argue).
Smolin, in fact, uses that concept of time as a basis for human free will. If time is real, he writes, this is the result: “Novelty is real. We can create, with our imagination, outcomes not computable from knowledge of the present.”
Physics as philosophy. A powerful statement to make in the opening parts of the book. The only challenge is understanding the rest of it.
Smolin advertises his book as open to the general reader who has no background in physics or mathematics, promising that there aren’t even equations to worry about. He also breaks up the involved explanations with wry observations of fatherhood, or by bringing up anecdotes from his past.
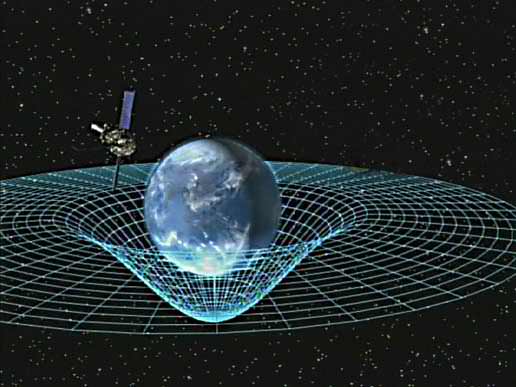
Artist concept of Gravity Probe B orbiting the Earth to measure space-time, a four-dimensional description of the universe including height, width, length, and time. Image credit: NASA
It works, but you need to be patient. Theoretical physics is so far outside of the everyday that at times it took me (with education focusing on journalism and space policy, admittedly) two or three readings of the same passage to understand what was going on.
But as I took my time, a whole world opened up to me.
I found myself understanding more about Einstein’s special and general relativity than I did in readings during high school and university. The book also made me think differently about cosmology (the nature of the universe), especially in relation to biological laws.
While the book is enjoyable, it is probably best not to read it in isolation as it is a positional one — a book that gathers information scientifically and analytically, to be sure, but one that does not have a neutral point of view to the conclusions.
We’d recommend picking up other books such as the classic A Brief History of Time (by physicist Stephen Hawking) to learn more about the universe, and how other scientists see time work.
Since Asteroid 1998 QE2 has a name which evokes cruise ships, astrophysicist Rhys Taylor has created this wonderful video comparing the two QE2s. He also has more information on his great blog, Physicists of the Caribbean.
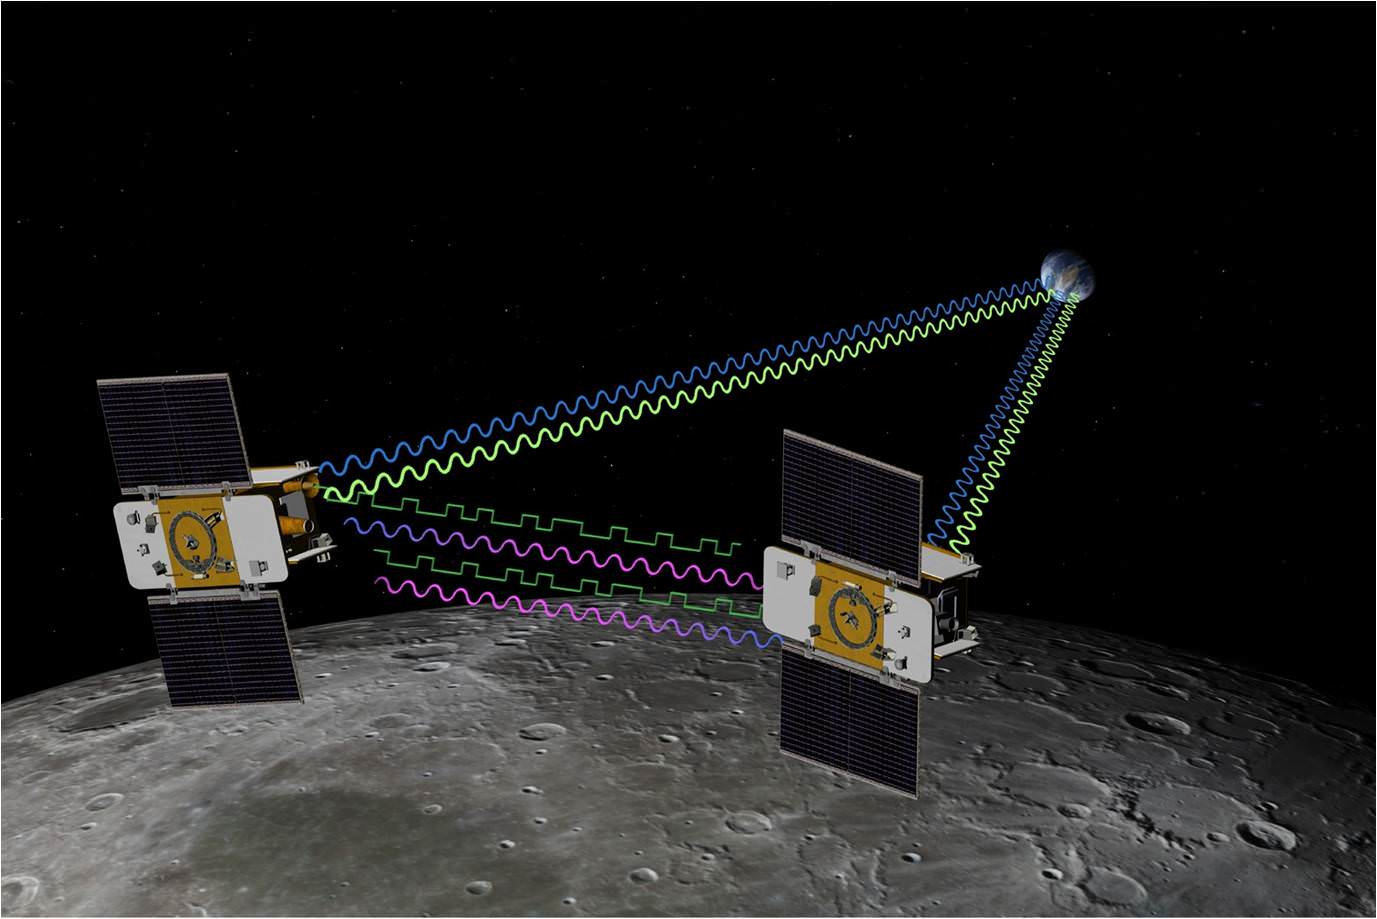
GRAIL mission in Lunar Orbit. Artist concept of twin GRAIL spacecraft flying in tandem orbits around the moon to measure its gravity field in unprecedented detail. Credit: NASA/JPL
The moon’s gravity has been a headache ever since the Apollo era. Areas of “mass concentration” or mascons, discovered in 1968, affected spacecraft orbits and made landing on Earth’s neighbor a tricky challenge.
The phenomenon has puzzled scientists, but new data shows that mascons might have come to be after asteroids or comets hit the moon a long time ago.
For nine months last year, until their mission ended with a deliberate crash on a moon mountain, twin washing-machine sized spacecraft Ebb and Flow circled the planet. Their work was known as the GRAIL mission (also known as Gravity Recovery and Interior Laboratory.) As they orbited together, gravity changes in the moon below them slightly changed their distances to each other — sometimes closer, sometimes further.
This allowed scientists to map out the mascons to high precision once they combined that information with computer models of big asteroid impacts as well as how craters on the moon evolved.
Craters on the Moon. Image credit: NASA
Mascons, which are invisible on the surface but appear in gravity maps as a sort of bulls-eye, arise “as a natural consequence of crater excavation, collapse and cooling following an impact,” NASA stated.
The center of the bulls-eye has stronger gravity, with a ring of weaker gravity surrounding the bulls-eye, and then another ring of strong gravity surrounding the bulls-eye and inner ring.
“GRAIL data confirm that lunar mascons were generated when large asteroids or comets impacted the ancient moon, when its interior was much hotter than it is now,” stated Jay Melosh, lead researcher and a GRAIL co-investigator at Purdue University.
“We believe the data from GRAIL show how the moon’s light crust and dense mantle combined with the shock of a large impact to create the distinctive pattern of density anomalies that we recognize as mascons.”
What’s more, researchers expect they’ll be able to apply that understanding to Mercury and Mars, as mascons were also discovered on those terrestrial planets.
The findings appeared in the May 30 edition of Science. You can read the entire article here.
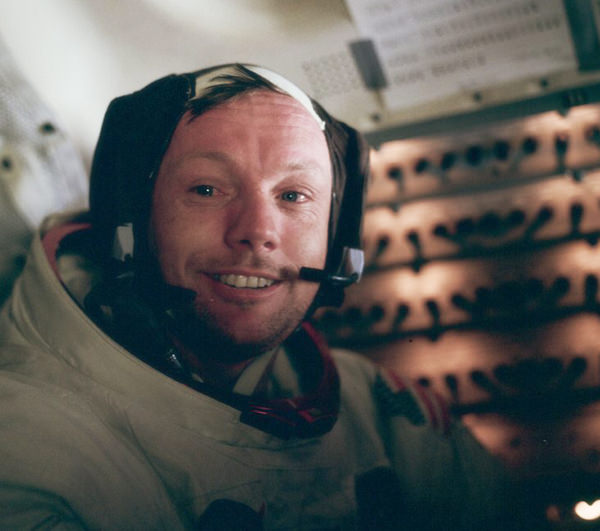
Neil Armstrong in the LM after his historic moonwalk (NASA)
“That’s one small step for man… one giant leap for mankind.” And with those famous words astronaut Neil A. Armstrong awed the entire world on July 21, 1969, becoming the first human to set a booted foot upon a world other than our own. But the historic statement itself has caused no small bit of confusion and controversy over the years, from whether Armstrong came up with it on the spot (he didn’t) to what he actually said… small step for “man?” Where’s the “a?”
Although some have said that the article was left out or cut off (and admittedly it sure sounds that way to me) it turns out it’s probably been there the whole time, hidden behind Neil’s native Ohio accent.
According to a team of speech scientists and psychologists from Michigan State University (MSU) in East Lansing and The Ohio State University (OSU) in Columbus, it is entirely possible that Armstrong said what he had always claimed — though evidence indicates that most people are likely to hear “for man” instead of “for a man” on the Apollo 11 broadcast recordings.
By studying how speakers from Armstrong’s native central Ohio pronounce “for” and “for a,” the team’s results suggest that his “a” was acoustically blended into his “for.”
“Prior acoustic analyses of Neil Armstrong’s recording have established well that if the word ‘a’ was spoken, it was very short and was fully blended acoustically with the preceding word,” says Laura Dilley of Michigan State University. “If Armstrong actually did say ‘a,'” she continues, “it sounded something like ‘frrr(uh).'”
His blending of the two words, compounded with the poor sound quality of the television transmission, has made it difficult to corroborate his claim that the “a” is there.
“If Armstrong actually did say ‘a,’ it sounded something like ‘frrr(uh).'”
– Laura Dilley, Michigan State University
Dilley and her colleagues used a collection of recordings of conversational speech from 40 people raised in Columbus, Ohio, near Armstrong’s native town of Wapakoneta. Within this body of recordings, they found 191 cases of “for a.” They matched each of these to an instance of “for” as said by the same speaker and compared the relative duration. They also examined the duration of Armstrong’s “for (a”) from the lunar transmission.
The researchers found a large overlap between the relative duration of the “r” sound in “for” and “for a” using the Ohio speech data. The duration of the “frrr(uh)” in Armstrong’s recording was 0.127 seconds, which falls into the middle of this overlap. In other words, the researchers conclude, the lunar landing quote is highly compatible with either possible interpretation though it is probably slightly more likely to be perceived as “for” regardless of what Armstrong actually said.
Dilley says there may have been a “perfect storm of conditions” for the word “a” to have been spoken… but not heard.
“We’ve bolstered Neil Armstrong’s side of the story,” she says. “We feel we’ve partially vindicated him. But we’ll most likely never know for sure exactly what he said based on the acoustic information.”
(Personally, I feel that if the first man to walk on the Moon said he said “a,” then he said “a.”)
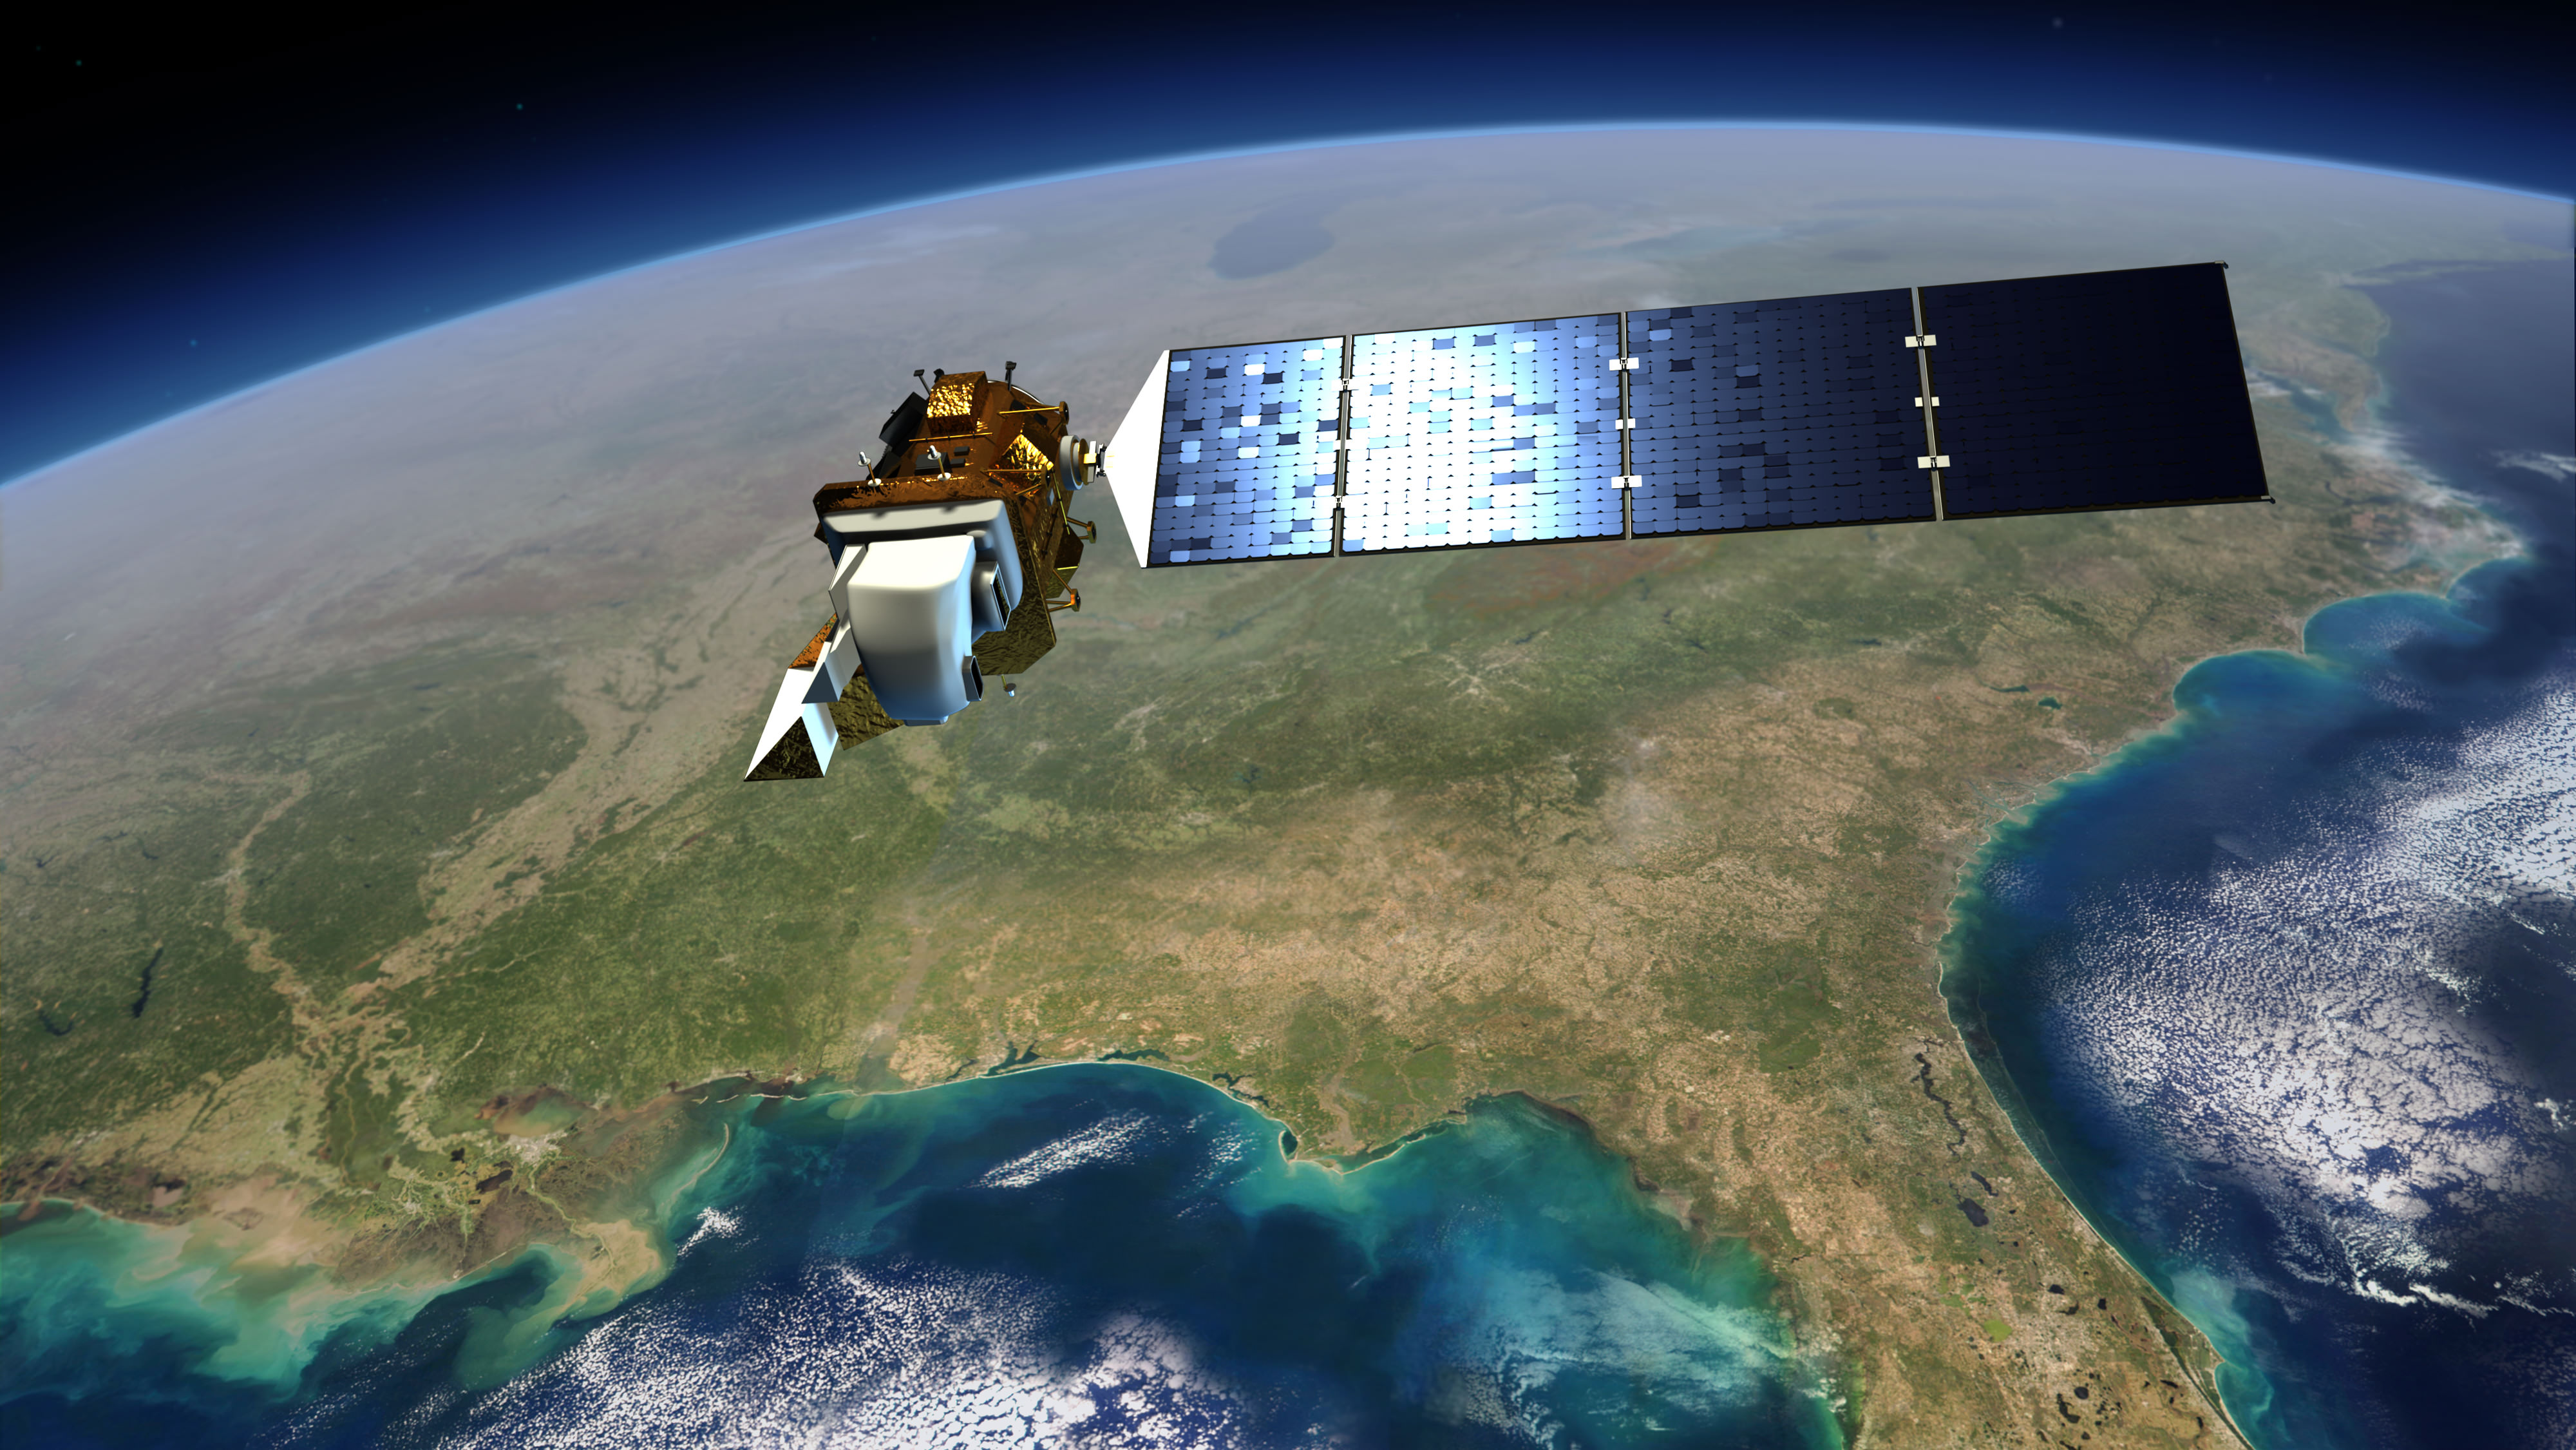
Artist's conception of Landsat 8 (renamed from Landsat Data Continuity Mission). Credit: NASA/ Goddard/Conceptual Image Lab
Landsat 8 officially opened its eyes to Earth yesterday (May 30). Officials are promising the clearest views yet of the four-decade-old Landsat program, and luckily for people who love amazing Earth views, the images Landsat produces are free.
Before talking a bit about Landsat 8, here’s one way you can find the images: go to this website of raw Landsat data from the United States Geological Survey. In the menu tab “Collection”, go down to “Landsat Archive” and select “Landsat 8 OLI.” Then click a location on the map to see if it’s taken a picture of a spot you’re interested in.
Once you’ve selected it, hit “Add Scene”, then click on the scene list at the bottom right of the screen to download the product. (We’d strongly advise consulting the tutorial on that website for more help. You need to register as a user to download the high-resolution images.)
There isn’t much to see there yet, but over the next few months there should be a wealth of pictures to choose from. More spots where Landsat 8 data will appear are listed on this USGS page.
You may better recall Landsat 8 as the Landsat Data Continuity Mission. Launched on Feb. 11, it was first under the operational control of NASA as the agency put the satellite through its paces — placing it into the proper orbit (it circles in a near-polar orbit) and taking some test images of the planet, for example.
Now that the satellite is ready, the USGS has operational control and will add that to more than 40 years of data collected under the Landsat program. The aim, we assure you, is not just for pretty pictures.
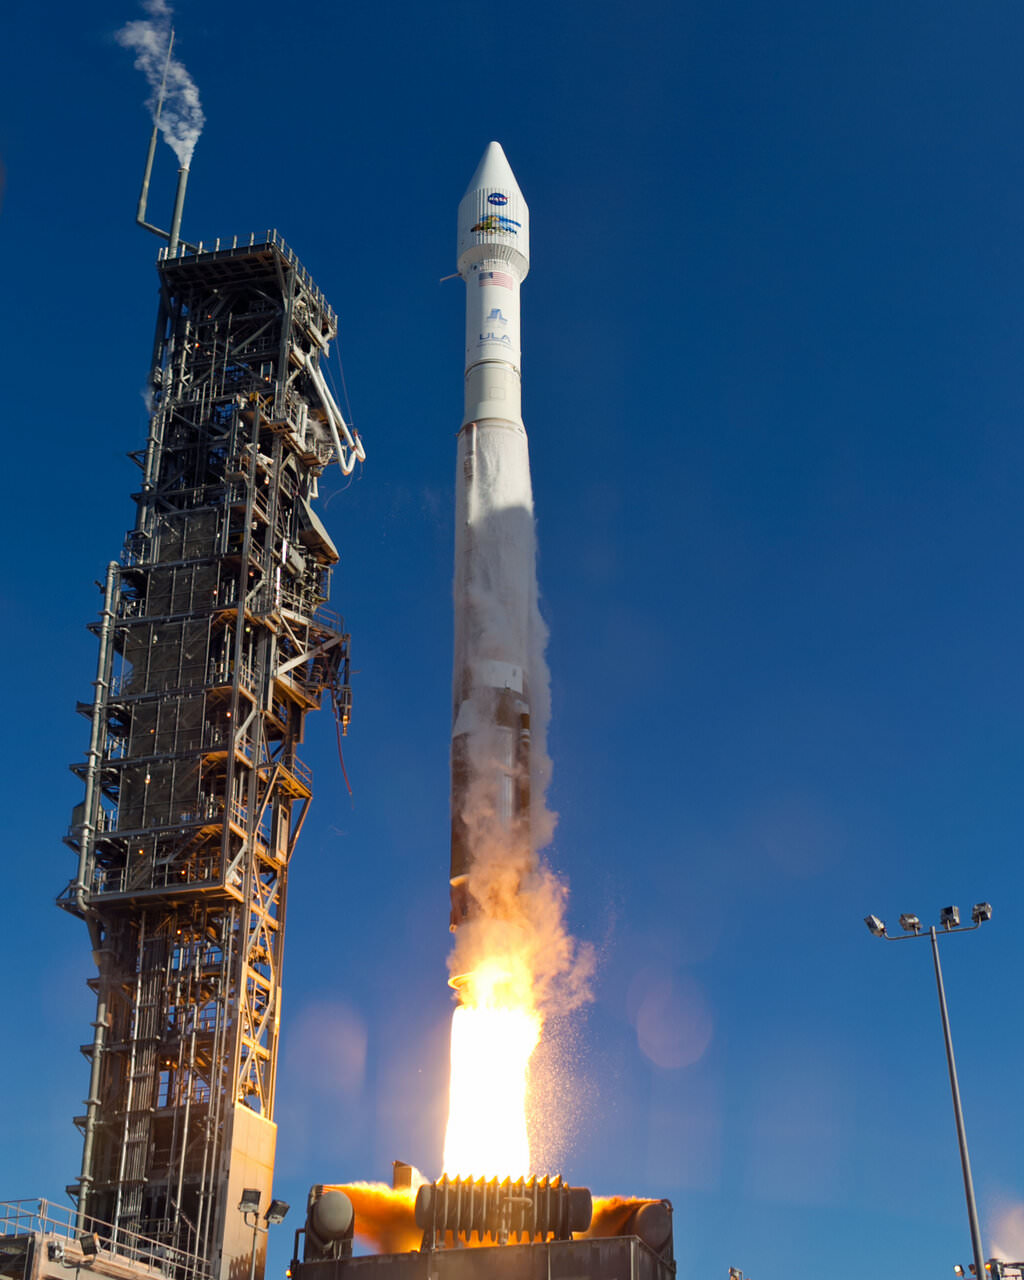
An Atlas-V rocket with the Landsat Data Continuity Mission (LDCM) spacecraft onboard is seen as it launches on Monday, Feb. 11, 2013 at Vandenberg Air Force Base, California. Credit: NASA
Long Earth observation programs show changes in the land over time. We can see cities grow, observe forests shrink or deserts expand in response to human activity or climate change, and also gauge the impact of natural disasters. In the past, Landsat pictures have been used to map the impact of the Mount St. Helen’s eruption of 1980, and to respond to oil gas fires set in Kuwait during the Gulf War of 1991.
These are heavyweight satellites. The truck-sized Landsat 8 weighs 4,566 lbs (2,071 kg) fully loaded with fuel, excluding the weight of the instruments. Its operational land imager can take pictures in nine spectral bands, which is important because certain types of vegetation or land features show up better in different light spectra. (One application is to monitor the health of certain kind of plants in farmer fields, for example.) It also has two thermal infrared sensor bands that will show the heat signature of Earthly features.
For Landsat, officials needed to launch this satellite because its predecessor (Landsat 7)’s operational lifetime is in overtime. Should the satellite have failed before Landsat 8 arrived, 41 years of continuous Earth observations under the same program would have ceased.
Landsat 8 will circle the globe 14 times daily, will repeat its ground track every 16 days, and is expected to do this for at least five years. Check out this USGS feature story for more on how it will contribute to Earth observation.
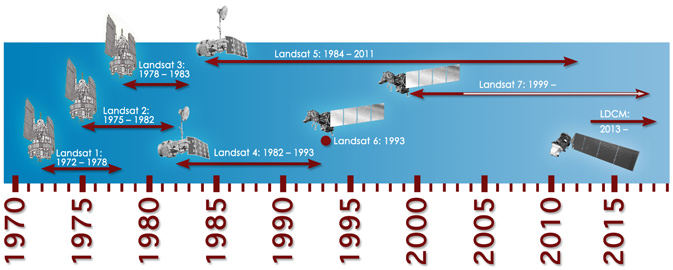
Timeline showing lifespans of the Landsat satellites. Credit: NASA
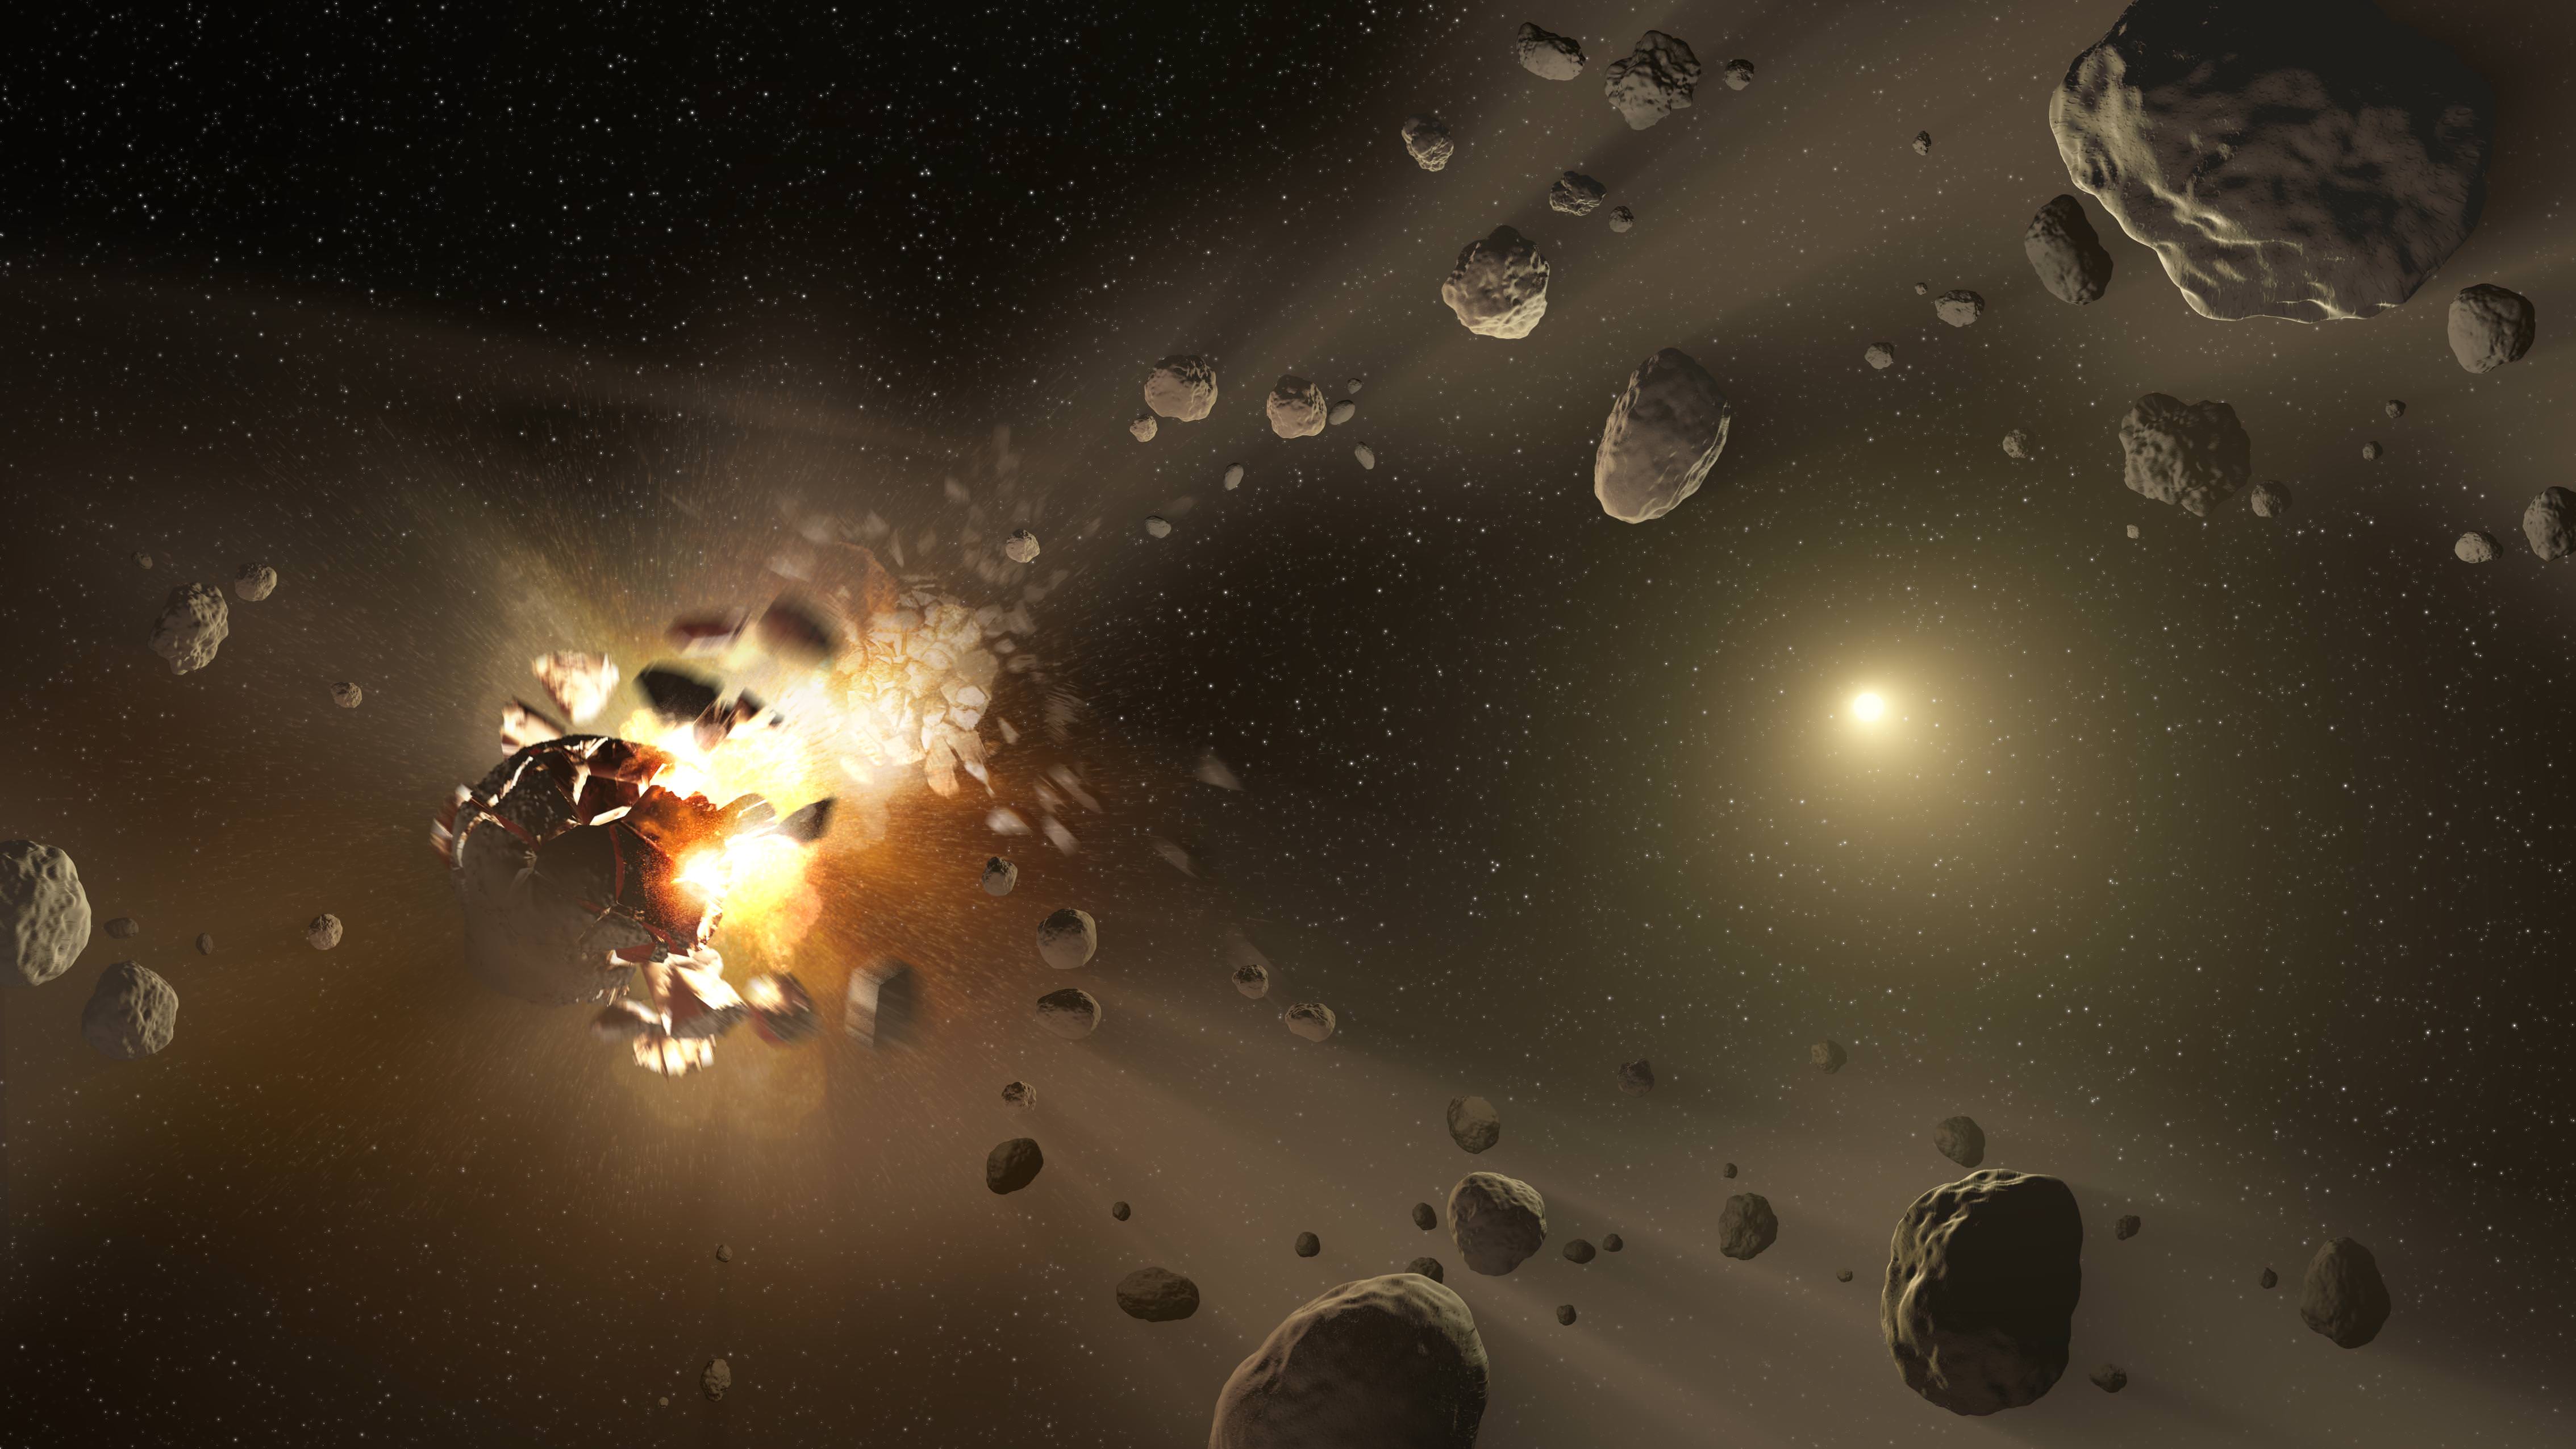
An artist's conception of an asteroid collision, in the belt between Mars and Jupiter. Credit: NASA/JPL-Caltech
In perhaps the neatest astronomical application of geneology yet, astronomers found 28 “hidden” families of asteroids that could eventually show them how some rocks get into orbits that skirt the Earth’s path in space.
From scanning millions of snapshots of asteroid heat signatures in the infrared, these groups popped out in an all-sky survey of asteroids undertaken by NASA’s orbiting Wide-Field Infrared Survey Explorer. This survey took place in the belt of asteroids between Mars and Jupiter, where most near-Earth objects (NEOs) come from.
NEOs, to back up for a second, are asteroids and comets that approach Earth’s orbit from within 28 million miles (45 million kilometers). Sometimes, a gravitational push can send a previously unthreatening rock closer to the planet’s direction. The dinosaurs’ extinction roughly 65 million years ago, for example, is widely attributed to a massive rock collision on Earth.
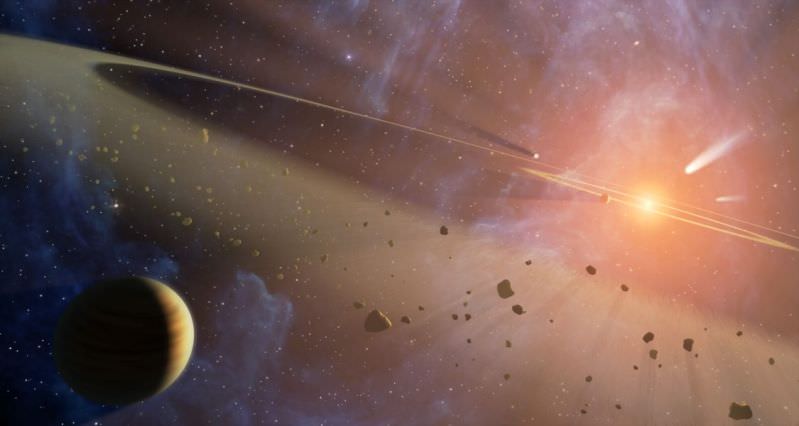
Artist concept of the asteroid belt between Mars and Jupiter. Credit: NASA
There are about 600,000 known asteroids between Mars and Jupiter, and the survey looked at about 120,000 of them. Astronomers then attempted to group some of them into “families”, which are best determined by the mineral composition of an asteroid and how much light it reflects.
While it’s hard to measure reflectivity in visible light — a big, dark asteroid reflects a similar amount of light as a small shiny one — infrared observations are harder to fool. Bigger objects give off more heat.
This allowed astronomers to reclassify some previously studied asteroids (which were previously grouped by their orbits), and come up with 28 new families.
“This will help us trace the NEOs back to their sources and understand how some of them have migrated to orbits hazardous to the Earth,” stated Lindley Johnson, NASA’s program executive for the Near-Earth Object Observation Program.
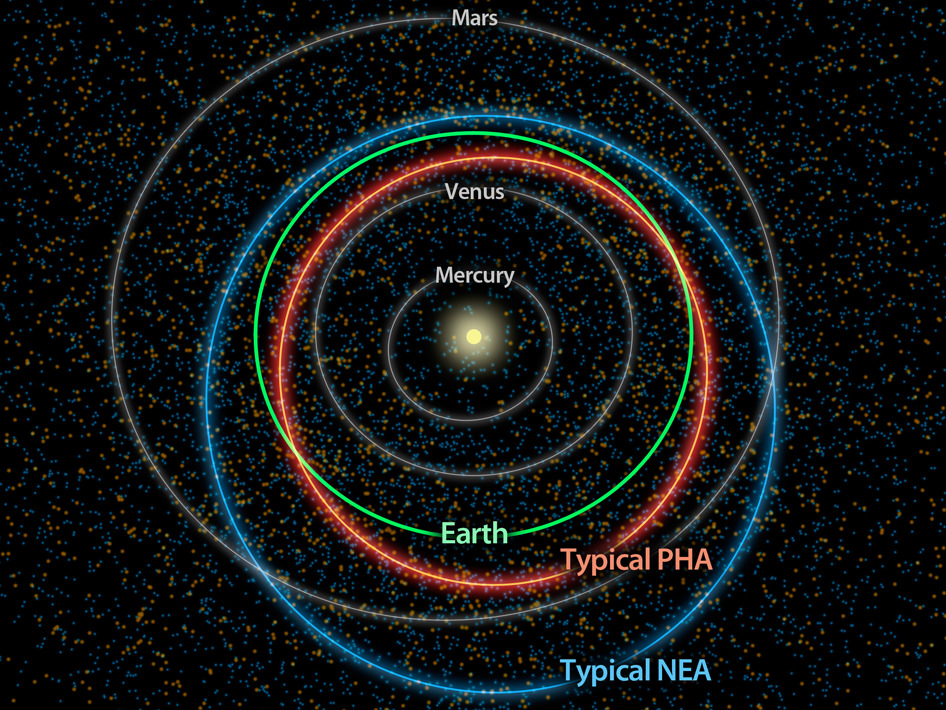
This diagram illustrates the differences between orbits of a typical near-Earth asteroid (blue) and a potentially hazardous asteroid, or PHA (orange). Image credit: NASA/JPL-Caltech
The astronomers next hope to study these different families to figure out their parent bodies. Astronomers believe that many asteroids we see today broke off from something much larger, most likely through a collision at some point in the past.
While Earthlings will be most interested in how NEOs came from these larger bodies and threaten the planet today, astronomers are also interested in learning how the asteroid belt formed and why the rocks did not coalesce into a planet.
The prevailing theory today says that was due to influences from giant Jupiter’s strong gravity, which to this day pulls many incoming comets and asteroids into different orbits if they swing too close. (Just look at what happened to Shoemaker-Levy 9 in 1994, for example.)
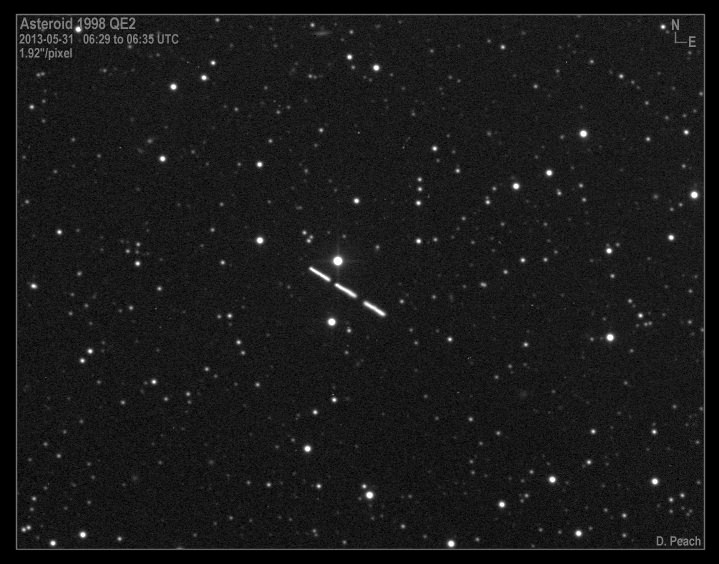
Asteroid 1998 QE2, taken on May 31, 2013 when it was 5.8 million km (3.6 million miles) from Earth and moving at around 21 arc mins per hour. The asteroid was quite bright at around magnitude 11. Credit and copyright: Damian Peach.
Will the flyby of Near Earth Asteroid 285263 (1998 QE2) reveal more surprises? NASA announced yesterday that radar images uncovered a previously unknown small moon orbiting the big asteroid. Now, observatories and amateurs around the world are taking a look at this big, dark space rock, which is about 2.7 kilometers (1.7 miles) in diameter. Here are some of the “early returns” just in!
This asteroid will pass 5.86 million km (3.64 million miles) from the Earth on Friday, May 31st at 20:59 Universal Time (UT) or 4:59PM EDT. That is about 15 times the distance between Earth and the Moon, so no worries. But it is not often an asteroid this big comes by within viewing range of observatories on Earth.
Asteroid (285263) 1998 QE2, on May 31, 2013, taken remotely from the H06 iTelescope Observatory in New Mexico. Credit and copyright: Ernesto Guido and Nick Howes, Remanzacco Observatory.
The Remanzacco Observatory team of Ernesto Guido and Nick Howes provided this image, above, and a great animation of the asteroid, as well:
Animation of (285263) 1998 QE2 on May 31, 2013 by E. Guido & N. Howes
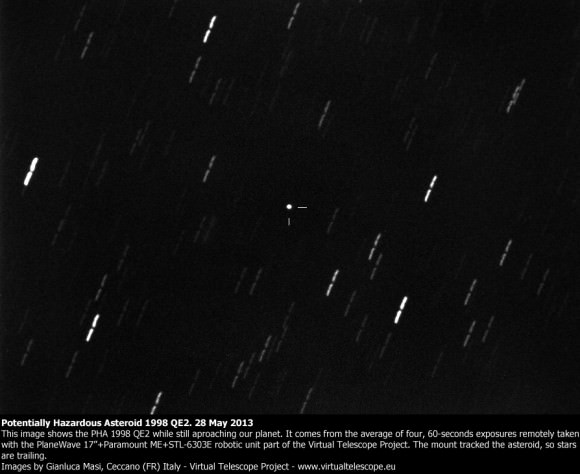
Asteroid 1998 QE2 on May 28, 2013. Credit and copyright: Gianluca Masi, Ceccano, Italy; Virtual Telescope Project.
Masi also provided a video from his May 30 observations:
Animation of Asteroid 1998 QE2, May 31, 2013 taken remotely with iTelescope T9. Credit and copyright: Ian Musgrave.
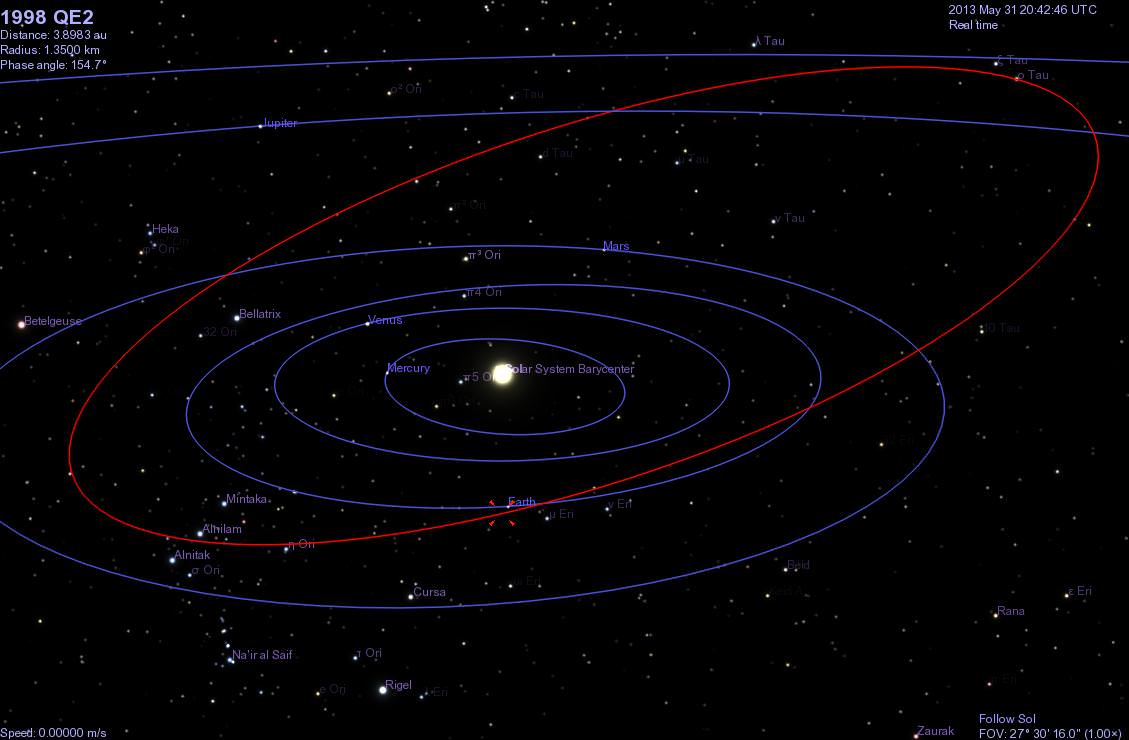
Here’s one from Ian Musgrave. If the animation isn’t working in your browser, click on the image to animate. Ian also has provided this graphic made from Celestia software to show Asteroid 1998 QE2’s orbit:
Orbit of 1998 QE2 simulated in Celestia at closest approach on May 31 20:59 UT. Via Ian Musgrave.
Want to try and see this asteroid for yourself? Our very own David Dickinson has written a great “how-to” for this object, but you are going to need a fairly large backyard telescope, since it will be about 100 times fainter than what can be seen with the naked eye, even at closest approach.
The Slooh online telescope will have views of online tomorrow, which you can watch at their website. The webcast will start at 20:30 UTC (4:30 p.m. EDT) on Friday, May 31.
Also, starting at 20:00 UTC (4:00 p.m. EDT), astrophysicist Gianluca Masi will have a webcast from the Virtual Telescope Project in Italy.
Also, if you want more asteroids, on Friday May 31, the White House is hosting an asteroid-themed “We the Geeks” Google+ Hangout starting at 2 p.m. EDT.
The live video conference will feature Bill Nye the Science Guy, JL Galache from the Minor Planet Center, former astronaut Ed Lu, NASA Deputy Administrator Lori Garver, and Peter Diamandis, co-founder of asteroid mining company Planetary Resources. They will discuss identification, resource potential and threat of asteroids. Here’s the link the White House’s Google+ page.
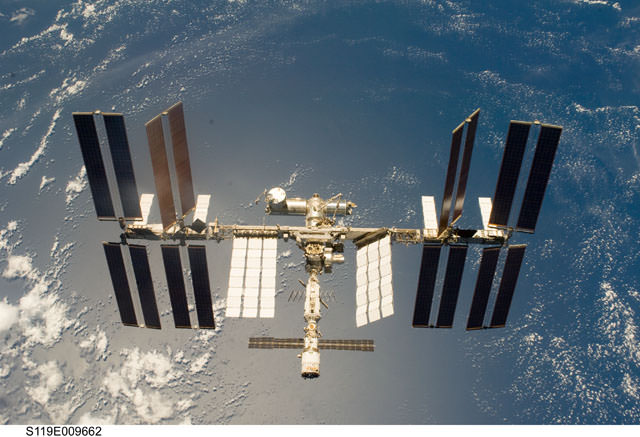
The International Space Station as seen from the crew of STS-119. (Credit: NASA).
Never seen the International Space Station before? Now is a good time to try, as we enter into a very special time of year.
Starting at 12:30 Universal Time/8:30 AM EDT on Monday, June 3rd, the ISS will enter a phase of permanent illumination throughout the length of its orbit. The station will remain in sunlight and will not experience an orbital sunset until five days later, when it briefly dips into the Earth’s shadow on June 8th at 11:50 UT/ 7:50 AM EDT.
This sets us up for a wealth of visible passes worldwide. This unique phenomenon occurs as a product of the station’s highly inclined orbit. Tilted at 51.6° with respect to the Earth’s equator, its orbit can be oriented roughly perpendicular to the Sun within a few weeks of either solstice.
But whereas the December solstice favors multiple summer sightings for the southern hemisphere, the season near the June solstice (which occurs this year on June 21st) favors northern latitudes. In fact, observers in the UK, southern Canada and the northern United States will be able to see multiple ISS passes in one night over the next week. Note that the ISS is nearly in full illumination now, and will remain so well into mid-June.
So, why was the ISS put into such a highly inclined orbit?
This orientation enables international partners to have access to the station from launch complexes worldwide. Whereas the shuttle launched on construction flights from Cape Canaveral at 28.5° north latitude, the Progress and crewed Soyuz missions depart from the Baikonur Cosmodrome in Kazakhstan located at 46° north. This resulted in some dramatic launches from the US Florida Space Coast, as the shuttle chased the ISS up the US Eastern Seaboard and was often visible minutes later crossing over the UK.
Though born of practicality, this happy circumstance also means that the ISS is visible to a wide swath of humanity located from 60° north latitude to 60° south. Only locales such as Antarctica, Greenland, and Iceland miss out.
I’m often asked how I know a moving star is a satellite and not an airplane. Aircraft flash, generating their own light, while satellites shine by reflected sunlight. This means that there’s a window of about an hour after sunset or before local sunrise that objects in low Earth orbit are still illuminated high overhead. In the early morning hours, if often seems as if someone has just “flipped on a switch” and satellites suddenly become visible across the sky.
And yes, satellites can flash as well, but in most instances, this is due to tumbling or the observer catching a glint of sunlight off of a reflective panel or surface just right. The Iridium constellation of satellites is known for this effect, but the ISS and Hubble Space Telescope can also flare in this fashion as well.
At 108.5 x 72.8 metres in size, the ISS is the largest man made object ever constructed in Earth orbit. Its unmistakable to spot as it passes overhead, shining at a maximum illumination brighter than the planet Venus at magnitude -5.2 when 100% illuminated.
Note the time the ISS is passing over your location and the direction its coming from and just start watching, no equipment required. It’s really as simple as that. Many prediction platforms exist for ISS passes. I’ve used Heavens-Above for over a decade now to spot ISS passes worldwide. Probably the simplest tracker out there is provided by Spaceweather. Just enter in your postal code and it kicks out an easy to decipher prediction. NASA also has a “Sighting Opportunities” webpage where you can choose your country and city to find out when the ISS will be passing over your location.
More advanced satellite trackers many want to check out CALSky which can also provide a list of transits of the ISS in front of the Sun or Moon from your location. I’ve managed to catch one each from my backyard utilizing it. I also like to use a free satellite tracking program known as Orbitron, which can be run on a laptop in the field away from an Internet connection.
Screenshot of the ISS orbital pass during full illumination next week. (Credit: Orbitron).
Photographing a pass of the ISS is easy. Just do a wide field exposure with a DSLR camera on a tripod for 10-30 seconds and you’ll get a picture of the ISS streaking across the starry background. Be sure to use manual mode and either set the focus to infinity or focus on something bright such as Venus just prior to the pass. I generally take a series of test exposures prior to get the combination of ISO/f-stop settings correct for the current sky conditions.
A 20 second exposure of the ISS during a July 4th fireworks show in 2011. (Photo by Author).
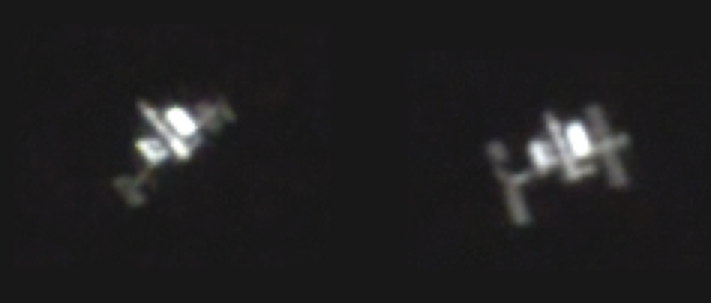
I can just make out structure on the ISS with binoculars as it passes overhead. This appearance can vary greatly depending on its orientation. Sometimes, it looks like a close binary star. Other times it can appear box-shaped. Occasionally, it looks like a tiny luminous Star Wars TIE-fighter!
The station managers typically orient the huge solar arrays to provide a small amount of artificial shadow during phases of full illumination. The ISS extends ~45” across at closest approach, similar in apparent diameter to Saturn including its ring system.
You can even image the ISS through a telescope, with a little skill and luck. Many sophisticated mounts will track the ISS as it crosses the sky, or you can use our own low-tech method;
Be sure to check out an ISS pass coming to a sky near you!
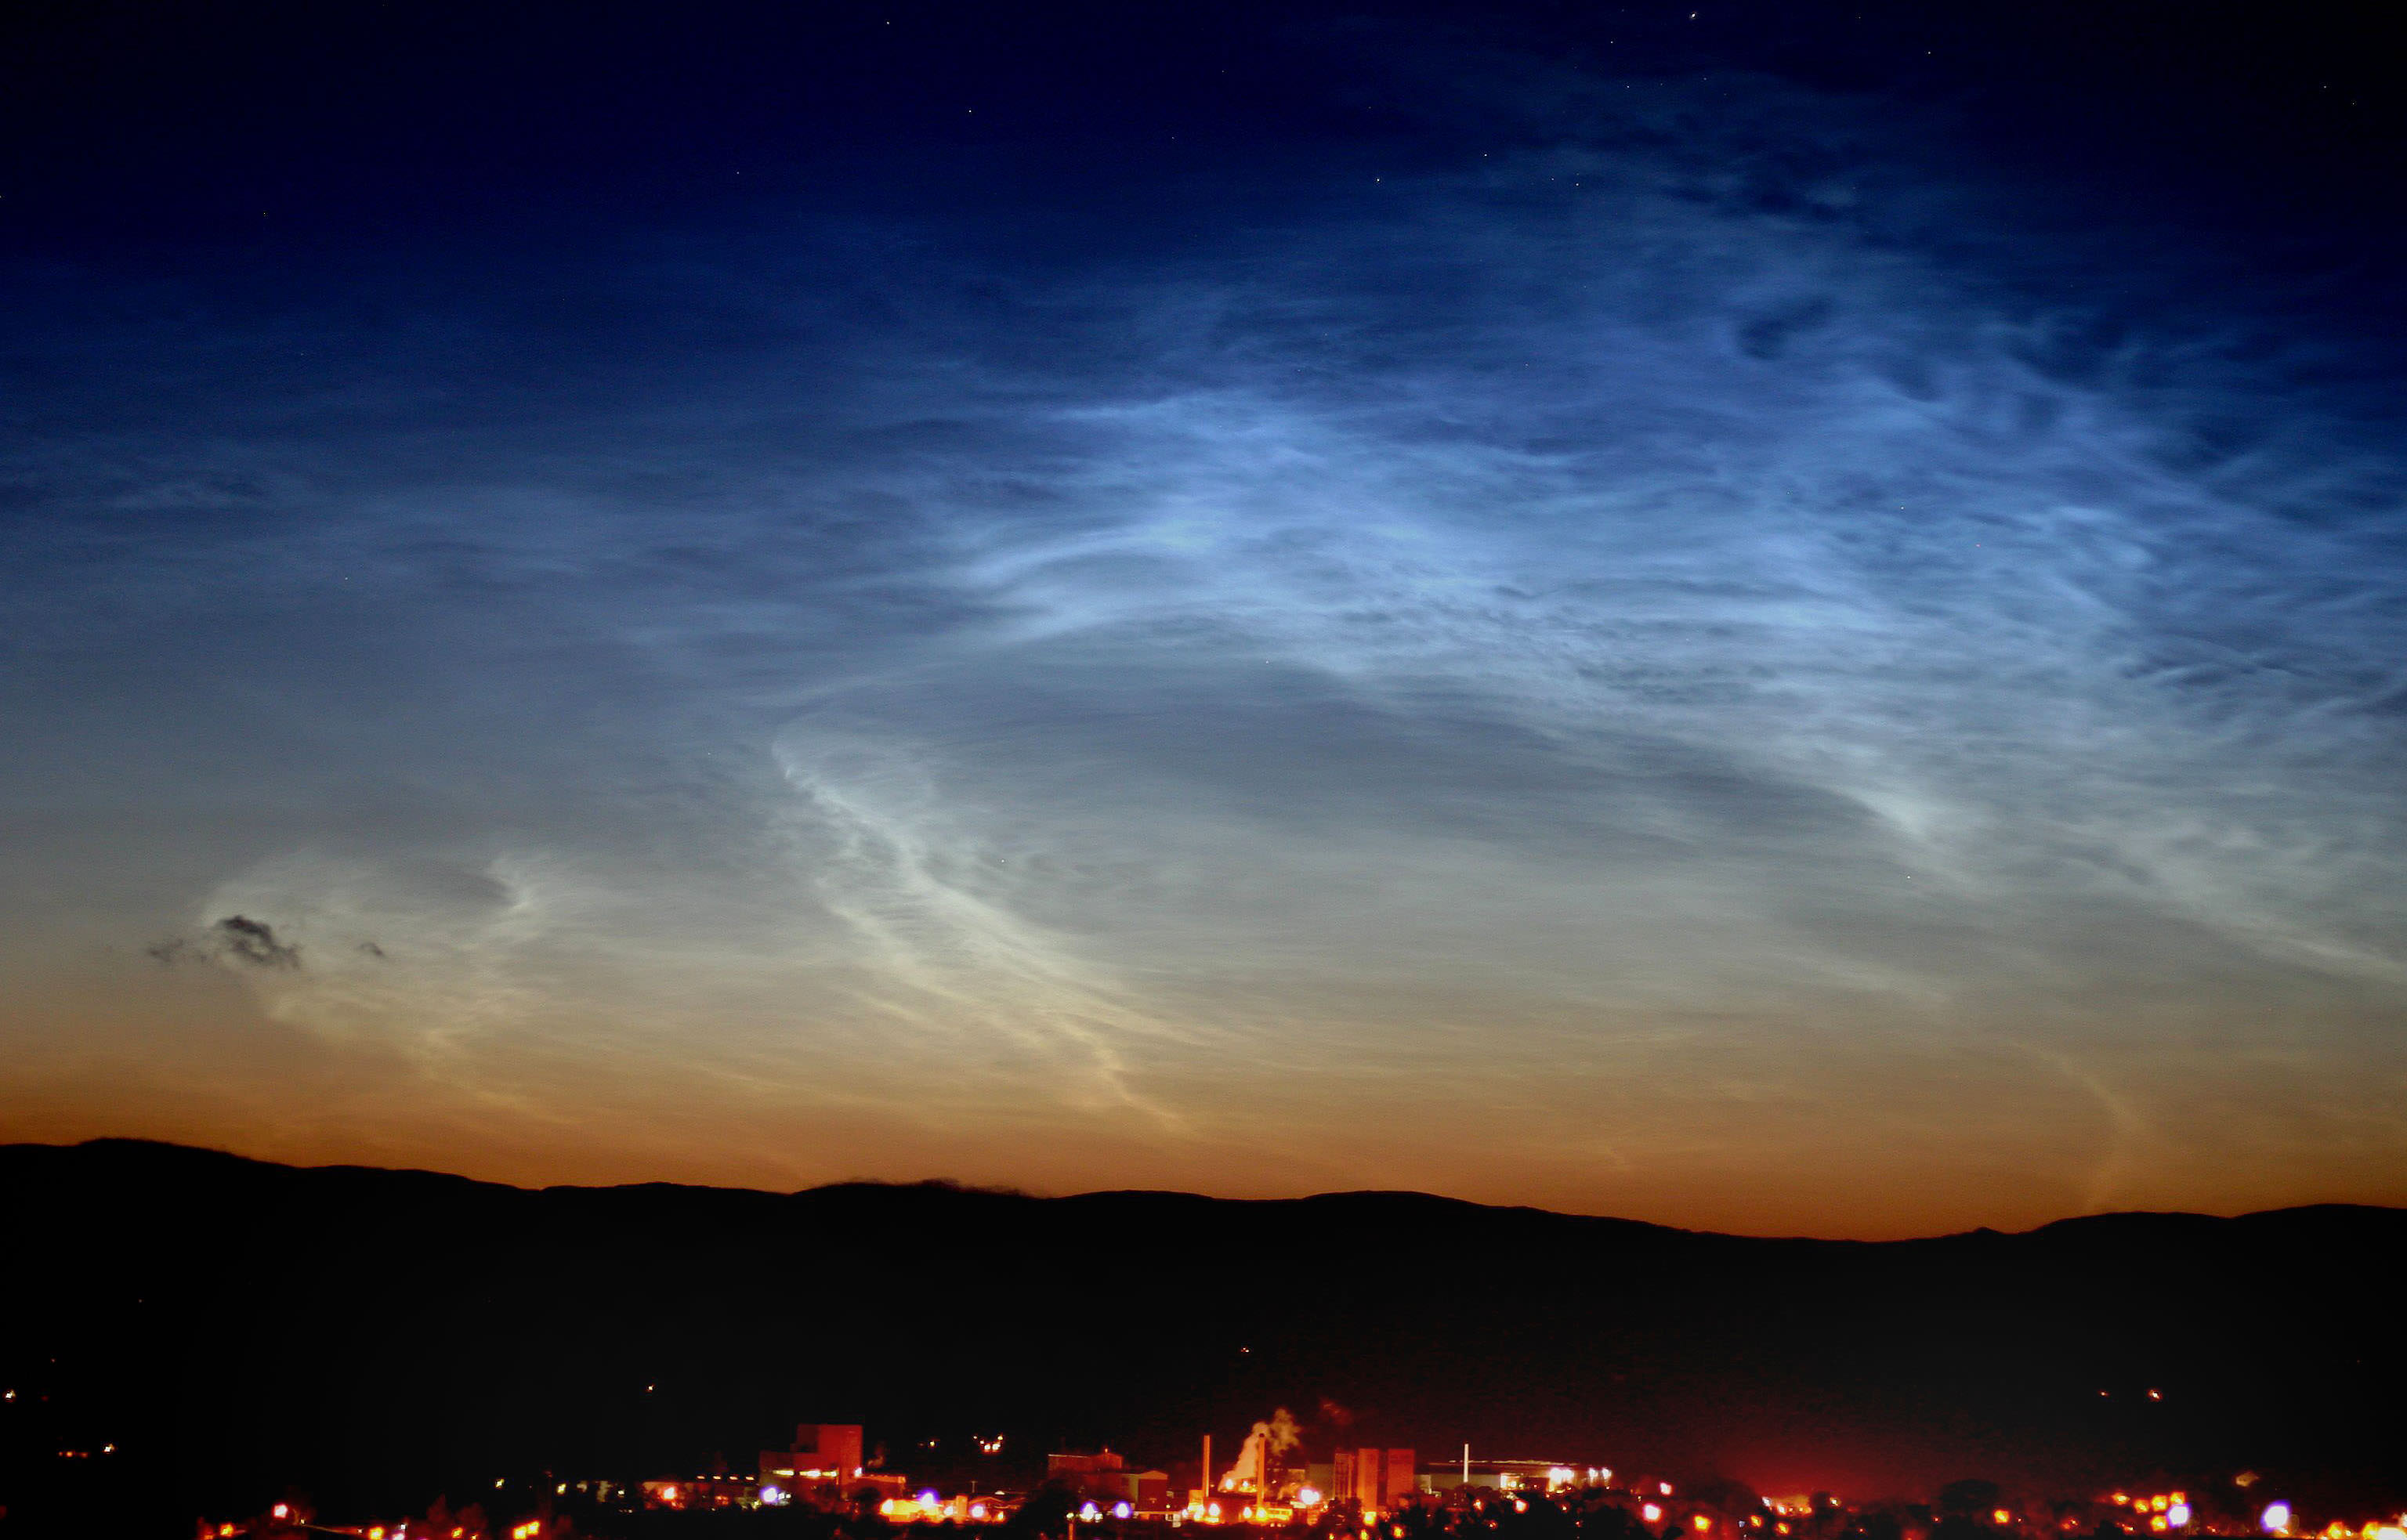
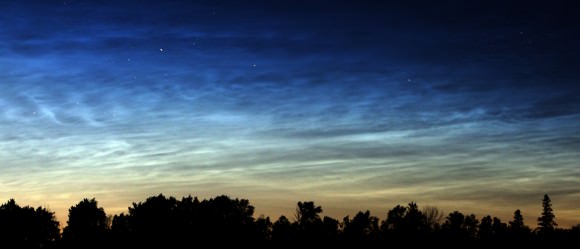
Noctilucent cloud display taken around midnight May 30 near Kendal Castle in northern England by Stuart Atkinson. "Beautiful display, better than all last year's pathetic displays combined - and the season has just started!" said Atkinson
Every year at this time I add a new item to my list of what to watch for in the night sky. Oddly enough, it’s clouds. I must be nuts, right? What astronomer needs more clouds? But these are different. Called noctilucent clouds (NLCs), these skittish objects are visible now and again low in the northern sky during morning and evening twilight. Late May through August is the best time to see them.
What are these wispy, sometimes eerie clouds? And how can you see them?
First a caveat. If you live in Mississippi your chances of spotting them are slimmer than a string bean. Uncommon to begin with, NLCs are typically visible at higher latitudes; the northern U.S., Canada and Europe are prime outposts for an NLC vigil.
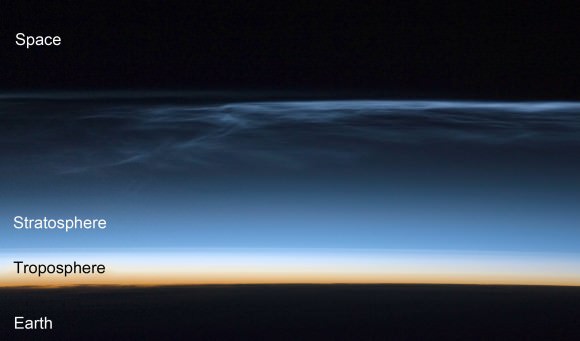
Noctilucent clouds, which form about 50 miles (80 km) high in the chilly mesosphere, lie high far above the troposphere, home to the more familiar clouds. Photo taken from the International Space Station. Credit: NASA
NLCs hole up in Earth’s mesosphere, a rarefied blanket of air extending from 30 to 53 miles (48-85 km) high. Most of the meteors we see burn up in this layer. It’s also extremely cold up there with temperatures at the top dropping to a teeth-rattling -130 F (-90 C). Because of their great height, noctilucent clouds reflect sunlight long after sunset when other clouds have gone gray and colorless. Their color is imparted by the ozone layer located 12-19 miles (19-30 km) overhead. The reds and oranges of reflected sunlight are absorbed by ozone on their way down to our eyes, tinting the clouds blue.
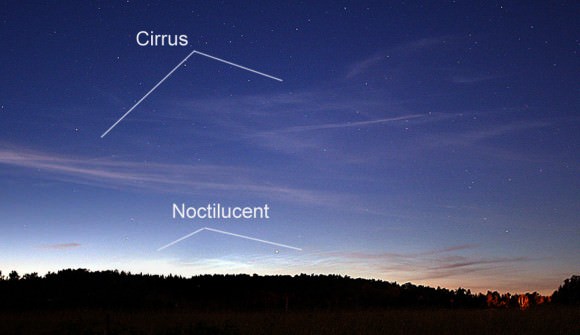
Cirrus clouds often look like fine streaks compared to the pleated, wavy appearance of NLCs. This photo also demonstrates the difference in their altitudes during a typical display across the northern U.S. Credit: Bob King
For any cloud to take shape and grow, water needs to stick to something. In day-to-day clouds, dust from wind storms – especially from the world’s deserts – supplies the necessary “nuclei” for the formation of water droplets and ice crystals.
Cirrus clouds, the ones that look like feathers wafting across the daytime sky, are typically about 10 miles high. Composed of ice crystals, they float near the top of the lowest, thickest layer of air called the troposphere. Noctilucent clouds share the realm of the Greek gods, basking in sunlight well into the night at an altitude of some 50 miles. That’s nearly as high as the aurora borealis, which can shimmy down to a scant 60 miles.
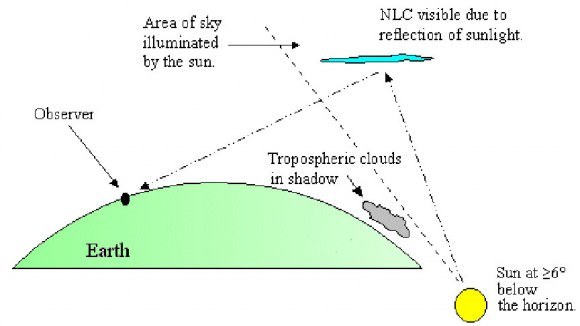
We see noctilucent clouds well after sunset when other clouds have gone dark because they’re much higher up and still able to catch sunlight and reflect it back to Earth. Credit: NASA
Since it’s next to impossible to get dust up high enough to provide nuclei for noctilucent cloud formation, scientists suspect outer space dust from meteoroids and comets provide some of the necessary material. As Earth travels around the sun, it sweeps up some 40,000 tons of interplanetary dust a year, plenty to get the job done. Other sources include volcanic dust and even chemical residues from rocket exhaust from the once-frequent launches of the space shuttle.
Winds from summer storms carry the water vapor into the mesosphere from the lower atmosphere which condenses on terrestrial and extraterrestrial dust nuclei. That’s why NLC displays are most frequent in summer.
Waves of NLCs on June 12, 2012 seen from Duluth, Minn. Credit: Bob King
Here in Duluth, Minn. at 47 degrees north I’ve seen probably half a dozen displays in years of sky watching, but to be honest, I only started looking for them in a dedicated way in the last 5 years. As late May approaches and twilight stretches deep into the evening hours, I scan the sky hoping for their return. The key to spotting NLCs is to find a place with a wide-open view of the northern horizon.
In the north, the sun retires around 9 p.m. and twilight ends more than two hours later. Watch for NLCs starting about an hour after sunset when cirrus clouds have turned pale gray and the stars begin to come out. From my home, they typically hover between 5 and 10 degrees (about a fist held at arm’s length or less) high above the northern horizon. The clouds make their first appearance at the upper end of that range, but as dusk deepens, they shrink back toward the horizon.
Video of NLCs from the Science Photo Library
NLCs look WEIRD. It’s not only their telltale eerie, plasma-blue coloration but their form that gives them away. Stripes, undulations, curls, streaks are mixed together in a way that seems alien. You might expect these on Mars maybe, but Earth? Binoculars are a huge help in appreciating the clouds’ peculiar textures and color. I say this because I’ve forgotten mine on several occasions. Two other dead giveaways – NLCs will grow brighter for a time as the sky grows darker. Regular clouds behave the opposite. NLCs also move and change shape very slowly because they’re so high up and far away.
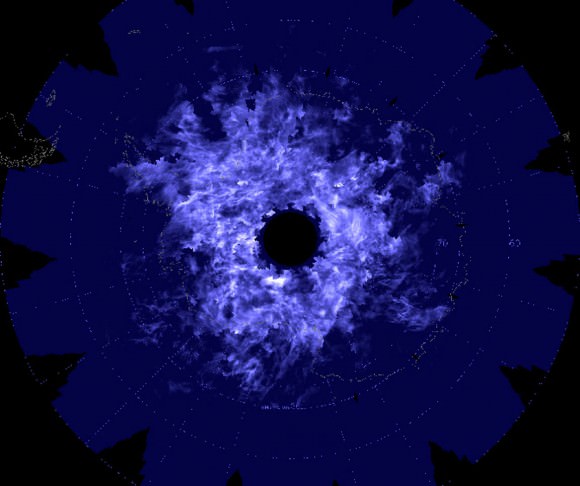
Looking down from above, the Aeronomy of Ice in the Mesosphere (AIM) Mission captured this composite image of noctilucent cloud cover above the South Pole on December 31, 2009. Click to read more about AIM. Credit: NASA/HU/VT/CU LASP
Night-shining clouds remain aglow until nearly twilight’s end. The cut-off viewing time for the northern U.S. is about 2 hours after sunset or earlier if the mosquitos have their way. By then the sun drops too far below the horizon to provide the light to sustain them. Those living farther north in Canada, northern Ireland, England and Finland, where the sky is never truly dark during the early summer months, can enjoy NLC viewing all night.
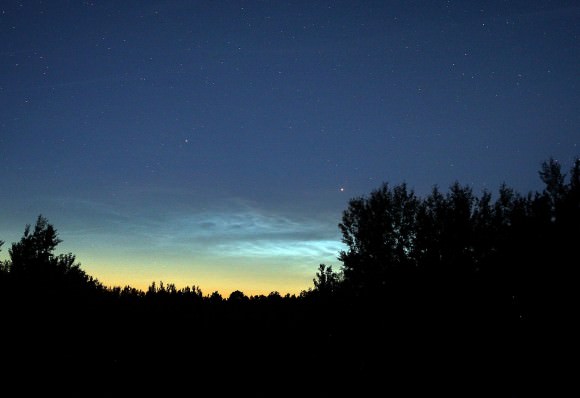
Dawn display with stars of electric-blue NLCs on June 13, 2012. Credit: Bob King
There are indications that NLC displays are becoming more common, even pushing into lower latitudes in the past 20-30 years. It might have to do with increased levels of carbon dioxide in Earth’s atmosphere. While CO2 helps to warm the lower air layers, it can can cause the upper atmosphere to grow chillier, creating the cold conditions necessary for accelerated noctilucent cloud formation. You can dig deeper into the topic HERE.
For more about Earth’s most unusual clouds, stop by the Noctilucent Cloud Observers’ Homepage. Like the northern lights, a thrilling noctilucent cloud display is a quest worth a trip to the north country.