Satellite Watches Dust from Chelyabinsk Meteor Spread Around the Northern Hemisphere

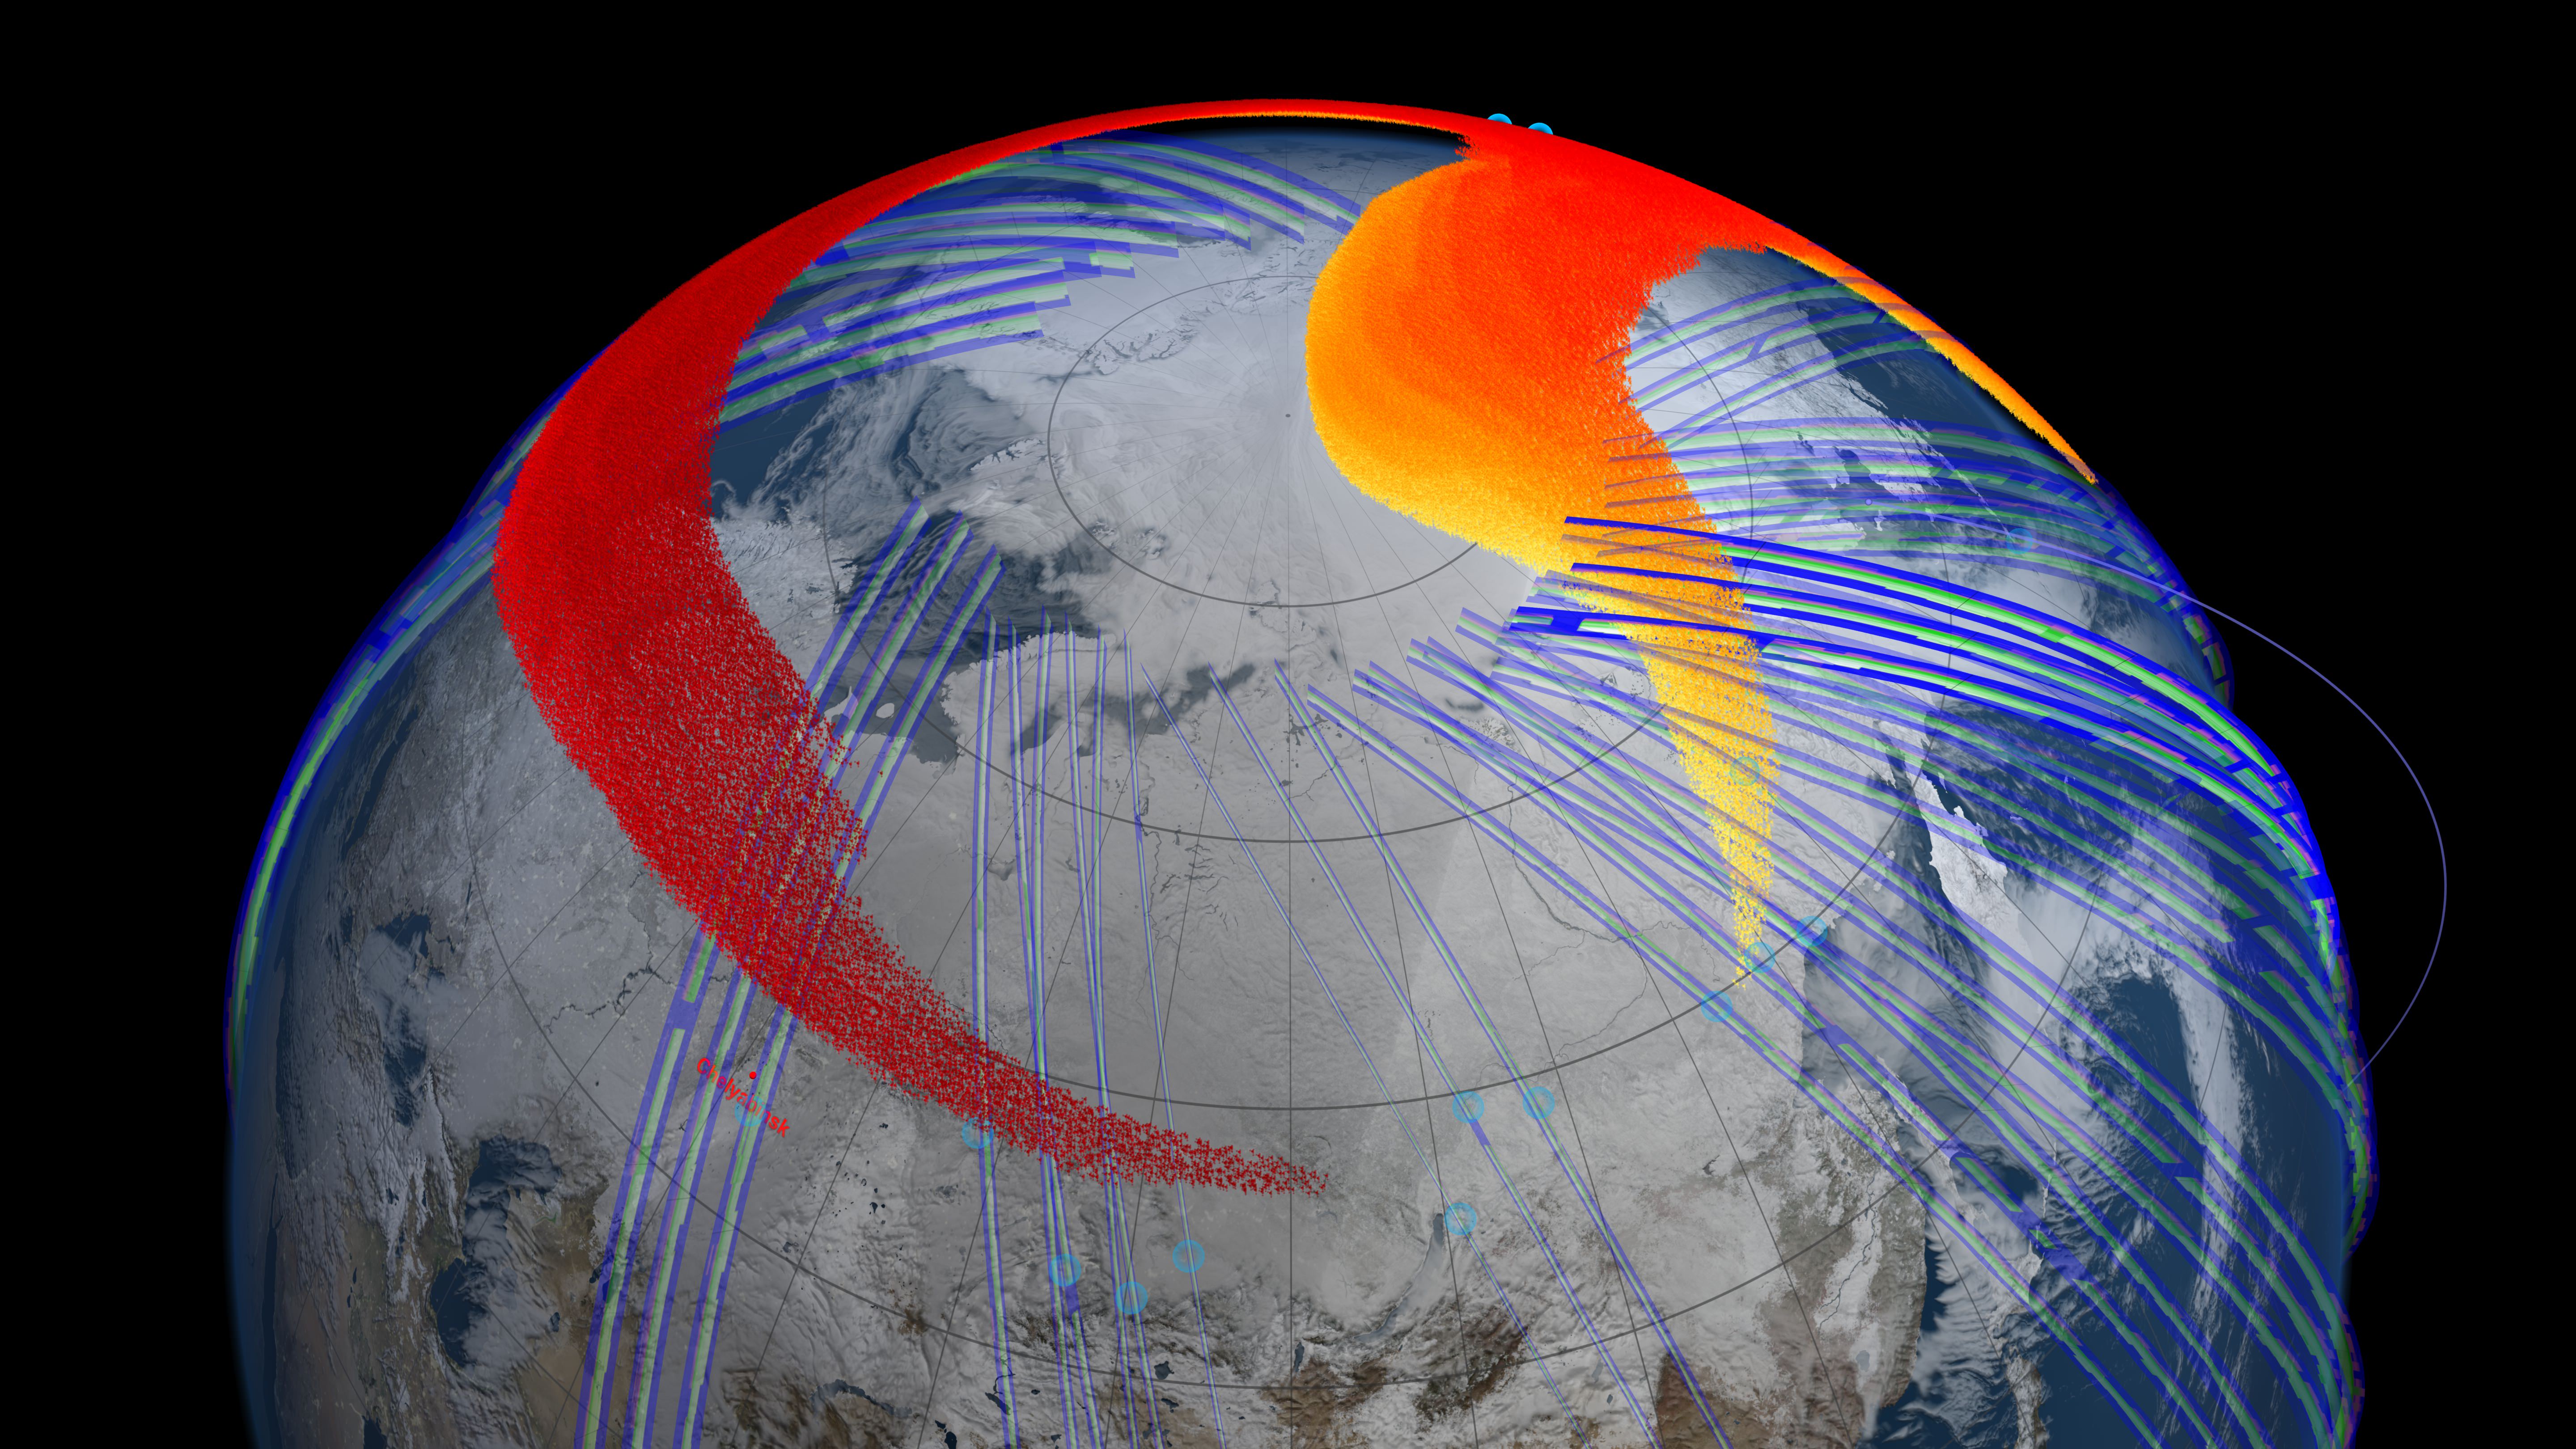
Model and satellite data show that four days after the bolide explosion, the faster, higher portion of the plume (red) had snaked its way entirely around the northern hemisphere and back to Chelyabinsk, Russia. Image Credit: NASA's Goddard Space Flight Center Scientific Visualization

When a meteor weighing 10,000 metric tons exploded 22.5 km (14 miles) above Chelyabinsk, Russia on Feb. 15, 2013, the news of the event spread quickly around the world. But that’s not all that circulated around the world. The explosion also deposited hundreds of tons of dust in Earth’s stratosphere, and NASA’s Suomi NPP satellite was in the right place to be able to track the meteor plume for several months. What it saw was that the plume from the explosion spread out and wound its way entirely around the northern hemisphere within four days.

The bolide, measuring 59 feet (18 meters) across, slipped quietly into Earth’s atmosphere at 41,600 mph (18.6 kilometers per second). When the meteor hit the atmosphere, the air in front of it compressed quickly, heating up equally as quick so that it began to heat up the surface of the meteor. This created the tail of burning rock that was seen in the many videos that emerged of the event. Eventually, the space rock exploded, releasing more than 30 times the energy from the atom bomb that destroyed Hiroshima. For comparison, the ground-impacting meteor that triggered mass extinctions, including the dinosaurs, measured about 10 km (6 miles) across and released about 1 billion times the energy of the atom bomb.

Atmospheric physicist Nick Gorkavyi from Goddard Space Flight Center, who works with the Suomi satellite, had more than just a scientific interest in the event. His hometown is Chelyabinsk.

“We wanted to know if our satellite could detect the meteor dust,” said Gorkavyi, who led the study, which has been accepted for publication in the journal Geophysical Research Letters. “Indeed, we saw the formation of a new dust belt in Earth’s stratosphere, and achieved the first space-based observation of the long-term evolution of a bolide plume.”

The team said they have now made unprecedented measurements of how the dust from the meteor explosion formed a thin but cohesive and persistent stratospheric dust belt.

About 3.5 hours after the initial explosion, the Ozone Mapping Profiling Suite instrument’s Limb Profiler on the NASA-NOAA Suomi National Polar-orbiting Partnership satellite detected the plume high in the atmosphere at an altitude of about 40 km (25 miles), quickly moving east at about 300 km/h (190 mph).

The day after the explosion, the satellite detected the plume continuing its eastward flow in the jet and reaching the Aleutian Islands. Larger, heavier particles began to lose altitude and speed, while their smaller, lighter counterparts stayed aloft and retained speed – consistent with wind speed variations at the different altitudes.

By Feb. 19, four days after the explosion, the faster, higher portion of the plume had snaked its way entirely around the Northern Hemisphere and back to Chelyabinsk. But the plume’s evolution continued: At least three months later, a detectable belt of bolide dust persisted around the planet.

Gorkavyi and colleagues combined a series of satellite measurements with atmospheric models to simulate how the plume from the bolide explosion evolved as the stratospheric jet stream carried it around the Northern Hemisphere.

“Thirty years ago, we could only state that the plume was embedded in the stratospheric jet stream,” said Paul Newman, chief scientist for Goddard’s Atmospheric Science Lab. “Today, our models allow us to precisely trace the bolide and understand its evolution as it moves around the globe.”

NASA says the full implications of the study remain to be seen. Scientists have estimated that every day, about 30 metric tons of small material from space encounters Earth and is suspended high in the atmosphere. Now with the satellite technology that’s capable of more precisely measuring small atmospheric particles, scientists should be able to provide better estimates of how much cosmic dust enters Earth’s atmosphere and how this debris might influence stratospheric and mesospheric clouds.

It will also provide information on how common bolide events like the Chelyabinsk explosion might be, since many might occur over oceans or unpopulated areas.

“Now in the space age, with all of this technology, we can achieve a very different level of understanding of injection and evolution of meteor dust in atmosphere,” Gorkavyi said. “Of course, the Chelyabinsk bolide is much smaller than the ‘dinosaurs killer,’ and this is good: We have the unique opportunity to safely study a potentially very dangerous type of event.”

Source: NASA

Two Beautiful Timelapse Videos of the 2013 Perseid Meteor Shower

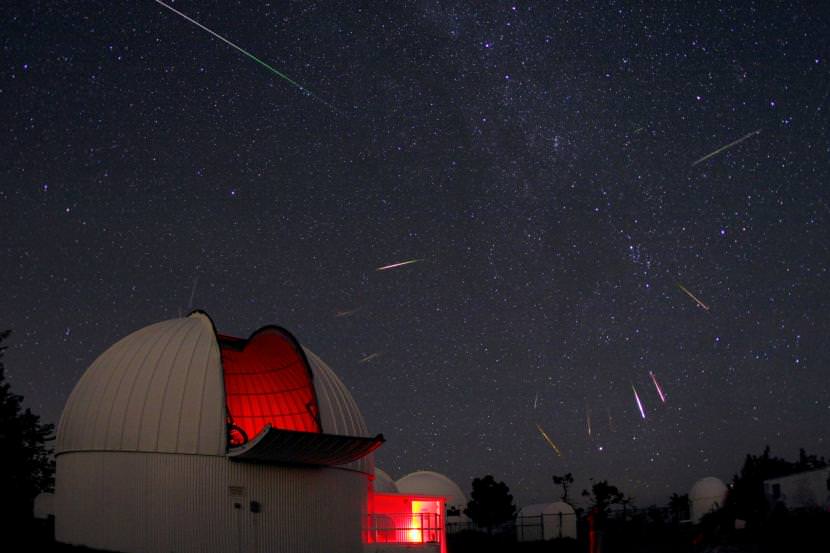
Composite image of the Perseid Meteor Shower radiant, from the Mount Lemmon SkyCenter in Arizona. Credit and copyright: Adam Block.

We’re still swooning over the great images and videos coming in from this year’s Perseid Meteor Shower. Here are a couple of timelapse videos just in today: the first is from P-M Hedén showing 25 Perseid meteors, but you can also see Noctilucent clouds, a faint Aurora Borealis, airglow, satellites passing over and lightning. “It was a magic night!,” P-M said.

See another view from the Mount Lemmon SkyCenter in Arizona, below:

This timelapse was created by Adam Block and shows a few hours of the experience guests at the Mount Lemmon SkyCenter had on August 11/12, 2013 during the Perseids: they could look through the 0.8m Schulman telescope and enjoy being outside to see the meteors streaking overhead. Flashlights and other sources illuminate the ground and the observatory. Find out more about the observatory here.

The USAF’s ‘Space Fence’ Surveillance System: Another Victim of Sequestration

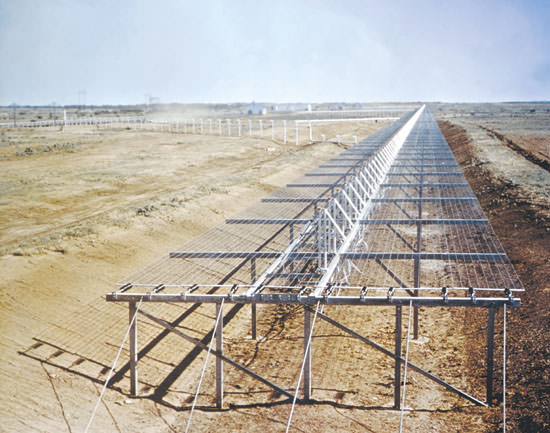
Space fence... Credit:

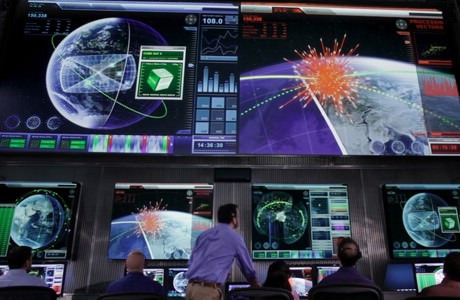
Times are getting tougher in the battle to track space debris. A key asset in the fight to follow and monitor space junk is getting the axe on October 1st of this year. United States Air Force General and commander of Air Force Space Command William Shelton has ordered that the Air Force Space Surveillance System, informally known as Space Fence will be deactivated. The General also directed all related sites across the southern United States to prepare for closure.

This shutdown will be automatically triggered due to the U.S. Air Force electing not to renew its fifth year contract with Five Rivers Services, the Colorado Springs-based LLC that was awarded the contract for the day-to-day management of the Space Fence surveillance system in 2009.

To be sure, the Space Fence system was an aging one and is overdue for an upgrade and replacement.

The Space Fence system was first brought on line in the early days of the Space Age in the 1961. Space Fence was originally known as the Naval Space Surveillance (NAVSPASUR) system until passing into the custody of the U.S. Air Force’s 20th Space Control Squadron in late 2004. Space Fence is a series of multi-static VHF receiving and transmitting sites strung out across the continental United States at latitude 33° north ranging from California to Georgia.

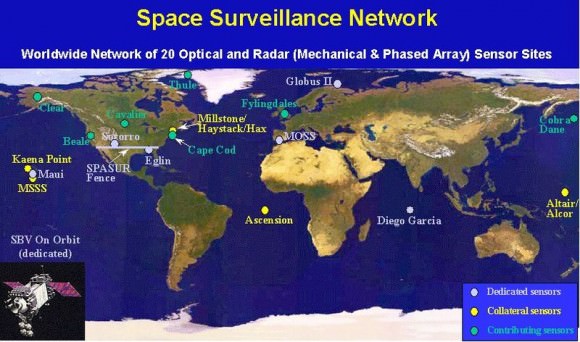
The Worldwide Space Surveillance Network, including Space Fence across the southern United States. (Credit: the U.S. Department of Defense).

Space Fence is part of the greater Space Surveillance Network, and comprises about 40% of the overall observations of space debris and hardware in orbit carried out by the U.S. Air Force. Space Fence is also a unique asset in the battle to track space junk and dangerous debris, as it gives users an “uncued” tracking ability. This means that it’s constantly “on” and tracking objects that pass overhead without being specifically assigned to do so.

Space Fence also has the unique capability to track objects down to 10 centimeters in size out to a distance of 30,000 kilometres. For contrast, the average CubeSat is 10 centimetres on a side, and the tracking capability is out to about 67% of the distance to geosynchronous orbit.

Exact capabilities of the Space Fence have always been classified, but the master transmitter based at Lake Kickapoo, Texas is believed to be the most powerful continuous wave facility in the world, projecting at 768 kilowatts on a frequency of 216.97927 MHz. The original design plans may have called for a setup twice as powerful.

A replacement for Space Fence that will utilize a new and upgraded S-Band radar system is in the works, but ironically, that too is being held up pending review due to the sequestration. Right now, the Department of Defense is preparing for various scenarios that may see its budget slashed by 150 to 500 billion dollars over the next 10 years.

The control center display of the prototype for the next generation Space Fence. (Credit: Lockheed Martin).

The U.S. Air Force has already spent $500 million to design the next generation Space Fence, and awarded contracts to Raytheon, Northrop Grumman and Lockheed Martin in 2009 for its eventual construction.

The eventual $3 billion dollar construction contract is on hold, like so many DoD programs, pending assessment by the Strategic Choices and Management Review, ordered by Secretary of Defense Chuck Hagel earlier this year.

“The AFSSS is much less capable than the space fence radar planned for Kwajalein Island in the Republic of the Marshall Islands,” stated General Shelton in a recent U.S. Air Force press release. “In fact, it’s apples and oranges in trying to compare the two systems.”

One thing’s for certain. There will be a definite capability gap when it comes to tracking space debris starting on October 1st until the next generation Space Fence comes online, which may be years in the future.

In the near term, Air Force Space Command officials have stated that a “solid space situational awareness” will be maintained by utilizing the space surveillance radar at Eglin Air Force Base in the Florida panhandle and the Perimeter Acquisition Radar Characterization System at Cavalier Air Force Station in North Dakota.

We’ve written about the mounting hazards posed by space debris before. Just earlier this year, two satellites were partially damaged due to space debris. Space junk poses a grave risk to the residents of the International Space Station, which must perform periodic Debris Avoidance Maneuvers (DAMs) to avoid collisions. Astronauts have spotted damage on solar arrays and handrails on the ISS due to micro-meteoroids and space junk. And on more than one occasion, the ISS crew has sat out a debris conjunction that was too close to call in their Soyuz spacecraft, ready to evacuate if necessary.

In 2009, a collision between Iridium 33 and the defunct Cosmos 2251 satellite spread debris across low Earth orbit. In 2007, a Chinese anti-satellite missile test also showered low Earth orbit with more of the same. Ironically, Space Fence was crucial in characterizing both events.

Satellites, such as NanoSail-D2, have demonstrated the capability to use solar sails to hasten reentry at the end of a satellites’ useful life, but we’re a long ways from seeing this capability standard on every satellite.

Amateurs will be affected by the closure of Space Fence as well. Space Weather Radio relies on ham radio operators, who listen for the “pings” generated by the Space Fence radar off of meteors, satellites and spacecraft.

“When combined with the new Joint Space Operations Center’s high-performance computing environment, the new fence will truly represent a quantum leap forward in space situational awareness for the nation,” General Shelton said.

But for now, it’s a brave and uncertain world, as Congress searches for the funds to bring this new resource online. Perhaps the old system will be rescued at the 11th hour, or perhaps the hazards of space junk will expedite the implementation of the new system. Should we pass the hat around to “Save Space Fence?”

An Occult Occurrence: Saturn’s Moon Iapetus Blocks a Background Star

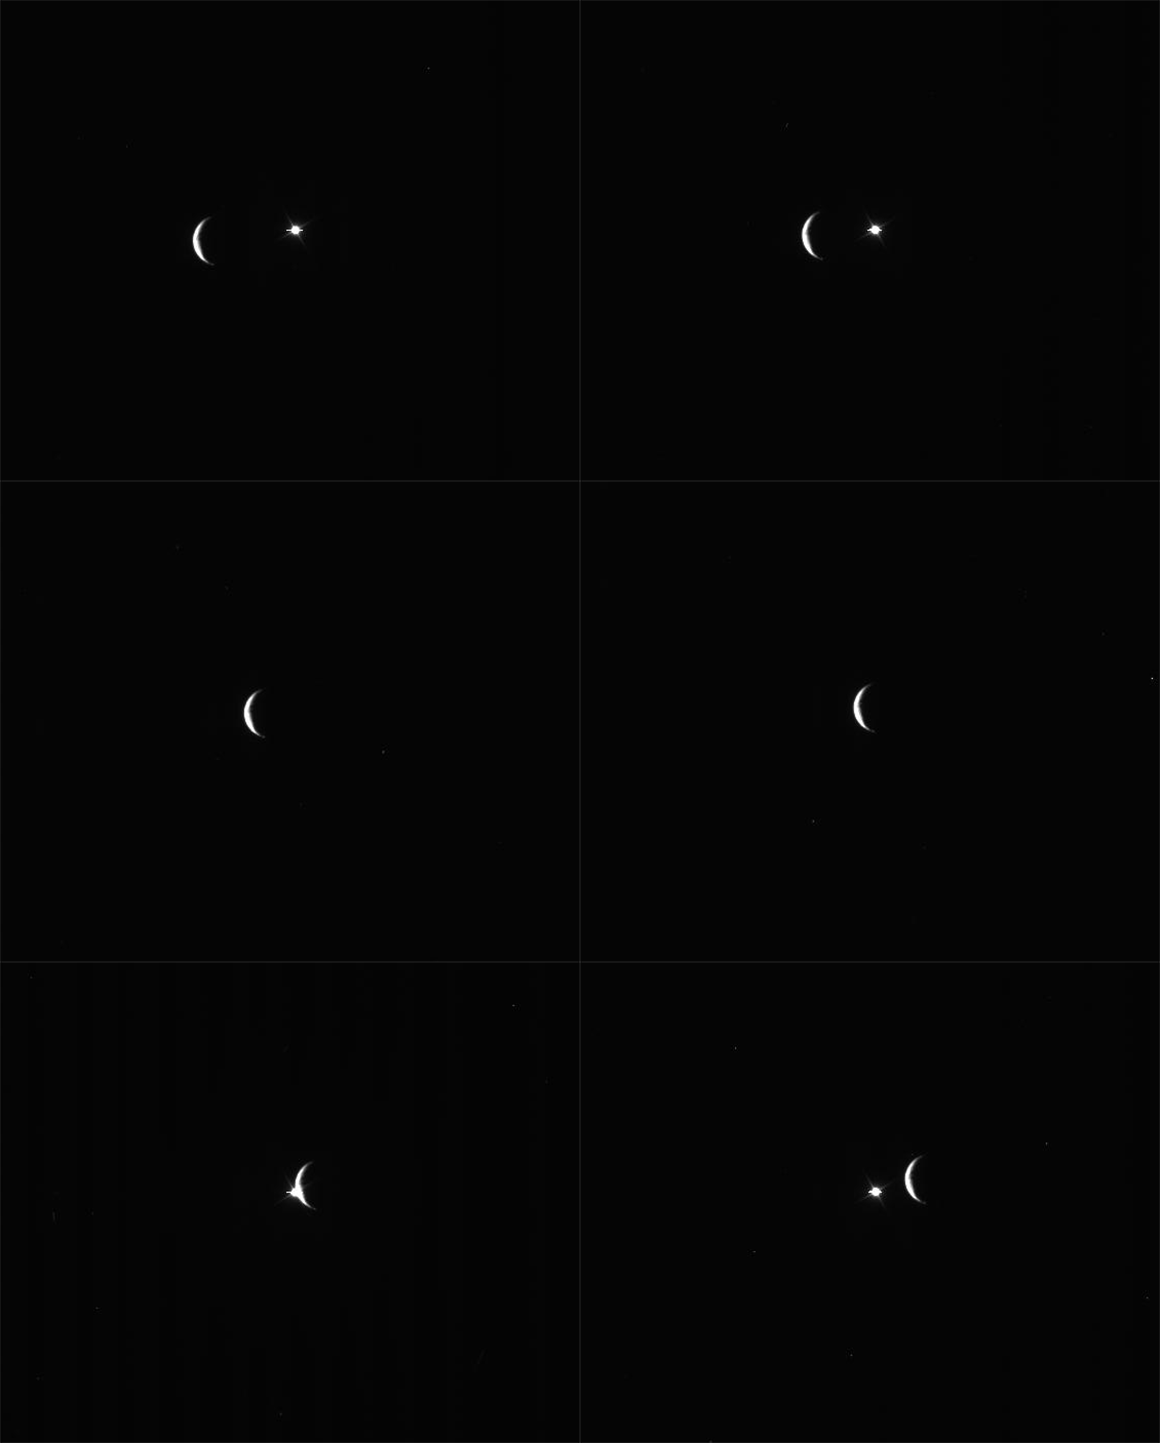
Animation of Iapetus briefly blocking a distant bright object. (NASA/JPL-Caltech/SSI. Assembled by Jason Major.)

It’s a cosmic cover-up! No, don’t put your tinfoil* hats on, this isn’t a conspiracy — it’s just Saturn’s moon Iapetus drifting in front of the bright star Gamma Orionis (aka Bellatrix) captured on Cassini’s narrow-angle camera on August 10, 2013.

Such an event is called an occultation, a term used in astronomy whenever light from one object is blocked by another — specifically when something visually larger moves in front of something apparently smaller. (The word occult means to hide or conceal… nothing mystical implied!)

The animation above was assembled from 19 raw images publicly available on the JPL Cassini mission site, stacked in Photoshop and exported as a gif. They’ve been rotated 90º from the originals but otherwise they’re right from Cassini’s camera.

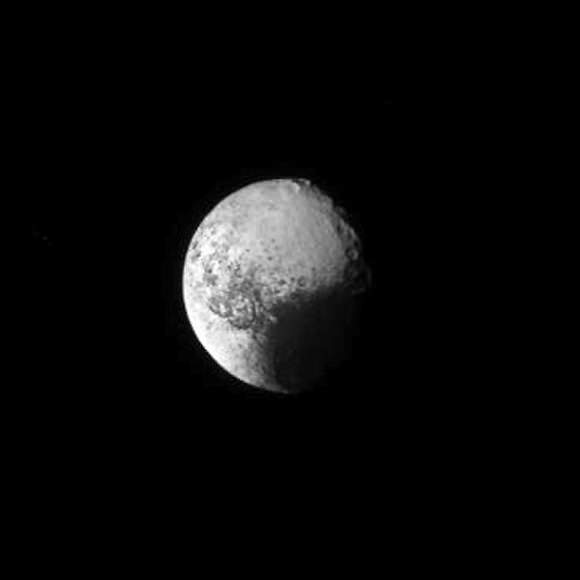
Iapetus, seen above as just a thin crescent, is best known for its two-toned appearance. One half of the 914-mile-wide moon is bright and icy, the other coated with a layer of dark reddish material, giving it a real “yin-yang” appearance. (Ok, I guess that’s a little mystical. But purely coincidental.)

The Tao of Iapetus (NASA/JPL-Caltech/SSI)

It’s thought that the dark material originates from a more distant moon, Phoebe, which is being pelted by micrometeorites and shedding its surface out into orbit around Saturn, which eventually gets scooped up by the backwards-orbiting Iapetus.

The difference in albedo affects how Iapetus absorbs solar radiation too, causing the water ice beneath the darker material to evaporate over the course of its 79-Earth-day rotation and migrate around its surface, creating a sort of positive feedback loop.

While neat to look at, occultations are important to science because they provide a way to briefly peer into a world’s atmosphere (or in a small moon’s case, exosphere). Watching how light behaves as it passes behind the limb of a planet or moon lets researchers learn details of the air around it — however tenuous — pretty much for free… no probes or flybys needed!

The occulted star above is Bellatrix, the 1.6-magnitude star that marks Orion’s left shoulder.

Iapetus orbits Saturn at the considerable distance of 2,212,889 miles (3,561,300 km). Learn more about Iapetus here, and as always you can find more fantastic Cassini images from Carolyn Porco’s team at the Space Science Institute in Boulder, Colorado at the CICLOPS site here.

______________________

*Do they still make foil out of tin any more? 

These 12 Asteroids Are The Easiest Ones To Bring Back To Earth

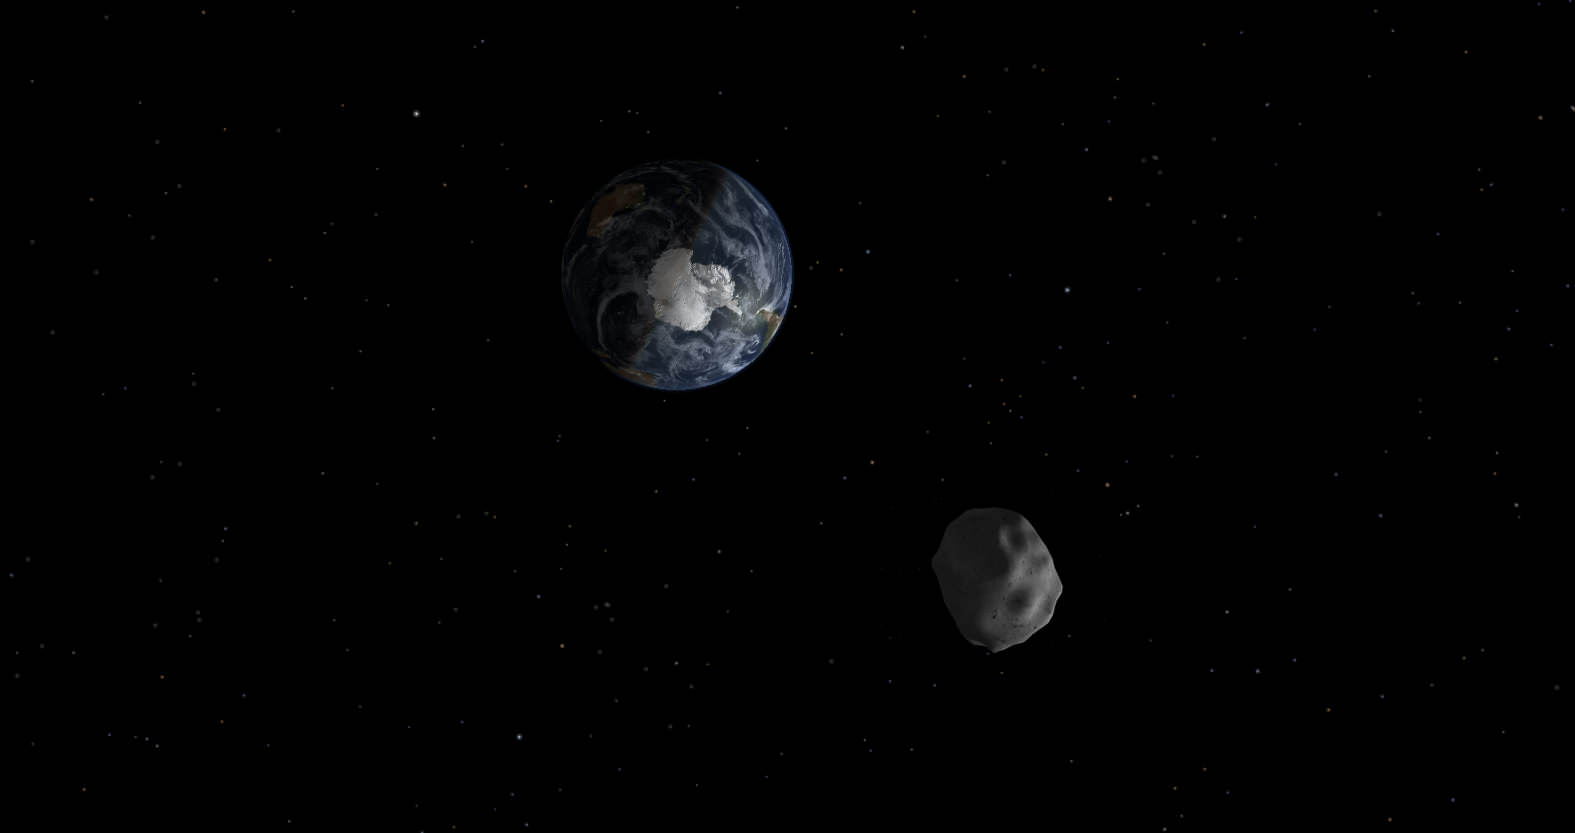
In February 2013, asteroid DA 2014 safely passed by the Earth. There are several proposals abounding about bringing asteroids closer to our planet to better examine their structure. Credit: NASA/JPL-Caltech

As NASA works through proposals for an asteroid retrieval mission, a new paper shows that there are other research groups considering which asteroids to pick first.

One scientific team has identified 12 “Easily Retrievable Objects” in our solar system that are circling the sun and would not cost too much to retrieve (in relative terms, of course!)

The definition of an ERO is an object that can be captured and brought back to a stable gravitational point near Earth (called a Lagrange point, or more specifically the L1/L2 points between the sun and the Earth.) The change in speed necessary in these objects to make them easily retrievable is “arbitrarily” set at 500 meters per second (1,641 feet/second) or less, the researchers stated.

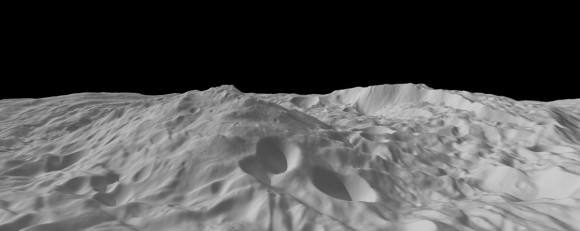
Image of asteroid Vesta calculated from a shape model, showing a tilted view of the topography of the south polar region. This perspective shows the topography, but removes the overall curvature of Vesta, as if the giant asteroid were flat and not rounded. Credit: NASA

Catching the objects wouldn’t just be a technology demonstration, but also could shed some light into how the solar system formed. Asteroids are generally considered leftovers of the early days of the neighborhood; under our current understanding of the solar system’s history, a spinning disc of gas and dust gradually clumped into rocks and other small objects, which eventually crashed into each other and formed planets.

Also, steering these objects around has another benefit: teaching humans how to deflect potentially hazardous asteroids from smacking into the Earth and causing damage. As we were reminded about earlier this year, even smaller rocks such as the one that broke up over a portion of Russia can be hazardous.

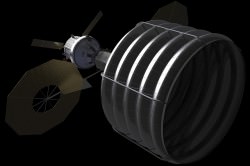
Concept of NASA spacecraft with Asteroid capture mechanism deployed to redirect a small space rock to a stable lunar orbit for later study by astronauts aboard Orion crew capsule. Credit: NASA.

There are at least a couple of big limitations to the plan. The first is to make sure not to put the asteroid in a path that would hit the Earth. The second is that he L1 and L2 points are somewhat unstable, so over time the asteroid would drift from its spot. It would need a nudge every so often to keep it in that location.

That said, NASA is taking a serious look at the matter, as well as two groups that would like to mine asteroids: Planetary Resources and Deep Space Industries.

For the curious, this is the complete list of possible asteroids: 2006 RH120, 2010 VQ98, 2007 UN12, 2010 UE51, 2008 EA9, 2011 UD21, 2009 BD, 2008 UA 202, 2011 BL45, 2011 MD, 2000 SG344 and 1991 VG.

More details are available in the paper, “Easily retrievable objects among the NEO population“, which is published in the August 2013 edition of Celestial Mechanics and Dynamical Astronomy. A preprint version is also available on Arxiv.

SpaceX Grasshopper Performs Divert Maneuver

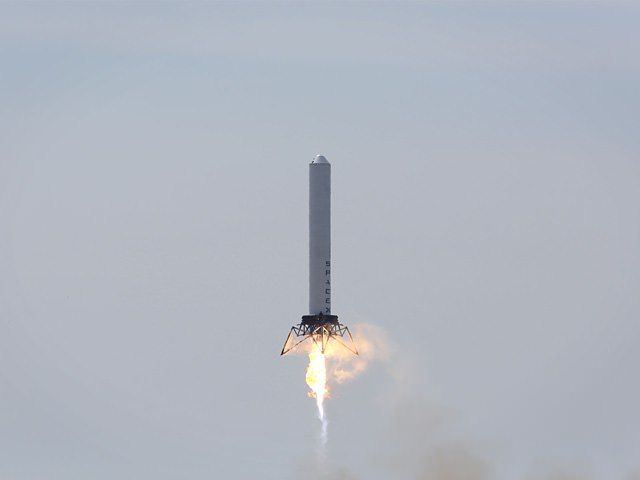
The SpaceX Grasshopper during its test flight on March 7, 2013. Credit: SpaceX.

SpaceX proved yesterday that their Grasshopper prototype Vertical Takeoff Vertical Landing (VTVL) vehicle can do more than just go straight up and down. The goal of the test, said SpaceX CEO Elon Musk on Twitter was, “hard lateral deviation, stabilize & hover, rapid descent back to pad.”

On August 13th, the Grasshopper did just that, completing a divert test, flying to a 250-meter altitude with a 100-meter lateral maneuver before returning to the center of the pad. SpaceX said the test demonstrated the vehicle’s ability to perform more aggressive steering maneuvers than have been attempted in previous flights.

While most rockets are designed to burn up in the atmosphere during reentry, SpaceX is looking to make their next generation of Falcon 9 rocket be able to return to the launch pad for a vertical landing.

This isn’t easy. The 10-story Grasshopper provides a challenge in controlling the structure. The Falcon 9 with a Dragon spacecraft is 48.1 meters (157 feet) tall, which equates to about 14 stories high. SpaceX said diverts like this are an important part of the trajectory in order to land the rocket precisely back at the launch site after reentering from space at hypersonic velocity.

Also on Twitter this morning, NASA’s Jon Cowert (who is now working with the Commercial Crew program) provided a look back at NASA’s foray into VTVL vehicles with the Delta Clipper Experimental vehicle,(DC-X). The video below is from July 7, 1995, and the Delta Clipper was billed as the world’s first fully reusable rocket vehicle. This eighth test flight proved that the vehicle could turn over into a re-entry profile and re-orient itself for landing. This flight took place at the White Sands Missile Range in southern New Mexico.

But after some problems (fires and the spacecraft actually fell over when a landing strut didn’t extend) NASA decided to try and focus on the X-33 VentureStar, which would land like an airplane…. and that didn’t work out very well either.

But that’s another story.

How Do Black Holes Get Super Massive?

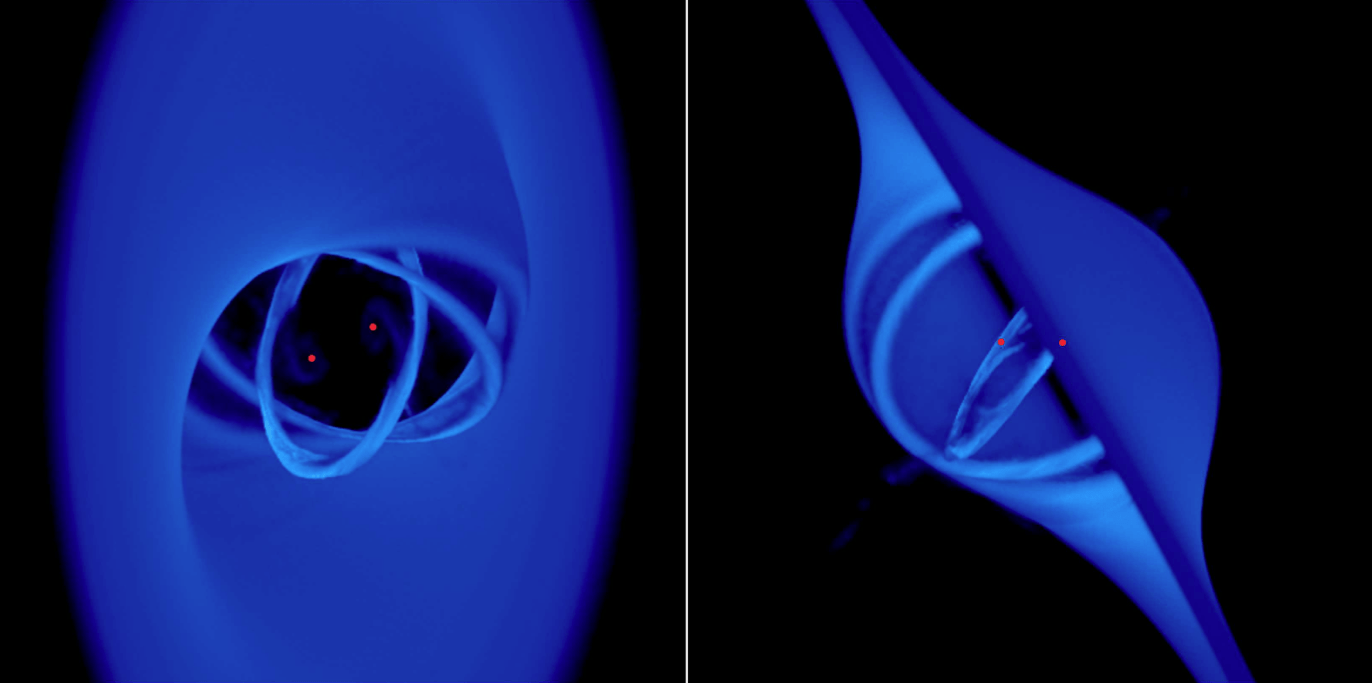
A binary black hole pair with an accretion disk inclined 45 degrees. Source: Nixon et al.

Since their discovery, supermassive black holes – the giants lurking in the center of every galaxy – have been mysterious in origin. Astronomers remain baffled as to how these supermassive black holes became so massive.

New research explains how a supermassive black hole might begin as a normal black hole, tens to hundreds of solar masses, and slowly accrete more matter, becoming more massive over time. The trick is in looking at a binary black hole system.  When two galaxies collide the two supermassive black holes sink to the center of the merged galaxy and form a binary pair.  The accretion disk surrounding the two black holes becomes misaligned with respect to the orbit of the binary pair. It tears and falls onto the black hole pair, allowing it to become more massive.

In a merging galaxy the gas flows are turbulent and chaotic. Because of this “any gas feeding the supermassive black hole binary is likely to have angular momentum that is uncorrelated with the binary orbit,” Dr. Chris Nixon, lead author on the paper, told Universe Today. “This makes any disc form at a random angle to the binary orbit.

Nixon et al. examined the evolution of a misaligned disk around a binary black hole system using computer simulations. For simplicity they analyzed a circular binary system of equal mass, acting under the effects of Newtonian gravity. The only variable in their models was the inclination of the disk, which they varied from 0 degrees (perfectly aligned) to 120 degrees.

After running multiple calculations, the results show that all misaligned disks tear. Watch tearing in action below:

In most cases this leads to direct accretion onto the binary.

“The gravitational torques from the binary are capable of overpowering the internal communication in the gas disc (by pressure and viscosity),” explains Nixon. “This allows gas rings to be torn off, which can then be accreted much faster.”

Such tearing can produce accretion rates that are 10,000 times faster than if the exact same disk were aligned.

In all cases the gas will dynamically interact with the binary.  If it is not accreted directly onto the black hole, it will be kicked out to large radii.  This will cause observable signatures in the form of shocks or star formation.  Future observing campaigns will look for these signatures.

In the meantime, Nixon et al. plan to continue their simulations by studying the effects of different mass ratios and eccentricities.  By slowly making their models more complicated, the team will be able to better mimic reality.

Quick interjection: I love the simplicity of this analysis. These results provide an understandable mechanism as to how some supermassive black holes may have formed.

While these results are interesting alone – based on that sheer curiosity that drives the discipline of astronomy forward – they may also play a more prominent role in our local universe.

Before we know it (please read with a hint of sarcasm as this event will happen in 4 billion years) we will collide with the Andromeda galaxy. This rather boring event will lead to zero stellar collisions and a single black hole collision – as the two supermassive black holes will form a binary pair and then eventually merge.

Without waiting for this spectacular event to occur, we can estimate and model the black hole collision.  In 4 billion years the video above may be a pretty good representation of our collision with the Andromeda galaxy.

The results have been published in the Astrophysical Journal Letters (preprint available here). (Link was corrected to correct paper on 8/15/2013).

What Is Elon Musk’s Hyperloop, And Why Is It Important?

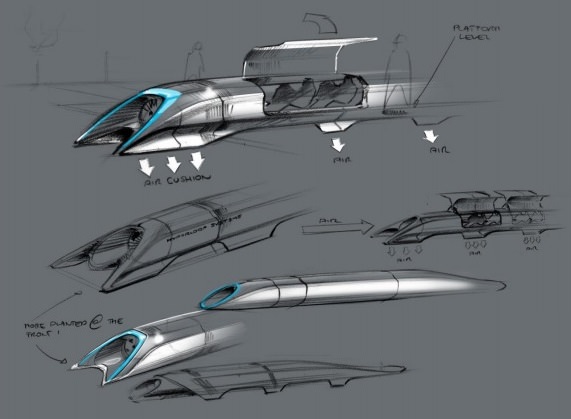
Artist's conception of Elon Musk's hyperloop high-speed travel concept. Credit: Elon Musk/SpaceX/Tesla Motors

This week, SpaceX founder and billionaire Elon Musk (who also founded electric vehicle manufacturer Tesla Motors) released his vision for a futuristic transportation system. Called hyperloop, it’s supposed to be better than flying supersonic over short distances. To give you a quick overview, we’ve summarized a portion of his paper below.

What is a hyperloop? In Musk’s words, a hyperloop is a system to “build a tube over or under the ground that contains a special environment.” Cars would basically be propelled in this tube. One example could be a huge sort of pneumatic tube where high-speed fans would compress and push the air — although the friction implications make Musk skeptical that it would work. Another option is having a vacuum in the tube and using electromagnetic suspension instead. Musk acknowledges it is hard to maintain a vacuum (one small leak in hundreds of miles of tubing, and the system shuts down), but there are pumping solutions to overcome this. He favors the second solution.

What is the motivation? Musk is seeking an alternative to flying or driving that would be “actually better than flying or driving.” He expressed disappointment that a proposed high-speed rail project in California is actually one of the slowest and most expensive of its type in the world, and speculated that there must be a better way.

What is the biggest technical challenge? Overcoming something called the Kantrowitz limit. Musk describes this as the “top speed law for a given tube to pod area ratio”. More simply, if you have a vehicle moving into an air-filled tube, there needs to be a minimum distance between the walls of the vehicle and the walls of the tube. Otherwise, Musk writes, “the capsule will behave like a syringe and eventually be forced to push the entire column of air in the system. Not good.”

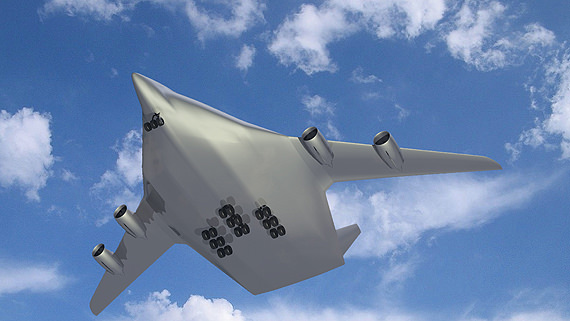
Artist concept of a futuristic 'flying wing' airplane. Credit: DLR
In Musk’s view, his hyperloop system would be better than futuristic (perhaps supersonic) aircraft over short distances. Artist concept of one potential airplane future design incorporating a ‘flying wing’. Credit: DLR

How will Musk overcome that challenge? The principal ways of getting around it is to move slowly or quickly. A hyperfast speed would be a “dodgy prospect”, Musk writes, so his solution is to put an electric compressor fan on the capsule nose that would move high-pressure air from the front to the back of the vehicle. As a bonus, this would reduce friction. Yes, there are batteries available that would have enough power to keep the fan running for the journey’s length, he says.

How is hyperloop powered? Solar panels would be placed on top of the tube, providing enough juice to keep the vehicles moving, according to Musk’s calculations.

What about earthquakes? Musk acknowledges that a long-range system is susceptible to earthquakes. “By building a system on pylons, where the tube is not rigidly fixed at any point, you can dramatically mitigate earthquake risk and avoid the need for expansion joints,” he writes.

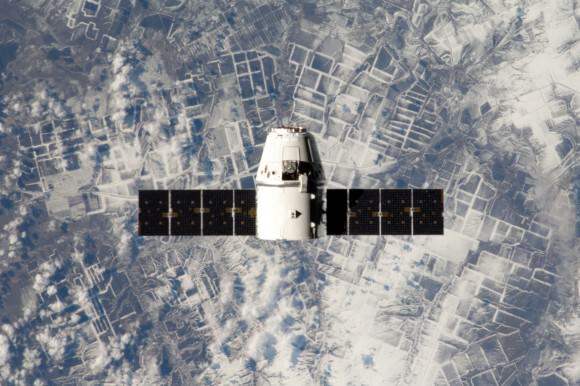
Dragon in orbit during the CRS-2 mission. Credit: NASA/CSA/Chris Hadfield
One of Elon Musk’s greatest achievements is overseeing the build of a spacecraft, called Dragon, which now makes periodic runs to the International Space Station. Credit: NASA/CSA/Chris Hadfield

Where would hyperloop be used? In a description of the system, Musk says the hyperloop would be best served in “high-traffic city pairs that are less than about 1,500 km or 900 miles apart.” Anything more distant, and supersonic travel would be the best solution. (Short distance supersonic travel isn’t efficient because the plane would spend most of its time ascending and descending.)

Is it cost-effective? Musk estimates the tube would be “several billion dollars”, which he describes as low compared to the “tens of billion [sic] proposed for the track of the California rail project.” The individual capsules would be several hundred million dollars. Moreover, building a tube instead of a railway offers advantages, Musk says: it can be built on pylons (meaning you don’t need to buy the land), it’s less noisy, and there’s no need for fencing.

I want more information. Musk wrote a technical proposal that spans several dozens of pages, which you can check out here. He calls his system an open-source one and seems to be open to ideas to improve it.

Feel free to leave your feedback in the comments. Does this look feasible? Is there anything that could be added to make it a better system?

Carnival of Space #314

This week’s Carnival of Space is hosted by our pal Ray Sanders at his Dear Astronomer blog.

Click here to read Carnival of Space #314.

And if you’re interested in looking back, here’s an archive to all the past Carnivals of Space. If you’ve got a space-related blog, you should really join the carnival. Just email an entry to [email protected], and the next host will link to it. It will help get awareness out there about your writing, help you meet others in the space community – and community is what blogging is all about. And if you really want to help out, sign up to be a host. Send an email to the above address.

Is the Sun More Active Than it Looks? An Innovative Method to Characterize the Solar Cycle

A solar cycle montage from August 1991 to September 2001 in X-rays courtesy of the Yohkoh Solar Observatory. (Credit: David Chenette, Joseph B. Gurman, Loren W. Acton, image in the public Domain).

The Sun has provided no shortage of mysteries thus far during solar cycle #24.

And perhaps the biggest news story that the Sun has generated recently is what it isn’t doing. As Universe Today recently reported, this cycle has been an especially weak one in terms of performance. The magnetic polarity flip signifying the peak of the solar maximum is just now upon us, as the current solar cycle #24 got off to a late start after a profound minimum in 2009…

Or is it?

Exciting new research out of the University of Michigan in Ann Arbor’s Department of Atmospheric, Oceanic and Space Sciences published in The Astrophysical Journal this past week suggests that we’re only looking at a portion of the puzzle when it comes to solar cycle activity.

Traditional models rely on the monthly averaged sunspot number. This number correlates a statistical estimation of the number of sunspots seen on the Earthward facing side of the Sun and has been in use since first proposed by Rudolf Wolf in 1848. That’s why you also hear the relative sunspot number sometimes referred to as the Wolf or Zürich Number.

But sunspot numbers may only tell one side of the story. In their recent paper titled Two Novel Parameters to Evaluate the Global Complexity of the Sun’s Magnetic Field and Track the Solar Cycle, researchers Liang Zhao, Enrico Landi and Sarah E. Gibson describe a fresh approach to model solar activity via looking at the 3-D dynamics heliospheric current sheet.

The spiralling curve of the heliospheric current sheet through the inner solar system. (Graphic credit: NASA).
The spiraling curve of the heliospheric current sheet through the inner solar system. (Graphic credit: NASA).

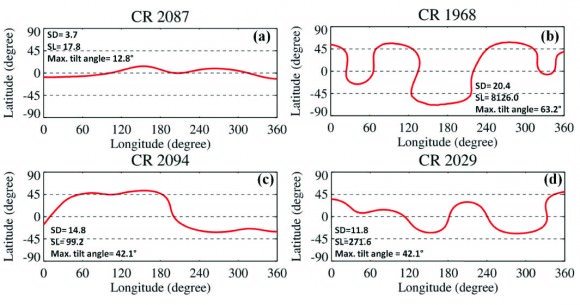
The heliospheric current sheet (or HCS) is the boundary of the Sun’s magnetic field separating the northern and southern polarity regions which extends out into the solar system. During the solar minimum, the sheet is almost flat and skirt-like. But during solar maximum, it’s tilted, wavy and complex.

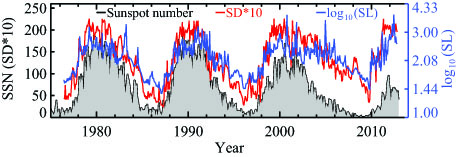
Two variables, known as SD & SL were used by researchers in the study to produce a measurement that can characterize the 3-D complexity of the HCS.  “SD is the standard deviation of the latitudes of the HCS’s position on each of the Carrington maps of the solar surface, which basically tells us how far away the HCS is distributed from the equator. And SL is the integral of the slope of HCS on that map, which can tell us how wavy the HCS is on each of the map,” Liang Zhao told Universe Today.

Ground and space-based observations of the Sun’s magnetic field exploit a phenomenon known as the Zeeman Effect, which was first demonstrated during solar observations conducted by George Ellery Hale using his new fangled invention of the spectrohelioscope in 1908. For the recent study, researchers used data covering a period from 1975 through 2013 to characterize the HCS data available online from the Wilcox Solar Observatory.

SD and SL perameters juxtaposed against the tradional monthly sunspot number.
SD and SL parameters juxtaposed against the traditional monthly sunspot number (SSN). Note the smooth fit until the end of solar cycle #23 around 2003. (Credit: Liang Zhao/The Astrophysical Journal).

Comparing the HCS value against previous sunspot cycles yields some intriguing results. In particular, comparing the SD and SL values with the monthly sunspot  number provide a “good fit” for the previous three solar cycles— right up until cycle #24.

“Looking at the HCS, we can see that the Sun began to act strange as early as 2003,” Zhao said. “This current cycle as characterized by the monthly sunspot number started a year late, but in terms of HCS values, the maximum of cycle #24 occurred right on time, with a first peak in late 2011.”

“Scientists believe there will be two peaks in the sunspot number in this solar maximum as in the previous maximum (in ~2000 and ~2002),” Zhao continued, “since the Sun’s magnetic fields in the north and south hemispheres look asymmetric, and the north evolved faster than the south recently. But so far as I can see, the highest value of monthly-averaged sunspot number in this cycle 24 is still the one in the November 2011. So we can say the first peak of cycle 24 could be in November of 2011, since it is the highest monthly sunspot number so far in this cycle. If there is a second peak, we will see it sooner or later.”

The paper also notes that although cycle 24 is especially weak when compared to recent cycles, its range of activity is not unique when compared with solar cycles over the past 260 years.

HCS curves plotted on the surface of the Sun.
HCS curves plotted on the surface of the Sun. Comparisons are made for the solar maximum on October 2000 (CR 1968), descending phase on April 2005 (2029), solar minimum on September 2009 (CR 2087), and ascending phase on March 2010 (CR2094). CR=Carrington Rotation. (Credit: Liang Zhao, The Astrophysical Journal).

The HCS value characterizes the Sun over one complete Carrington Rotation of 27 days. This is an averaged value for the rotation of the Sun, as the poles rotate slower than the equatorial regions.

The approximately 22 year span of time that it takes for the poles to reverse back to the same polarity again is equal to two average 11 year sunspot cycles. The Sun’s magnetic field has been exceptionally asymmetric during this cycle, and as of this writing, the Sun has already finished its reversal of the north pole first.

This sort of asymmetry during an imminent pole reversal was first recorded during solar cycle 19, which spanned 1954-1964. Solar cycles are numbered starting from observations which began in 1749, just four decades after the end of the 70-year Maunder Minimum.

“This is an exciting time to study the magnetic field of the Sun, as we may be witnessing a return to a less-active type of cycle, more like those of 100 years ago,” NCAR/HAO senior scientist and co-author Sarah Gibson said.

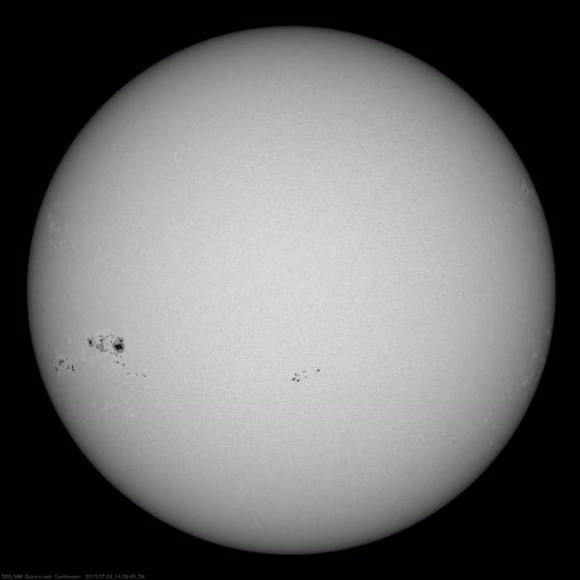
A massive sunspot group that rotated into view in early July, 2013... one of the largest seen for solar cycle #24 thus far. (Credit: NASA/SDO).
A massive sunspot group that rotated into view in early July, 2013, one of the largest seen for solar cycle #24 thus far. (Credit: NASA/SDO).

But this time, an armada of space and ground-based observatories will scrutinize our host star like never before. The SOlar Heliospheric Observatory (SOHO) has already followed the Sun through the equivalent of one complete solar cycle— and it has now been joined in space by STEREO A & B, JAXA’s Hinode, ESA’s Proba-2 and NASA’s Solar Dynamics Observatory. NASA’s Interface Region Imaging Spectrograph (IRIS) was also launched earlier this year and has just recently opened for business.

Will there be a second peak following the magnetic polarity reversal of the Sun’s south pole, or is Cycle #24 about to “leave the building?” And will Cycle #25 be absent all together, as some researchers suggest? What role does the solar cycle play in the complex climate change puzzle? These next few years will prove to be exciting ones for solar science, as the predictive significance of HCS SD & SL values are put to the test… and that’s what good science is all about!

-Read the abstract with a link to the full paper in The Astrophysical Journal by University of Michigan researchers here.