Curiosity Interview with Project Manager Jim Erickson – New Software Hastens Trek to Mount Sharp

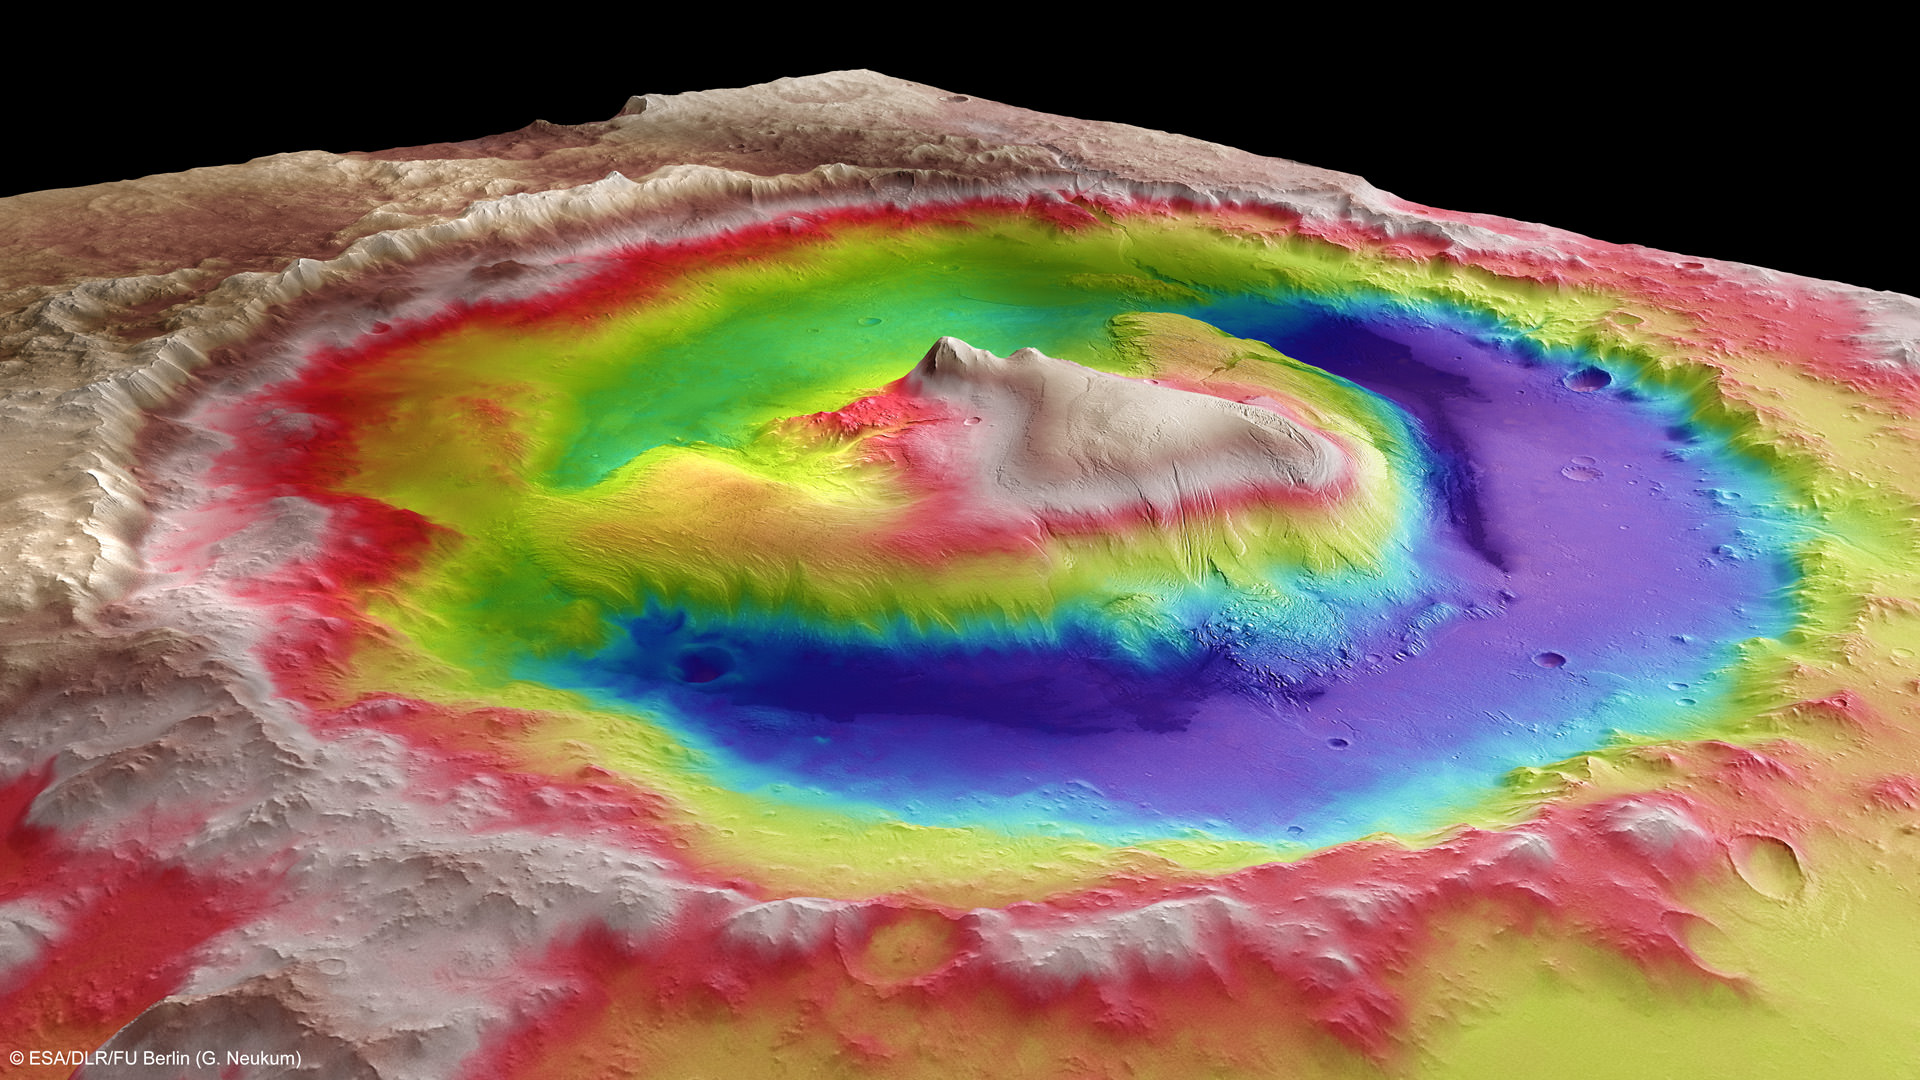
Mount Sharp inside Gale Crater - is the primary destination of NASA’s Curiosity rover mission to Mars. Curiosity landed on the right side of the mountain as shown here, near the dune field colored dark blue. Mount Sharp dominates Gale Crater. It is 3.4 mile (5.5 km) high. Gale Crater is 154 km wide. This image was taken by the High Resolution Stereo Camera (HRSC) of ESA’s Mars Express orbiter. Credit: ESA/DLR/FU Berlin (G. Neukum)

As NASA’s 1 ton Curiosity Mars rover sets out on her epic trek to the ancient sedimentary layers at the foothills of mysterious Mount Sharp, Universe Today conducted an exclusive interview with the Curiosity Project Manager Jim Erickson, of NASA’s Jet Propulsion Laboratory (JPL) to get the latest scoop so to speak on the robots otherworldly adventures.

The science and engineering teams are diligently working right now to hasten the rovers roughly year long journey to the 3.4 mile (5.5 km) high Martian mountain – which is the mission’s chief destination and holds caches of minerals that are key to sparking and sustaining life.

“We have departed Glenelg and the Shaler outcrop and started to Mount Sharp,” Erickson told me.

Overall the six wheeled rover just exceeded the 1 kilometer (0.62 mile) mark in roving across the Red Planet.

Mount Sharp lies about 5 miles (8 kilometers) distant – as the Martian crow flies.
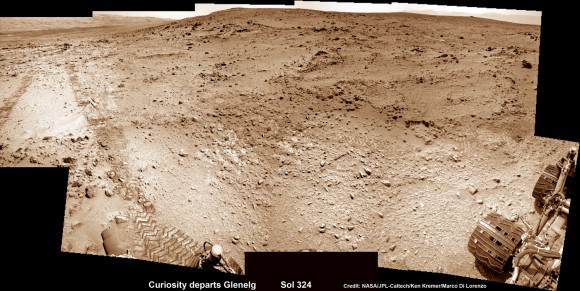
Curiosity Sets Sail for Mount Sharp  This photomosaic shows NASA’s Curiosity departing at last for Mount Sharp- her main science destination. Note the wheel tracks on the Red Planet’s surface. The navcam camera images were taken on July 4, 2013 (Sol 324). Credit: NASA/JPL-Caltech/Ken Kremer (kenkremer.com)/Marco Di Lorenzo
Curiosity Sets Sail for Mount Sharp
This photomosic shows NASA’s Curiosity departing at last for Mount Sharp- her main science destination. Note the wheel tracks on the Red Planet’s surface. The navcam camera images were taken on July 4, 2013 (Sol 324). Credit: NASA/JPL-Caltech/Ken Kremer (kenkremer.com)/Marco Di Lorenzo

Curiosity will have to traverse across potentially treacherous dune fields on the long road ahead to the layered mountain.

“Things are going very well and we have a couple of drives under our belt,” said Erickson.

Curiosity just completed more than half a year’s worth of bountiful science at Glenelg and Yellowknife Bay where she discovered a habitable environment on the Red Planet with the chemical ingredients that could sustain Martian microbes- thereby already accomplishing the primary goal of NASA’s flagship mission to Mars.

Curiosity’s handlers are upgrading the rovers ‘brain’ with new driving software, making her smarter, more productive and capable than ever before, and also far more independent since her breathtaking touchdown inside Gale Crater nearly a year ago on Aug. 6, 2012.

“We continue to drive regularly. The next drive is planned tomorrow and will be executed the following day.”

As of today (Sol 336, July 17), Curiosity has driven six times since leaving Glenelg on July 4 (Sol 324), totaling more than 180 meters.
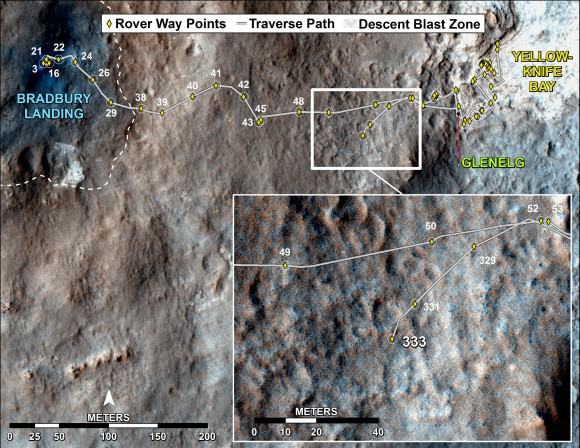
Curiosity's Traverse Map Through Sol 333 - This map shows the route driven by NASA's Mars rover Curiosity through Sol 333 of the rover's mission on Mars (July 14, 2013).  Numbering of the dots along the line indicate the sol number of each drive. North is up. The scale bar is 200 meters (656 feet). From Sol 331 to Sol 333, Curiosity had driven a straight line distance of about 45.05 feet (13.73 meters).  The base image from the map is from the High Resolution Imaging Science Experiment Camera (HiRISE) in NASA's Mars Reconnaissance Orbiter. Credit: NASA/JPL-Caltech/Univ. of Arizona
Curiosity’s Traverse Map Through Sol 333
This map shows the route driven by NASA’s Mars rover Curiosity through Sol 333 of the rover’s mission on Mars (July 14, 2013). Numbering of the dots along the line indicate the sol number of each drive. North is up. The scale bar is 200 meters (656 feet). From Sol 331 to Sol 333, Curiosity had driven a straight line distance of about 45.05 feet (13.73 meters). The base image from the map is from the High Resolution Imaging Science Experiment Camera (HiRISE) in NASA’s Mars Reconnaissance Orbiter. Credit: NASA/JPL-Caltech/Univ. of Arizona

Scientists specifically targeted Curiosity to Gale Crater and Mount Sharp because it is loaded with deposits of clay minerals that form in neutral water and that could possibly support the origin and evolution of simple Martian life forms, past or present.

Erickson has worked in key positions on many NASA planetary science missions dating back to Viking. These include the Galileo mission to Jupiter, both MER rovers Spirit & Opportunity, as well as a stint with the Mars Reconnaissance Orbiter (MRO).

Here is Part 1 of my wide ranging conversation with Jim Erickson, Curiosity Project Manager of JPL. Part 2 will follow.

I asked Erickson to describe the new driving software called autonomous navigation, or autonav, and how it will help speed Curiosity on her way. Until now, engineers on Earth did most of the planning for her.

Jim Erickson: We have put some new software – called autonav, or autonomous navigation – on the vehicle right after the conjunction period back in March 2013. This will increase our ability to drive.

The reason we put it on-board is that we knew it would be helpful when we started the long drive to Mount Sharp. And we are itching to check that out. Over the next few weeks we will be doing various tests with the autonav.

Ken Kremer: How will autonav help Curiosity?

Jim Erickson: The rover will have the ability to understand how far it’s driving, whether its slipping or not, and to improve safety.

And then the next step will be in effect to allow the rover to drive on its own.

Ken: How often will Curiosity drive?

Jim Erickson: Somewhere like every other day or so. We plan a drive, see how it goes and whether it went well and then we move further to the next drive. We are implementing that as it stands while we do the checkouts of autonav.

We might have to stop driving for part of the autonav checkout to complete the testing.

Basically we are limited mainly by the amount of days that we have successful completion of the previous day’s drive. And whether we have the information come back down [to Earth] so that we can plan the next day’s drive.

In some circumstances Mars time can rotate so that we don’t get the data back in time, so therefore we won’t be driving that day.

Ken: Can you ever drive two days in a row?

Jim Erickson: Yes we can, if the timing is right. If we get the results of the day’s drive (n) in time before we have to plan the next day’s drive (n+1) – almost as if you’re on Mars time. Then that would work fine.

Also, when we get the autonav capability we can plan two days in row. One day of directed driving and the second day can be ‘OK here’s your target from wherever you end up, try and go to this spot’.

This will increase the productivity!

Ken: When will autonav be up and running?

Jim Erickson: Something like two to three weeks. We need to thoroughly look at all the tests and validate them first so that we’re all comfortable with autonav.

Ken: What’s the Martian terrain on the floor of Gale crater like right now and for the next few miles?

Jim Erickson: It’s a mix of sand and different flagstone areas. As we get into it we’ll need to be able to drive comfortably on both. There aren’t too many large rocks that would be a problem right now. There is some shelf area that we’ll be going around.

Right now the area we’re in is actually a good thing to give us practice identifying obstacles and getting around them. This will help us later on when we see obstacles and want to be driving quicker.

Ken: What’s the overall plan now, a focus on driving or stopping and investigating?

Jim Erickson: – It’s not the intent to be stopping. This will be a good couple of weeks driving.

In Part 2 of my conversation with Jim Erickson we’ll discuss more about the rover’s traverse across alien territory that’s simultaneously a science gold mine and a potential death trap, as well as drilling and sampling activities, Comet ISON observations and upcoming science objectives.

Previous experience with rovers on Mars will be enormously helpful in studying how the rover interacts with dune fields. Autonav was first employed on the MER rovers.

The rover drivers and science team gained lots of experience and know how while driving both Spirit & Opportunity through numerous gigantic fields of dunes of highly varying composition and complexity.

Stay tuned for more from Mars.
Ken Kremer

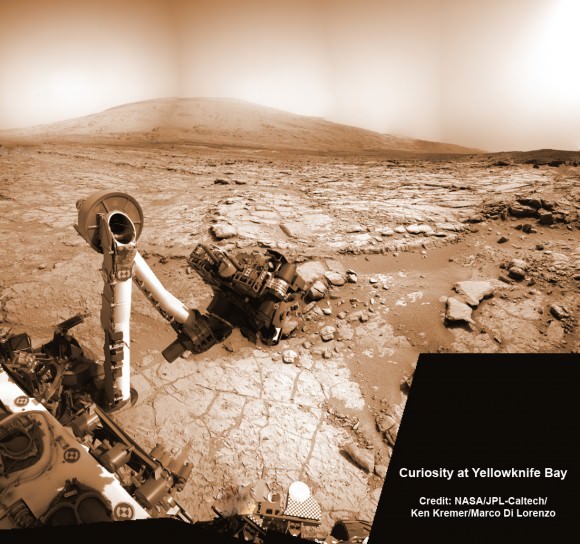
NASA’s Curiosity rover reaches out in ‘handshake’ like gesture with dramatic scenery of Mount Sharp in the background. This mosaic of images was snapped by Curiosity on Sol 262 (May 2, 2013) and shows her flexing the robotic arm. Two drill holes are visible on the surface bedrock below the robotic arm’s turret. Credit: NASA/JPL-Caltech/Ken Kremer-(kenkremer.com)/Marco Di Lorenzo
Curiosity Route Map From 'Glenelg' to Mount Sharp. This map shows where NASA's Mars rover Curiosity landed in August 2012 at "Bradbury Landing"; the area where the rover worked from November 2012 through May 2013 at and near the "John Klein" target rock in the "Glenelg" area; and the mission's next major destination, the entry point to the base of Mount Sharp.  Credit: NASA/JPL-Caltech/Univ. of Arizona
Curiosity Route Map From ‘Glenelg’ to Mount Sharp
This map shows where NASA’s Mars rover Curiosity landed in August 2012 at “Bradbury Landing”; the area where the rover worked from November 2012 through May 2013 at and near the “John Klein” target rock in the “Glenelg” area; and the mission’s next major destination, the entry point to the base of Mount Sharp. Credit: NASA/JPL-Caltech/Univ. of Arizona

Satellite View Shows Opportunity Mars Rover Still Hard at Work 10 Years On

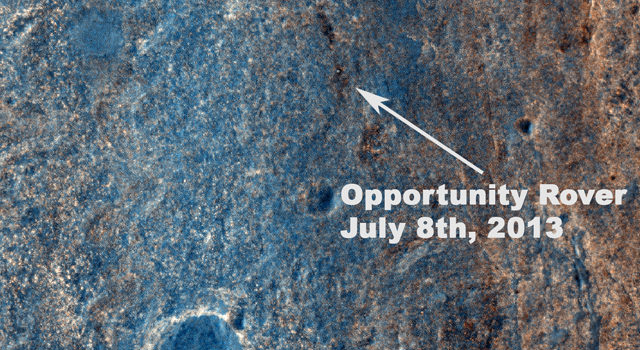
This image taken by the High Resolution Imaging Science Experiment (HiRISE) camera on NASA's Mars Reconnaissance Orbiter on July 8, 2013, captures Opportunity traversing south (at the end of the white arrow) to new science targets and a winter haven at "Solander Point," another portion of the Endeavour rim. The relatively level ground between Cape York and Solander Point is called "Botany Bay." The image was taken 10 years after Opportunity was launched from Florida on July 7, 2013, EDT and PDT (July 8, Universal Time). Image credit: NASA/JPL-Caltech/Univ. of Arizona.

Ten years to the day after the Opportunity rover launched to Mars, the HiRISE camera on the Mars Reconnaissance Orbiter snapped this image of the rover, still toiling away on the surface of Mars. The white dot in the image is Oppy, as the rover was crossing the level ground called “Botany Bay” on its way to a rise called “Solander Point.” We’re looking into whether there’s a way to determine if the rover was actually moving at the time the image was taken.

This, of course, is not the first time HiRISE has found the various rovers on Mars’ surface. Images from orbit help rover drivers find safe routes, as well as helping to identify enticing science targets for future investigation.

“The Opportunity team particularly appreciates the color image of Solander Point because it provides substantially more information on the terrains and traverse that Opportunity will be conducting over the next phase of our exploration of the rim of Endeavour crater,” said Mars Science Laboratory Project Scientist Matt Golombek, from JPL.

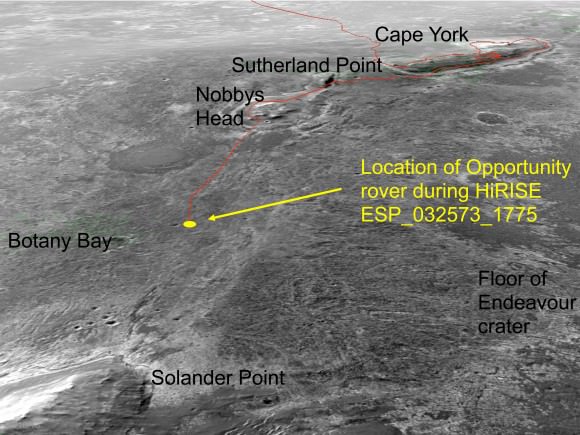
an oblique, northward-looking view based on stereo orbital imaging, shows the location of Opportunity on its journey from Cape York to Solander Point when HiRISE took the new color image. Endeavour Crater is about 14 miles (22 kilometers) in diameter. The distance from Cape York to Solander Point is about 1.2 miles (2 kilometers). The red line indicates the path the rover has driven. Credit:  NASA/JPL-Caltech/Univ. of Arizona.
an oblique, northward-looking view based on stereo orbital imaging, shows the location of Opportunity on its journey from Cape York to Solander Point when HiRISE took the new color image. Endeavour Crater is about 14 miles (22 kilometers) in diameter. The distance from Cape York to Solander Point is about 1.2 miles (2 kilometers). The red line indicates the path the rover has driven. Credit: NASA/JPL-Caltech/Univ. of Arizona.

Opportunity currently holds the US space program’s all-time record for distance traversed on another planetary body at greater than 36 kilometers or 22 miles. The Lunar Reconnaissance Orbiter team recently confirmed that the Lunokhod 2 rover traveled 42 km (26 miles) on the Moon.

Opportunity was launched from on July 7, 2003, PDT and EDT (July 8, Universal Time). Opportunity has been on the western rim of 20-kilometer-diameter Endeavour Crater in Meridiani Planum for about two years investigating the 3 to 4 billion-year-old sedimentary layers of Cape York. Now the rover is traversing south to new science targets and a winter haven at Solander Point.

Keep on truckin’!

See more details at JPL and HiRISE.

What’s the Best Design for a Flying Mars Robot?

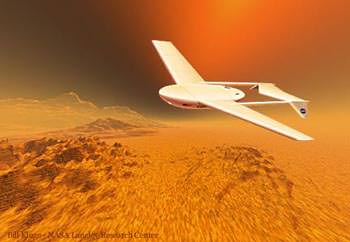
A concept for an airplane on Mars. Credit: MIT

Building a flying vehicle for Mars would have significant advantages for exploration of the surface. However, to date, all of our surface exploring vehicles and robotic units on Mars have been terrestrial rovers. The problem with flying on Mars is that the Red Planet doesn’t have much atmosphere to speak of. It is only 1.6% of Earth air density at sea level, give or take. This means conventional aircraft would have to fly very quickly on Mars to stay aloft. Your average Cessna would be in trouble.

But nature may provide an alternative way of looking at this problem.

The fluid regime of any flying (or swimming) animal, machine, etc. can be summarized by something called the Reynolds Number (Re). The Re is equal to the characteristic length x velocity x fluid density, divided by the dynamic viscosity. It is a measure of the ratio of inertial forces to viscous ones. Your average airplane flies at a high Re: lots of inertia relative to air stickiness. Because the Mars air density is low, the only way to get that inertia is to go really fast. However, not all flyers operate at high Re: most flying animals fly at much lower Re. Insects, in particular, operate at quite small Reynolds numbers (relatively speaking). In fact, some insects are so small that they swim through the air, rather than fly. So, if we scale up a bug-like critter or small bird just a bit, we might get something that can move in the Martian atmosphere without having to go insanely fast.

A potential design of an 'Entomopter' from Georgia Tech Research Institute
A potential design of an ‘Entomopter’ from Georgia Tech Research Institute
We need a system of equations to constrain our little bot. Turns out that’s not too tough. As a rough approximation, we can use Colin Pennycuick’s average flapping frequency equation. Based on the flapping frequency expectations from Pennycuick (2008), flapping frequency varies roughly as body mass to the 3/8 power, gravitational acceleration to the 1/2 power, span to the -23/24 power, wing area to the -1/3 power, and fluid density to the -3/8 power. That’s handy, because we can adjust to match Martian gravity and air density. But we need to know if we are shedding vortices from the wings in a reasonable way. Thankfully, there is a known relationship, there, as well: the Strouhal number. Str (in this case) is flapping amplitude x flapping frequency divided by velocity. In cruising flight, it turns out to be pretty constrained.

Our bot should, therefore, end up with a Str between 0.2 and 0.4, while matching the Pennycuick equation. And then, finally, we need to get a Reynolds number in the range for a large living flying insect (tiny insects fly in a strange regime where much of propulsion is drag-based, so we will ignore them for now). Hawkmoths are well studied, so we have their Re range for a variety of speeds. Depending on speed, it ranges from about 3,500 to about 15,000. So somewhere in that ballpark will do.

There are a few ways of solving the system. The elegant way is to generate the curves and look for the intersection points, but a fast and easy method is to punch it into a matrix program and solve iteratively. I won’t give all the possible options, but here’s one that worked out pretty well to give an idea:

Mass: 500 grams
Span: 1 meter
Wing Aspect Ratio: 8.0

This gives an Str of 0.31 (right on the money) and Re of 13,900 (decent) at a lift coefficient of 0.5 (which is reasonable for cruising). To give an idea, this bot would have roughly bird-like proportions (similar to a duck), albeit a bit on the light side (not tough with good synthetic materials). It would, however, flap through a greater arc at higher frequency than a bird here on Earth, so it would look a bit like a giant moth at distance to our Earth-trained eyes. As an added bonus, because this bot is flying in a moth-ish Reynolds Regime, it is plausible that it might be able to jump to the very high lift coefficients of insects for brief periods using unsteady dynamics. At a CL of 4.0 (which has been measured for small bats and flycatchers, as well as some large bees), the stall speed is only 19.24 m/s. Max CL is most useful for landing and launching. So: can we launch our bot at 19.24 m/s?

For fun, let’s assume our bird/bug bot also launches like an animal. Animals don’t take off like airplanes; they use a ballistic initiation by pushing from the substrate. Now, insects and birds use walking limbs for this, but bats (and probably pterosaurs) use the wings to double as pushing systems. If we made our bots wings push-worthy, then we can use the same motor to launch as to fly, and it turns out that not much push is required. Thanks to the low Mars gravity, even a little leap goes a long way, and the wings can already beat near 19.24 m/s as it is. So just a little hop will do it. If we’re feeling fancy, we can put a bit more punch on it, and that’ll get out of craters, etc. Either way, our bot only needs to be about 4% as efficient a leaper as good biological jumpers to make it up to speed.

These numbers, of course, are just a rough illustration. There are many reasons that space programs have not yet launched robots of this type. Problems with deployment, power supply, and maintenance would make these systems very challenging to use effectively, but it may not be altogether impossible. Perhaps someday our rovers will deploy duck-sized moth bots for better reconnaissance on other worlds.

Earth’s Gold Came From Colliding Stars

Collisions of neutron stars produce powerful gamma-ray bursts – and heavy elements like gold (Credit: Dana Berry, SkyWorks Digital, Inc.)

Are you wearing a gold ring? Or perhaps gold-plated earrings? Maybe you have some gold fillings in your teeth… for that matter, the human body itself naturally contains gold — 0.000014%, to be exact! But regardless of where and how much of the precious yellow metal you may have with you at this very moment, it all ultimately came from the same place.

And no, I don’t mean Fort Knox, the jewelry store, or even under the ground — all the gold on Earth likely originated from violent collisions between neutron stars, billions of years in the past.

Recent research by scientists at the Harvard-Smithsonian Center for Astrophysics (CfA) in Cambridge, Massachusetts has revealed that considerable amounts of gold — along with other heavy elements — are produced during impacts between neutron stars, the super-dense remains of stars originally 1.4 to 9 times the mass of our Sun.

The team’s investigation of a short-duration gamma-ray outburst that occurred in June (GRB 130603B) showed a surprising residual near-infrared glow, possibly from a cloud of material created during the stellar merger. This cloud is thought to contain a considerable amount of freshly-minted heavy elements, including gold.

“We estimate that the amount of gold produced and ejected during the merger of the two neutron stars may be as large as 10 moon masses – quite a lot of bling!” said lead author Edo Berger.

"With this remnant of a dead neutron star, I thee wed." (FreeDigitalPhotos.net/bigjom)
“With this remnant of a dead neutron star, I thee wed.” (FreeDigitalPhotos.net/bigjom)

The mass of the Moon is 7.347 x 10²² kg… about 1.2% the mass of Earth. The collision between these neutron stars then, 3.9 billion light-years away, produced 10 times that much gold based on the team’s estimates.

Quite a lot of bling, indeed.

Gamma-ray bursts come in two varieties – long and short – depending on the duration of the gamma-ray flash. GRB 130603B, detected by NASA’s Swift satellite on June 3rd, lasted for less than two-tenths of a second.

Although the gamma rays disappeared quickly, GRB 130603B also displayed a slowly fading glow dominated by infrared light. Its brightness and behavior didn’t match the typical “afterglow” created when a high-speed jet of particles slams into the surrounding environment.

Instead, the glow behaved like it came from exotic radioactive elements. The neutron-rich material ejected by colliding neutron stars can generate such elements, which then undergo radioactive decay, emitting a glow that’s dominated by infrared light – exactly what the team observed.

“We’ve been looking for a ‘smoking gun’ to link a short gamma-ray burst with a neutron star collision,” said Wen-fai Fong, a graduate student at CfA and a co-author of the paper. “The radioactive glow from GRB 130603B may be that smoking gun.”

The team calculates that about one-hundredth of a solar mass of material was ejected by the gamma-ray burst, some of which was gold. By combining the estimated gold produced by a single short GRB with the number of such explosions that have likely occurred over the entire age of the Universe, all the gold in the cosmos – and thus on Earth – may very well have come from such gamma-ray bursts.

Watch an animation of two colliding neutron stars along with the resulting GRB below (Credit: Dana Berry, SkyWorks Digital, Inc.):

How much gold is there on Earth, by the way? Since most of it lies deep inside Earth’s core and is thus unreachable, the total amount ever retrieved by humans over the course of history is surprisingly small: about 172,000 tonnes, or enough to make a cube 20.7 meters (68 feet) per side (based on the Thomson Reuters GFMS annual survey.) Some other estimates put this amount at slightly more or less, but the bottom line is that there really isn’t all that much gold available in Earth’s crust… which is partly what makes it (and other “precious” metals) so valuable.

And perhaps the knowledge that every single ounce of that gold was created by dead stars smashing together billions of years ago in some distant part of the Universe would add to that value.

“To paraphrase Carl Sagan, we are all star stuff, and our jewelry is colliding-star stuff,” Berger said.

The team’s findings were presented today in a press conference at the CfA in Cambridge. (See the paper here.)

Source: Harvard-Smithsonian CfA

Astrophoto: Beautiful View from the Top of Haleakala

The crescnet Moon and Venus are highlighted by crepuscular rays in this sunset view from on top of Haleakala, Maui in Hawaii. Credit and copyright: Henry Weiland.

As the Bad Astronomer has been known to say, “Holy Haleakala!” What an awesome view from the top of Haleakala, a massive shield volcano that forms more than 75% of the Hawaiian island of Maui. Astrophotographer Henry Weiland took this image on July 9, 2013 of his view from “on top of the world.” (He has a self portrait here.) He used a Canon EOS Rebel T3i with an 18-55mm lens.

We’re all jealous of your view, Henry!

Want to get your astrophoto featured on Universe Today? Join our Flickr group or send us your images by email (this means you’re giving us permission to post them). Please explain what’s in the picture, when you took it, the equipment you used, etc.

New SpaceX Rocket Booster Completes ‘Full Mission Duration’ Firing Test

The Falcon 9-R during a 10-second test in June 2013. Credit: Elon Musk on Twitter

A new booster forming the heart of a next-generation SpaceX Falcon 9 rocket underwent a three-minute test this week ahead of another of its type launching the Canadian Cassiope satellite this fall.

“Just completed full mission duration firing of next gen Falcon 9 booster,” wrote CEO Elon Musk on Twitter on Monday. “V[ery] proud of the boost stage team for overcoming many tough issues.”

SpaceX declined to elaborate on what the issues were in a statement to Space News, saying that the testing program is preliminary. (The company rarely comments on what goes on during tests.)

The firm has been steadily ramping up testing experience on the booster, as well as the Merlin-1D engine that powers it. In early June, it ran a brief 10-second test, then increased that to a 112-second test a week later. Check out the foom factor from that test below.

We’re still waiting for SpaceX to post pictures or video from the latest full mission test, but we’ll put them up if they become available.

SpaceX uses the same engines in the Grasshopper, a 10-story Vertical Takeoff Vertical Landing (VTVL) vehicle.

One of Grasshopper’s goals is to help SpaceX figure out how to bring a rocket back to Earth, ready to lift off again. A single Merlin 1D engine is enough to power Grasshopper. The new Falcon 9-R (R means “reusable”) requires nine.

Falcon 9-R is slated to loft Cassiope, a Canadian satellite that will observe space weather, in September.

Water-Trapped Worlds Possible Around Red Dwarf Stars?

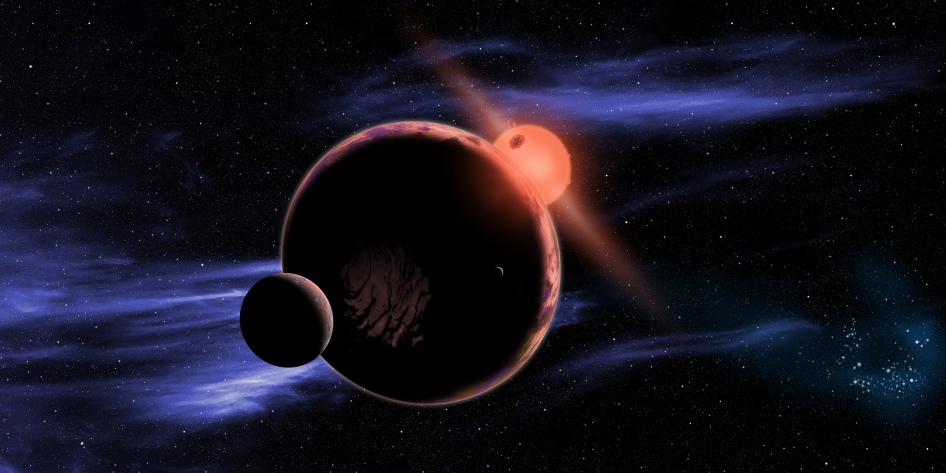
An artist's concept of a rocky world orbiting a red dwarf star. (Credit: NASA/D. Aguilar/Harvard-Smithsonian center for Astrophysics).

Hunters of alien life may have a new and unsuspected niche to scout out.

A recent paper submitted by Associate Professor of Astronomy at Columbia University Kristen Menou to the Astrophysical Journal suggests that tidally-locked planets in close orbits to M-class red dwarf stars may host a very unique hydrological cycle. And in some extreme cases, that cycle may cause a curious dichotomy, with ice collecting on the farside hemisphere of the world, leaving a parched sunward side. Life sprouting up in such conditions would be a challenge, experts say, but it is — enticingly — conceivable.

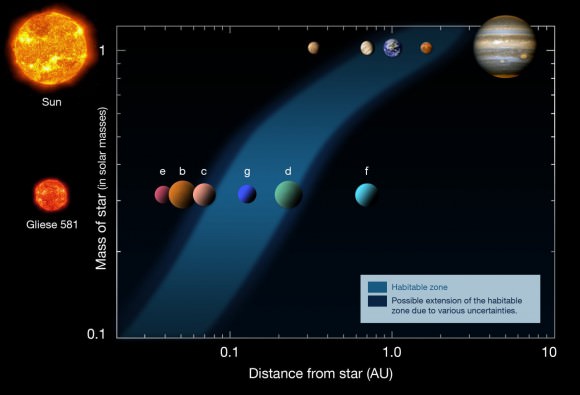
The possibility of life around red dwarf stars has tantalized researchers before. M-type dwarfs are only 0.075 to 0.6 times as massive as our Sun, and are much more common in the universe. The life span of these miserly stars can be measured in the trillions of years for the low end of the mass scale. For comparison, the Universe has only been around for 13.8 billion years. This is another plus in the game of giving biological life a chance to get underway. And while the habitable zone, or the “Goldilocks” region where water would remain liquid is closer in to a host star for a planet orbiting a red dwarf, it is also more extensive than what we inhabit in our own solar system.

Gliese 581- an example of a potential habitable zone around a red dwarf star contrasted with our own solar system. (Credit: ESO/Henrykus under a Wikimedia Creative Commons Attribution 3.0 Unported license).

But such a scenario isn’t without its drawbacks. Red dwarfs are turbulent stars, unleashing radiation storms that would render any nearby planets sterile for life as we know it.

But the model Professor Menou proposes paints a unique and compelling picture. While water on the permanent daytime side of a terrestrial-sized world tidally locked in orbit around an M-dwarf star would quickly evaporate, it would be transported by atmospheric convection and freeze out and accumulate on the permanent nighttime side. This ice would only slowly migrate back to the scorching daytime side and the process would continue.

Could these types of “water-locked worlds” be more common than our own?

The type of tidal locking referred to is the same as has occurred between the Earth and its Moon. The Moon keeps one face eternally turned towards the Earth, completing one revolution every 29.5 day synodic period. We also see this same phenomenon in the satellites for Jupiter and Saturn, and such behavior is most likely common in the realm of exoplanets closely orbiting their host stars.

The study used a dynamical model known as PlanetSimulator created at the University of Hamburg in Germany. The worlds modeled by the author suggest that planets with less than a quarter of the water present in the Earth’s oceans and subject to a similar insolation as Earth from its host star would eventually trap most of their water as ice on the planet’s night side.

Kepler data results suggest that planets in close orbits around M-dwarf stars may be relatively common. The author also notes that such an ice-trap on a water-deficient world orbiting an M-dwarf star would have a profound effect of the climate, dependent on the amount of volatiles available. This includes the possibility of impacts on the process of erosion, weathering, and CO2 cycling which are also crucial to life as we know it on Earth.

Thus far, there is yet to be a true “short list” of discovered exoplanets that may fit the bill. “Any planet in the habitable zone of an M-dwarf star is a potential water-trapped world, though probably not if we know the planet possesses a thick atmosphere.” Professor Menou told Universe Today. “But as more such planets are discovered, there should be many more potential candidates.”

Hard times in harsh climes-an artist's conception of the daytime side of a world orbiting a red dwarf star.
Hard times in harsh climes-an artist’s conception of the daytime side of a world orbiting a red dwarf star. (Credit: NASA/JPL-Caltech).

Being that red dwarf stars are relatively common, could this ice-trap scenario be widespread as well?

“In short, yes,” Professor Menou said to Universe Today. “It also depends on the frequency of planets around such stars (indications suggest it is high) and on the total amount of water at the surface of the planet, which some formation models suggest should indeed be small, which would make this scenario more likely/relevant. It could, in principle, be the norm rather than the exception, although it remains to be seen.”

Of course, life under such conditions would face the unique challenges. The daytime side of the world would be subject to the tempestuous whims of its red dwarf host sun in the form of frequent radiation storms. The cold nighttime side would offer some respite from this, but finding a reliable source of energy on the permanently shrouded night side of such as world would be difficult, perhaps relying on chemosynthesis instead of solar-powered photosynthesis.

On Earth, life situated near “black smokers” or volcanic vents deep on the ocean floor where the Sun never shines do just that. One could also perhaps imagine life that finds a niche in the twilight regions of such a world, feeding on the detritus that circulates by.

Some of the closest red dwarf stars to our own solar system include Promixa Centauri, Barnard’s Star and Luyten’s Flare Star. Barnard’s star has been the target of searches for exoplanets for over a century due to its high proper motion, which have so far turned up naught.

The closest M-dwarf star with exoplanets discovered thus far is Gliese 674, at 14.8 light years distant. The current tally of extrasolar worlds as per the Extrasolar Planet Encyclopedia stands at 919.

This hunt will also provide a challenge for TESS, the Transiting Exoplanet Survey Satellite and the successor to Kepler due to launch in 2017.

Searching for and identifying ice-trapped worlds may prove to be a challenge. Such planets would exhibit a contrast in albedo, or brightness from one hemisphere to the other, but we would always see the ice-covered nighttime side in darkness. Still, exoplanet-hunting scientists have been able to tease out an amazing amount of information from the data available before- perhaps we’ll soon know if such planetary oases exist far inside the “snowline” orbiting around red dwarf stars.

Read the paper on Water-Trapped Worlds at the following link.

Pulled Apart By Black Hole Heart

New observations from ESO’s Very Large Telescope show for the first time a gas cloud being ripped apart by the supermassive black hole at the centre of the galaxy. Shown here are VLT observations from 2006, 2010 and 2013, coloured blue, green and red respectively. Credit: ESO/S. Gillessen

If you thought all was reasonably quiet at the center of the Milky Way, you’d be wrong. Of course, you knew there was a black hole waiting… but did you know the ESO’s Very Large Telescope has seen a cloud of gas being ripped apart by its influence? Thanks to new observations, we’re able to see – in real time – a gaseous region so stretched that its leading edge has reached the event horizon and it’s retreating from the black hole at more than 10 million km/h while the trailing end is still falling inward!

Just two years ago, the VLT observed a gas cloud several times the mass of Earth making haste towards the Milky Way’s central black hole… an oblivion which dwarfs the cloud by about a trillion times. Right now the plucky cloud has reached its closest approach and “spaghettification” has began. The vaporous vagabond is being stretched out of proportion by the black hole’s gravitational field.

“The gas at the head of the cloud is now stretched over more than 160 billion kilometres around the closest point of the orbit to the black hole. And the closest approach is only a bit more than 25 billion kilometres from the black hole itself — barely escaping falling right in,” explains Stefan Gillessen (Max Planck Institute for Extraterrestrial Physics, Garching, Germany) who led the observing team. “The cloud is so stretched that the close approach is not a single event but rather a process that extends over a period of at least one year.”

At this point, the gas cloud is becoming so thin that its light is difficult to detect. However, by using the SINFONI instrument on the VLT, researchers took 20 hours of exposure time with the integral field spectrometer and were able to measure the velocity of various regions of the gas cloud as it blazes by the black hole.

“The most exciting thing we now see in the new observations is the head of the cloud coming back towards us at more than 10 million km/h along the orbit — about 1% of the speed of light,” adds Reinhard Genzel, leader of the research group that has been studied this region for nearly twenty years. “This means that the front end of the cloud has already made its closest approach to the black hole.”

Loading player…

Where the gas cloud originated is anyone’s guess – but there are suggestions. Possibilities include jets from the galactic center, or stellar winds from orbiting stars. There may have once been a star in the center of the cloud, and the gas may have been a product of its winds or even a protoplanetary disk. In any circumstance, these new observations help to sort out the variety of possibilities.

“Like an unfortunate astronaut in a science fiction film, we see that the cloud is now being stretched so much that it resembles spaghetti. This means that it probably doesn’t have a star in it,” concludes Gillessen. “At the moment we think that the gas probably came from the stars we see orbiting the black hole.”

It’s an exciting time to be an astronomer. Through the “eyes” of the VLT, researchers the world over are able to watch a very unique event as it happens and not after the fact. ” This intense observing campaign will provide a wealth of data, not only revealing more about the gas cloud, but also probing the regions close to the black hole that have not been previously studied and the effects of super-strong gravity.”

As this drama at the heart of the Milky Way unfolds, astronomers are able to witness its many changes – “from purely gravitational and tidal to complex, turbulent hydrodynamics.”

Original Story Source: ESO News Release.

Stars, Galaxies, and Comet ISON Grace a New Image from Hubble

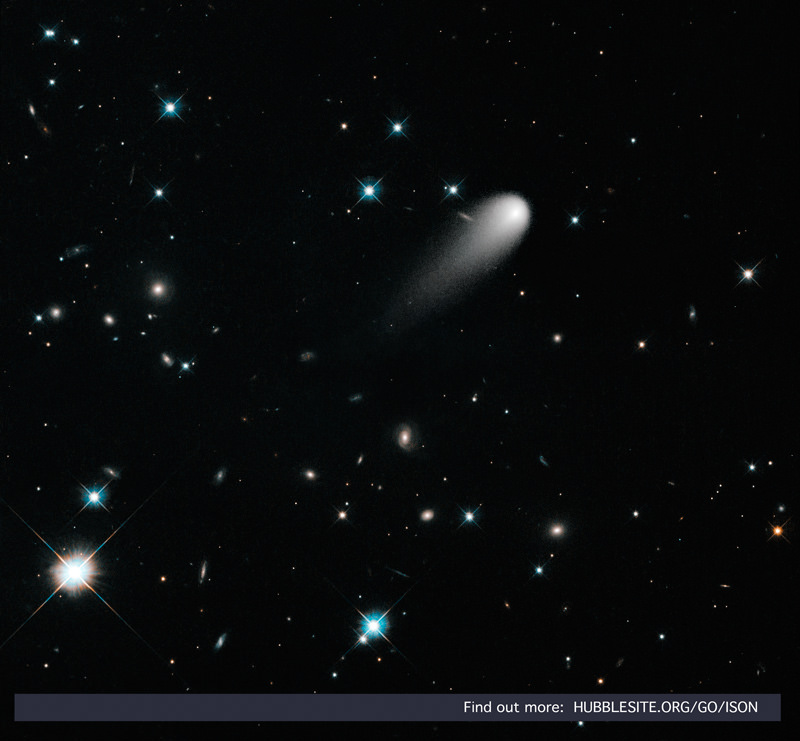
Comet ISON seen against a background of stars and galaxies (Source: /hubblesite.org)

This image of the steadily-approaching Comet ISON, made from observations with the Hubble Space Telescope on April 30, show not only the comet itself but also a rich background of stars located within our own galaxy and even the distant spirals of entire galaxies much, much farther away — as Josh Sokol describes it on HubbleSite.org’s ISONblog it’s like the astronomy stickers you’d get for your kid’s bedroom, except you’d never get to see such a scene in real life “unless, of course, you had Hubble.”

Comet C/2012 S1 (ISON) is currently on its way into the inner Solar System on course for a close encounter with the Sun, zooming along at 77,250 km/h (48,000 miles per hour). It will make its closest pass by the Sun on November 28 (coming within just .012 AU) and will hopefully put on a pretty spectacular show in the night sky —  especially if it survives the trip.

The track of Comet ISON through the constellations Gemini, Cancer and Leo prior to perihelion. (Credit: NASA/GSFC/Axel Mellinger).
Comet ISON’s projected path through the night sky prior to perihelion. (Credit: NASA/GSFC/Axel Mellinger)

Watch: Comet ISON Timelapse Hubble Movie

The image above was created from multiple Hubble observations earlier this year, some geared toward capturing ISON and others calibrated more for distant, dimmer objects like galaxies and far-flung stars. By combining the results we get a view of a comet speeding through space with an almost too-perfect hyperrealism, courtesy of NASA’s hardest-working space telescope.

“The result is part science, part art. It’s a simulation of what our eyes, with their ability to dynamically adjust to brighter and fainter objects, would see if we could look up at the heavens with the resolution of Hubble. The result is a hodepodge of almost all the meat-and-potatoes subjects of astronomy – no glow-in-the-dark stickers required.”

– Josh Sokol, HubbleSite ISONblog

Learn about other ways NASA will be observing Comet ISON here.

Source: HubbleSite.org

A Heat Wave So Big You Can See It From Space

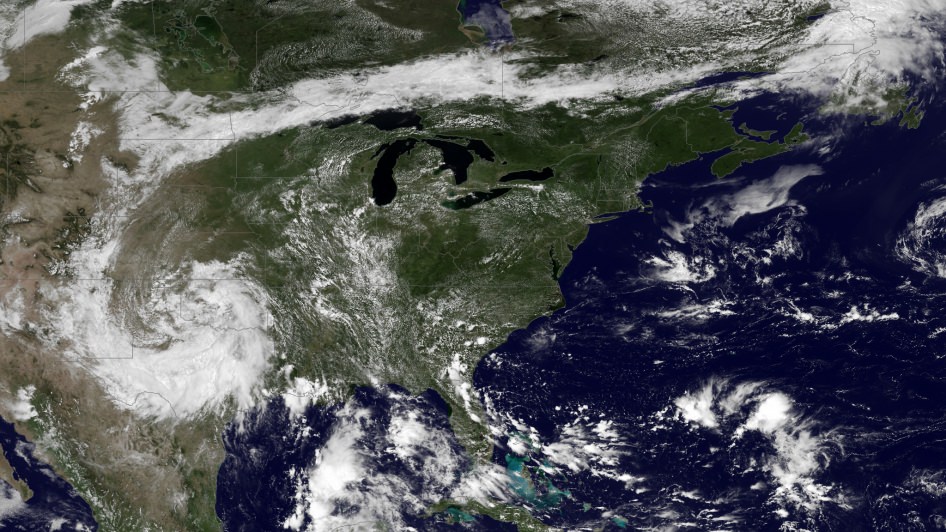
Image taken by NOAA's GOES East satellite at 12:45 p.m. EDT on July 15, 2013. (NOAA/NASA GOES Project)

Hot enough for ya? If you live anywhere on the eastern half of the United States (like me) you’ve probably been sweating it out over the past several days in what certainly feels like the warmest week yet for the season. The cause of the oppressive weather? A large mid-level ridge centered over the Ohio Valley — large enough to be easily visible from space.

The image above was taken by the GOES East satellite at 12:45 p.m. EDT on July 15. The clear area over Ohio shows the center of the system, which has been driving temperatures up into the 90s for much of the eastern U.S. and is expected to expand into the plains by mid-week. Along with increased humidity, heat index values will exceed 100 ºF and even approach 110 ºF on Friday.

From the NASA Image of the Day page:

A very anomalous weather pattern is in place over the U.S. for mid-July. Trapped between an upper level ridge centered over the Ohio Valley and the closed upper level low over the Texas/Oklahoma border, atypical hot, muggy air is stifling a broad swath of the eastern U.S. The closed low is expected to drift west toward New Mexico bringing heavy, localized rain to some areas and temperatures running 10-20 degrees below mid-July averages. Across the east, temperatures will warm well into the 90s and stay there through the week. (NOAA)

Rendering of a GOES satellite (NOAA)

As of the time of this writing heat advisories are in place in many parts of Michigan, southern Minnesota, and southern New England, and excessive heat warnings are active in eastern Pennsylvania and west central New Jersey. (Source)

Click here for summer heat safety tips.

Meanwhile, a closed low — seen above as a large, moisture-laden spiraling cloud system — is moving west across Texas and New Mexico, and is expected to bring lower-than-average temperatures along with heavy rains and flash flooding.

Keep up to date with weather alerts for your area at the NOAA’s National Weather Service site here, and see the latest GOES satellite images here.

Image Credit: NOAA/NASA GOES Project

At an altitude of 22,336 miles, the geosynchronous GOES satellites continuously provide observations of 60 percent of the Earth including the continental United States, providing weather monitoring and forecast operations as well as a continuous and reliable stream of environmental information and severe weather warnings.