Astronomers Refine Distances to our Closest Spiral-Galaxy Neighbors

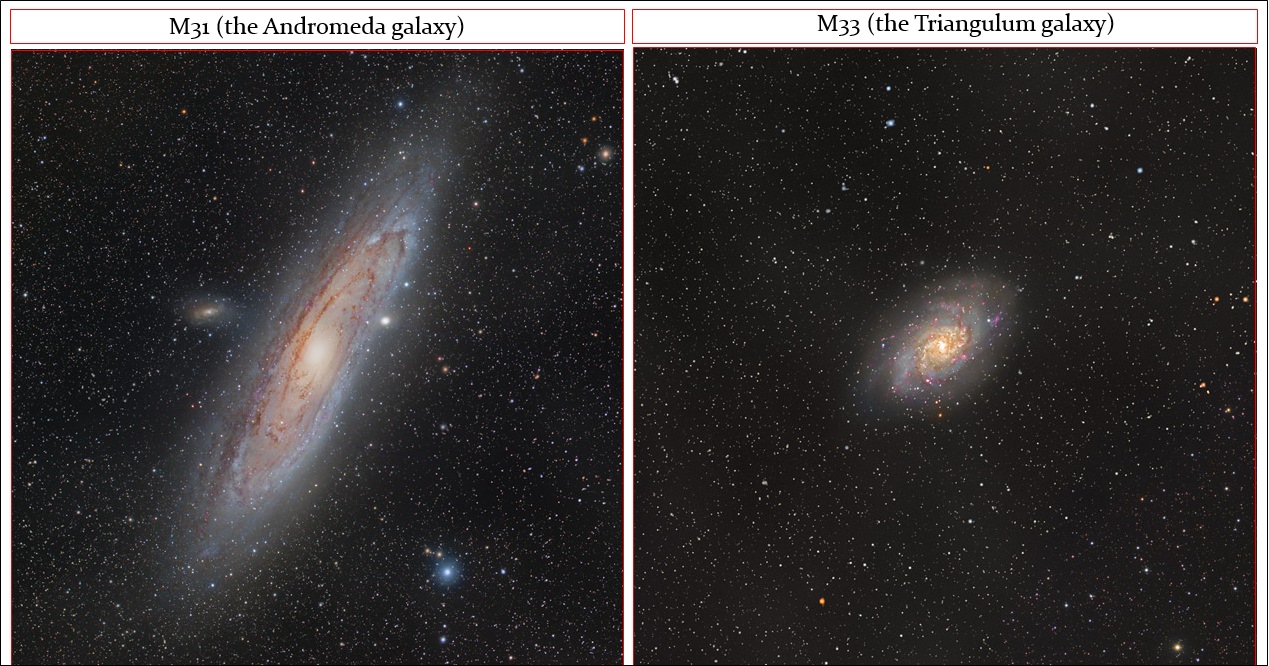
M31 and M33 are two of the nearest spiral galaxies, and can form the basis for determining distances to more remote spiral galaxies and constraining the expansion rate of the Universe (the Hubble constant).  Hence the relevance and importance of several new studies that employed near-infrared data to establish solid distances for M31 (Andromeda) and M33 (Triangulum) (e.g., Gieren et al. 2013), and aimed to reduce existing uncertainties tied to the fundamental parameters for those galaxies.  Indeed, reliable distances for M31 and M33 are particularly important in light of the new Hubble constant estimate from the Planck satellite, which is offset relative to certain other results, and that difference hinders efforts to ascertain the nature of dark energy (the mysterious force theorized as causing the Universe’s accelerated expansion).

Gieren et al. remarked that, “a number of new distance determinations to M33 … span a surprisingly large interval … which is a cause of serious concern. As the second-nearest spiral galaxy, an accurate determination of [M33’s] distance is a crucial step in the process of building the cosmic distance ladder.”  Concerning M31, Riess et al. 2012 likewise remarked that “M31, the nearest analogue of the Milky Way Galaxy, has long provided important clues to understanding the scale of the Universe.

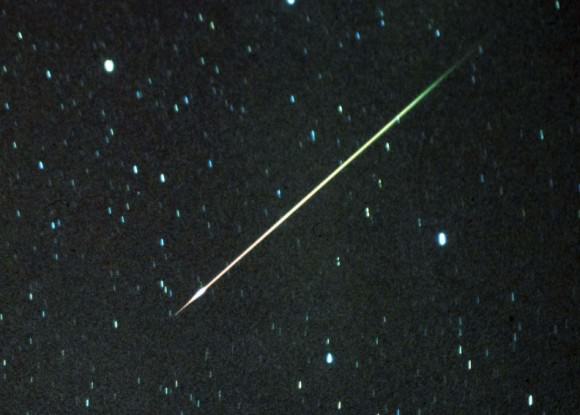
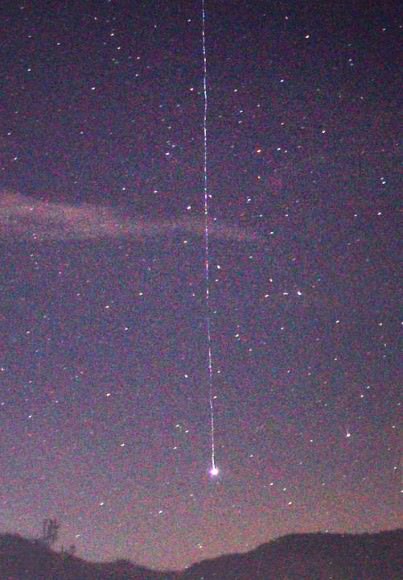
 The new Gieren and Riess et al. distances are based on near-infrared observations, which are pertinent because radiation from that part of the electromagnetic spectrum is less sensitive than optical data to absorption by dust located along our sight-line (see the figure below).  Properly accounting for the impact of dust is a principal problem in cosmic distance scale work, since it causes targets to appear dimmer.  “different assumptions about [dust obscuration] are a prime source for the discrepancies among the various distance determinations for M33.” noted Gieren et al., and the same is true for the distance to M31 (see Riess et al.).

Optical and near-infrared images highlight how dust obscures light emitted from a target along the line-of-sight.  The near-infrared observations are less sensitive to that obscuration (image credit: Alves et al. 2001).
Optical and near-infrared images highlight how dust obscures light emitted from targets along the sight-line, and that the level of obscuration is wavelength dependent. New distances established for M31 and M33 are based on near-infrared observations, which are less sensitive to that obscuration (image credit: Alves et al. 2001).

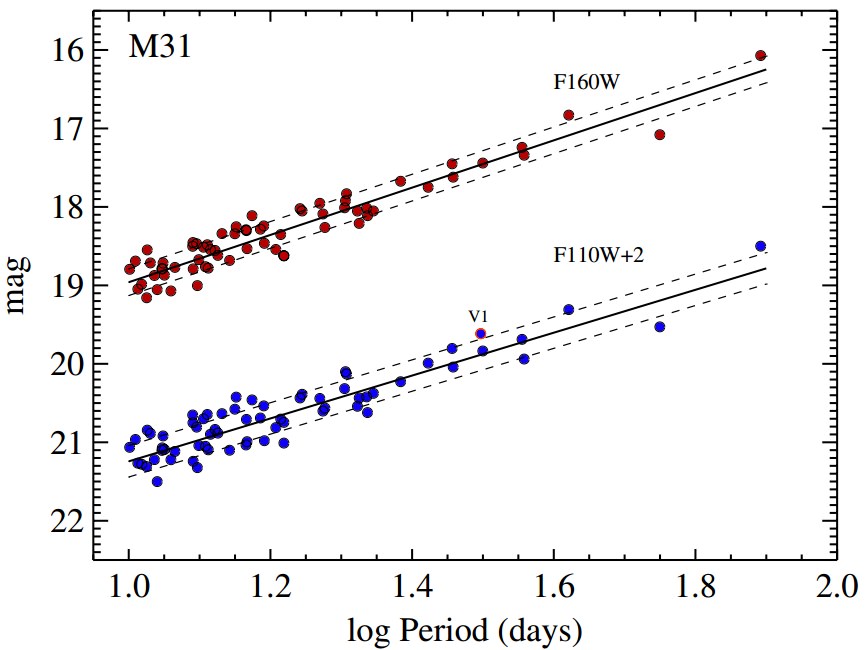
The Gieren and Riess et al. distances to M33 and M31, respectively, were inferred from observations of Cepheids.   Cepheids are a class of variable stars that exhibit periodic brightness variations (they pulsate radially).  Cepheids can be used as distance indicators because their pulsation period and mean luminosity are correlated.  That relationship was discovered by Henrietta Leavitt in the early 1900s.  A pseudo period-luminosity relation derived for M31 Cepheids is presented below.

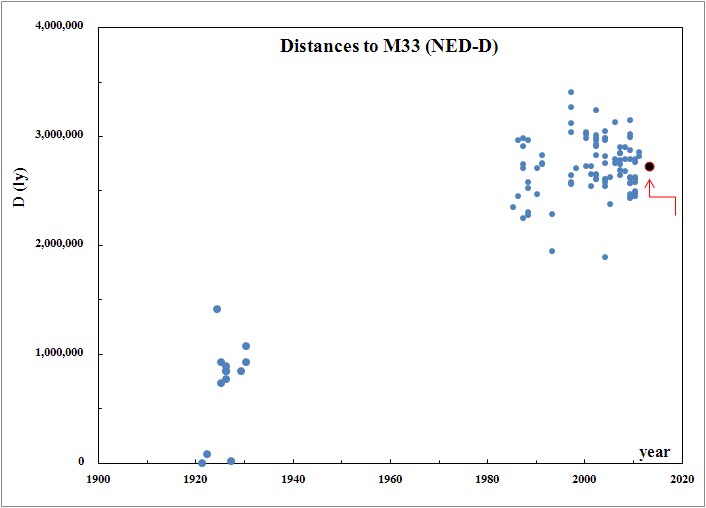
Gieren et al. observed 26 Cepheids in M33 and established a distance of ~2,740,000 lightyears.  The team added that, “As the first modern near-infrared Cepheid study [of] M33 since … some 30 years … we consider this work as long overdue …”  Astronomers often cite distances to objects in lightyears, which defines the time required for light emitted from the source to reach the observer. Despite the (finite) speed of light being 300,000,000 m/s, the rays must traverse “astronomical” distances.   Gazing into space affords one the unique opportunity to peer back in time.

A relation exists between a Cepheid's a periodic brightness variations and its luminosity.  Astronomers use that relation, which was discovered in the early 1900s by Henrietta Leavitt, to establish distances to galaxies.  In the above figure the horizontal axis features the pulsation period, and the vertical axis a proxy  for luminosity (image credit: Fig 2 in Riess et al., 2013 arXiv/ApJ).
A relation exists between a Cepheid’s periodic brightness variations and its mean luminosity. Astronomers use that trend, which was discovered in the early 1900s by Henrietta Leavitt, to establish distances to galaxies hosting Cepheids. In the above figure the horizontal axis features the pulsation period, and the vertical axis defines a proxy for luminosity (image credit: Fig 2 from Riess et al., arXiv/ApJ).

The distances to M33 shown below convey seminal points in the evolution of humanity’s knowledge.  The scatter near the 1920s stems partly from a debate concerning whether the Milky Way and the Universe are synonymous.  In other words, do galaxies exist beyond the Milky Way?  The topic is immortalized in the famed great debate (1920) featuring H. Shapley and H. Curtis (the latter argued for an extragalactic scale).  The offset between the pre-1930 and post-1980 data result in part from a nearly two-fold increase in the cosmic distance scale recognized circa 1950 (see also Feast 2000).   Also evident is the scatter associated with the post-1980 distances, which merely reinforces the importance of the new high-precision distance estimates.

Riess et al. obtained data for some 70 Cepheids and determined a distance for M31 of ~2,450,000 lightyears.  The latter is corroborated by a new study by Contreras Ramos et al. 2013 (d~2,540,000 ly), whose distance estimate relied on data for stars in a M31 globular cluster.

A subset of the distances estimated for M33, as compiled from estimates featured in the NASA/IPAC Extragalactic Database (Steer & Madore). On the vertical axis is the distance to the galaxy in units of lightyears, and  the year is cited on the horizontal axis.  The red arrow and black datum indicate the new near-infrared based distance from Gieren et al. 2013 (image credit: DM).
A subset of the distances deduced for M33, as compiled from estimates featured in the NASA/IPAC Extragalactic Database (Steer & Madore). On the vertical axis is the distance to the galaxy in units of lightyears, and the year is cited on the horizontal axis.  The red arrow and black datum indicate the new near-infrared based distance from Gieren et al. (image credit: DM).

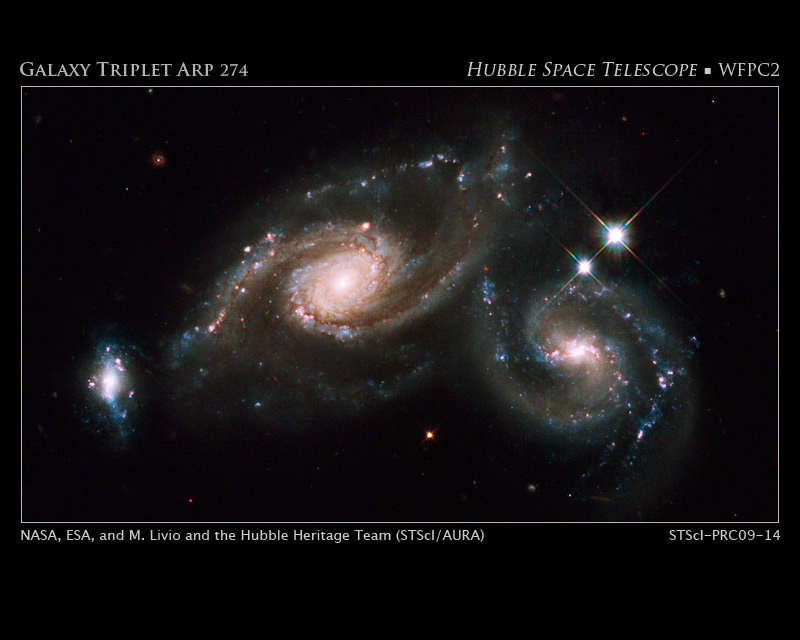
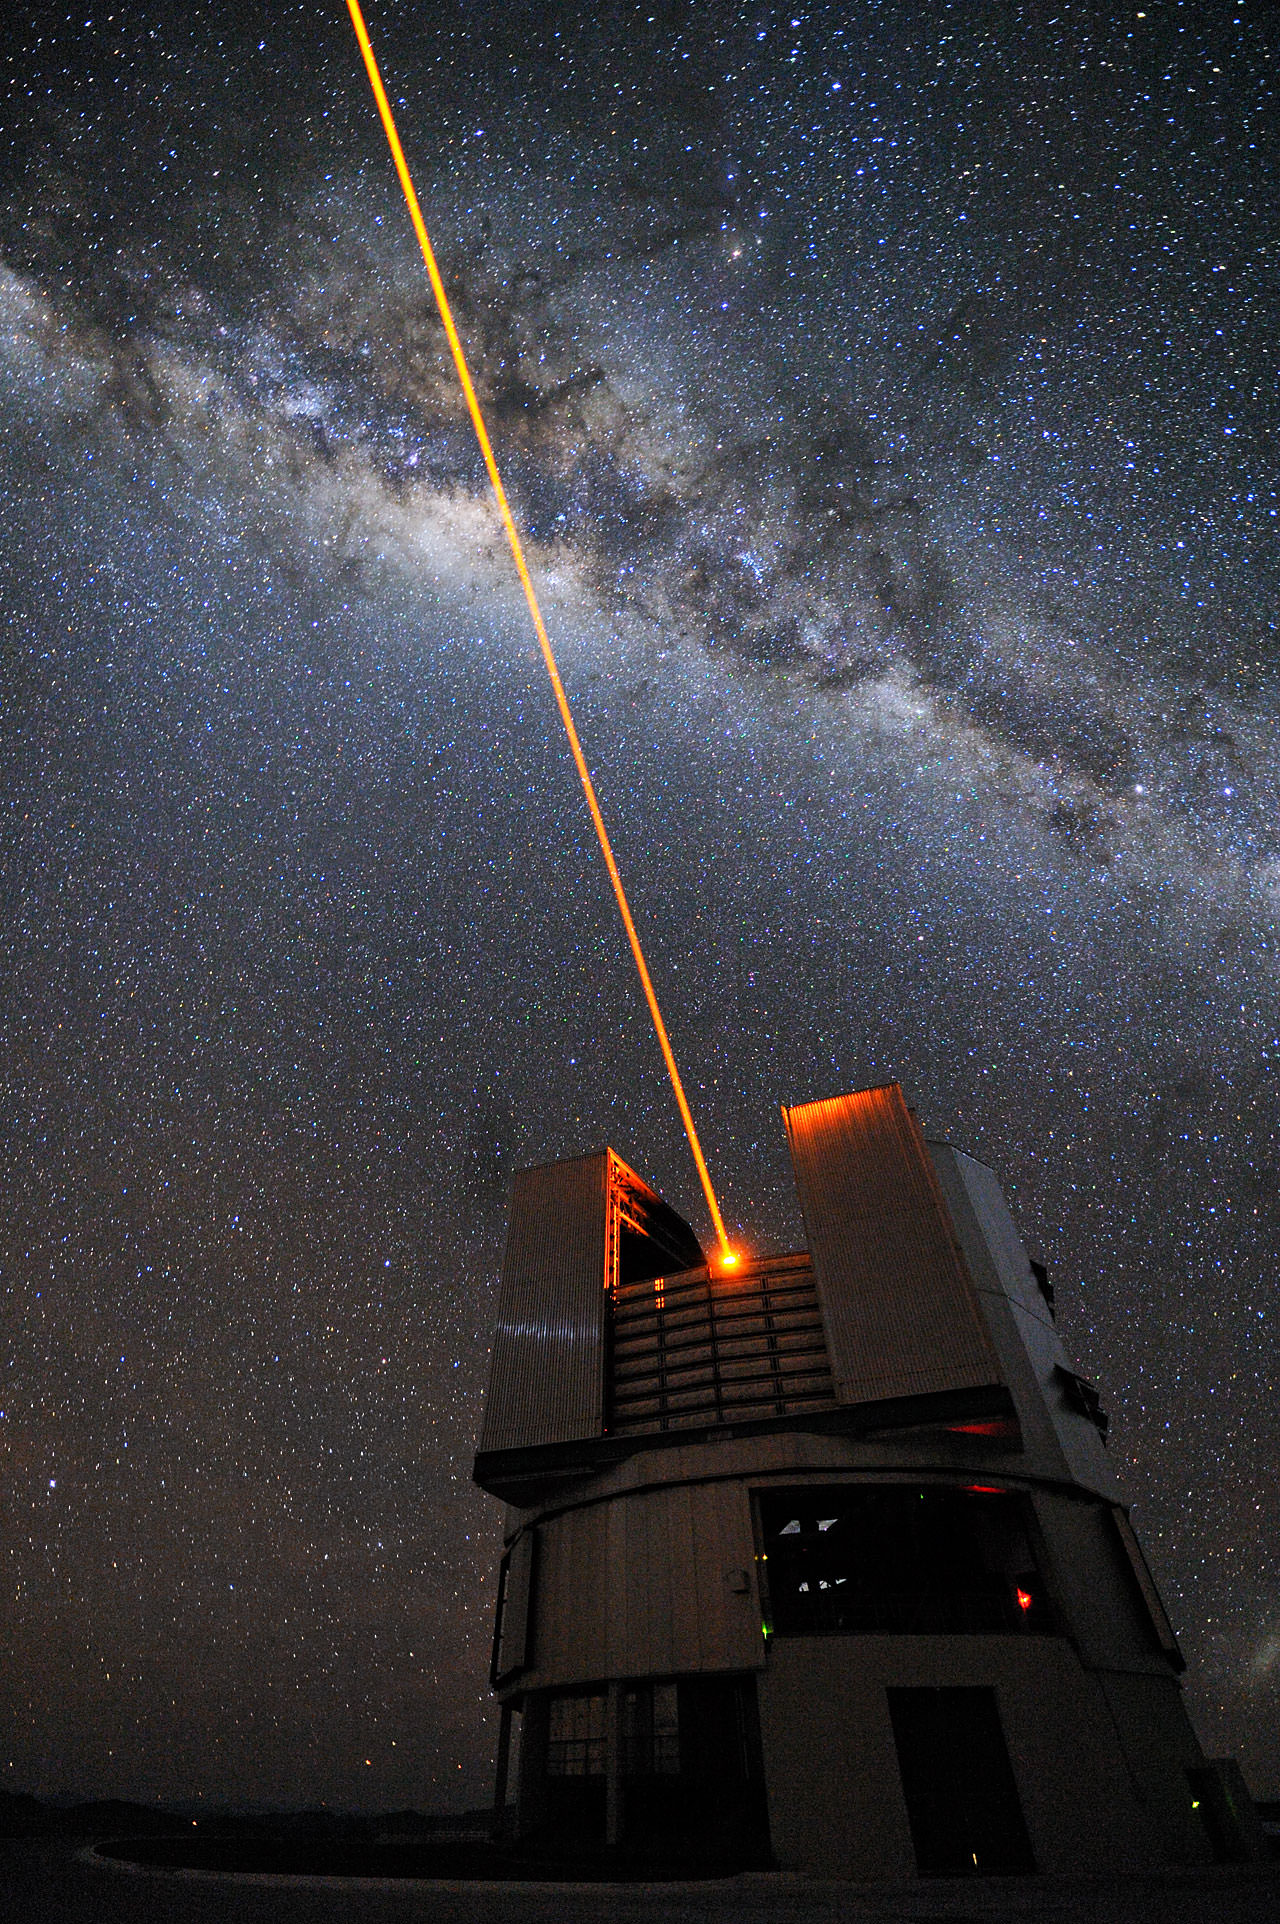
Top-class instruments and telescopes are needed to obtain reliable measurements of stars in galaxies nearly 3,000,000 million lightyears away.  Gieren et al. utilized the 8.2-m Very Large Telescope (Yepun) instrument shown below, while Riess and Contreras Ramos et al. analyzed observations from the Hubble Space Telescope.  Riess et al. acquired images of M31 via the new Wide-field Camera 3, which replaced the Wide-field and Planetary Camera 2 (“The Camera That Saved Hubble“) during the famed 2009 servicing mission.

The new results mark the culmination of a century’s worth of effort aimed at securing precise distances for our Galaxy’s local spiral kin (M31 and M33).  However, the offset between the Planck and certain Cepheid/SN-based determinations of the Hubble constant demands that research continue in order to identify uncertainties associated with the methods.

Gieren et al. used the 8.2-m Very Large Telescope (Yepun) to image M33, and deduce the distance to that galaxy (image credit: ESO).
Gieren et al. used the 8.2-m Very Large Telescope (Yepun) to image stars in M33, and deduce the distance to that galaxy (image credit: G. Hüdepohl/ESO).

The Gieren et al. findings have been accepted for publication in the Astrophysical Journal (ApJ), and a preprint is available on arXiv.   Both the Riess and Contreras Ramos et al. studies are likewise published in ApJ.  The interested reader desiring additional information on the cosmic distance scale and Cepheids will find the following resources pertinent: the AAVSO’s article on Delta Cephei (the namesake for the class of Cepheid variables), Freedman & Madore (2010)Tammann & Reindl 2012, Fernie 1969, the NASA/IPAC Extragalactic Database, G. Johnson’s Miss Leavitt’s Stars: The Untold Story of the Woman Who Discovered How to Measure the Universe, D. Fernie’s Setting Sail for the Universe: Astronomers and their Discoveries, Nick Allen’s The Cepheid Distance Scale: A History, D. Turner’s Classical Cepheids After 228 Years of Study, J. Percy’s Understanding Variable Stars.

Carnival of Space #305

This week’s Carnival of Space is hosted by Peter Lake at the AartScope blog.

Click here to read Carnival of Space #305.

And if you’re interested in looking back, here’s an archive to all the past Carnivals of Space. If you’ve got a space-related blog, you should really join the carnival. Just email an entry to [email protected], and the next host will link to it. It will help get awareness out there about your writing, help you meet others in the space community – and community is what blogging is all about. And if you really want to help out, sign up to be a host. Send an email to the above address.

Amazing Astrophoto: The North American Nebula by Mick Hyde

Here’s a truly gorgeous image by astrophotographer Mick Hyde, a mosaic of NGC 7000 (the North American nebula) and the Pelican nebula (IC 5070).

The structure on the upper left side is the North American nebula, with the darkest lobe of dust near the center forming the “Gulf of Mexico.” The star-forming region is located approximately 1,600 light years away in the constellation of Cygnus the Swan.

On the upper right is another celestial water bird, the Pelican nebula, a bright curve of ionized gas suggesting the shape of a pelican’s head and neck.

Check out a wider view of this region here, and see this and more of Mick’s work on his Flickr page here.

Image © Mick Hyde. Used with permission.

10 Years & Top 10 Discoveries from Marvelous Mars Express

Mars Express over water-ice crater. ESA Celebrates 10 Years since the launch of Mars Express. This artists concept shows Mars Express set against a 35 km-wide crater in the Vastitas Borealis region of Mars at approximately 70.5°N / 103°E. The crater contains a permanent patch of water-ice that likely sits upon a dune field – some of the dunes are exposed towards the top left in this image. Copyright ESA/DLR/FU-Berlin-G.Neukum

This week marks the 10th anniversary since the launch of the European Space Agencies’ (ESA) Mars Express orbiter from the Baikonur Cosmodrome in Russia on June 2, 2003 and a decade of ground breaking science discoveries at the Red Planet.

2003 was a great year for Mars exploration as it also saw the dual liftoffs of NASA’s now legendary rovers Spirit & Opportunity from Cape Canaveral in Florida.

The immense quantity and quality of science data returned from Mars Express -simultaneously with Spirit and Opportunity – has completely transformed our understanding of the history and evolution of the Red Planet.

All three spacecraft have functioned far beyond their original design lifetime.

Earth’s exploration fleet of orbiters, landers and rovers have fed insights to each other that vastly multiplied the science output compared to working solo during thousands and thousands of bonus Sols at Mars.

Inside a central pit crater.  Perspective view of a 50 km diameter crater in Thaumasia Planum. The image was made by combining data from the High-Resolution Stereo Camera on ESA’s Mars Express with digital terrain models. The image was taken on 4 January 2013, during orbit 11467, and shows a close up view of the central ‘pit’ of this crater, which likely formed by a subsurface explosion as the heat from the impact event rapidly vapourised water or ice lying below the surface. Copyright ESA/DLR/FU-Berlin-G.Neukum
Inside a central pit crater. Perspective view of a 50 km diameter crater in Thaumasia Planum. The image was made by combining data from the High-Resolution Stereo Camera on ESA’s Mars Express with digital terrain models. The image was taken on 4 January 2013, during orbit 11467, and shows a close up view of the central ‘pit’ of this crater, which likely formed by a subsurface explosion as the heat from the impact event rapidly vapourised water or ice lying below the surface. Copyright ESA/DLR/FU-Berlin-G.Neukum

Mars Express derived its name from an innovative new way of working in planetary space science that sped up the development time and cut costs in the complex interactive relationships between the industrial partners, space agencies and scientists.

Indeed the lessons learned from building and operating Mars Express spawned a sister ship, Venus Express that also still operates in Venusian orbit.

Mars Express (MEX) achieved orbit in December 2003.

MEX began science operations in early 2004 with an array of seven instruments designed to study all aspects of the Red Planet, including its atmosphere and climate, and the mineralogy and geology of the surface and subsurface with high resolution cameras, spectrometers and radar.

The mission has been granted 5 mission extensions that will carry it to at least 2014.

The mission has been wildly successful except for the piggybacked lander known as Beagle 2, which was British built.

Beagle 2
Beagle 2
The ambitious British lander was released from the mothership on December 19, 2003, six days before MEX braked into orbit around Mars. Unfortunately the Beagle 2 was never heard from again as it plummeted to the surface and likely crashed.

The high resolution camera (HRSC) has transmitted thousands of dramatic 3D images all over Mars ranging from immense volcanoes, steep-walled canyons, dry river valleys, ancient impact craters of all sizes and shapes and the ever-changing polar ice caps.

It carried the first ever radar sounder (MARSIS) to orbit another planet and has discovered vast caches of subsurface water ice.

MEX also played a significant role as a data relay satellite for transmissions during the landings of NASA’s Phoenix lander and Curiosity rover. It also occasionally relays measurements from Spirit & Opportunity to NASA.

Arima twins topography. This colour-coded overhead view is based on an ESA Mars Express High-Resolution Stereo Camera digital terrain model of the Thaumasia Planum region on Mars at approximately 17°S / 296°E. The image was taken during orbit 11467 on 4 January 2013. The colour coding reveals the relative depth of the craters, in particular the depths of their central pits, with the left-hand crater penetrating deeper than the right (Arima crater).  Copyright: ESA/DLR/FU-Berlin-G.Neukum
Arima twins topography. This colour-coded overhead view is based on an ESA Mars Express High-Resolution Stereo Camera digital terrain model of the Thaumasia Planum region on Mars at approximately 17°S / 296°E. The image was taken during orbit 11467 on 4 January 2013. The colour coding reveals the relative depth of the craters, in particular the depths of their central pits, with the left-hand crater penetrating deeper than the right (Arima crater). Copyright: ESA/DLR/FU-Berlin-G.Neukum

Here is a list of the Top 10 Discoveries from Mars Express from 2003 to 2013:

Mars Express mineralogy maps. This series of five maps shows near-global coverage of key minerals that help plot the history of Mars. The map of hydrated minerals indicates individual sites where a range of minerals that form only in the presence of water were detected. The maps of olivine and pyroxene tell the story of volcanism and the evolution of the planet’s interior. Ferric oxides, a mineral phase of iron, are present everywhere on the planet: within the bulk crust, lava outflows and the dust oxidised by chemical reactions with the martian atmosphere, causing the surface to ‘rust’ slowly over billions of years, giving Mars its distinctive red hue. Copyright:  ESA/CNES/CNRS/IAS/Université Paris-Sud, Orsay; NASA/JPL/JHUAPL; Background images: NASA MOLA
Mars Express mineralogy maps. This series of five maps shows near-global coverage of key minerals that help plot the history of Mars. The map of hydrated minerals indicates individual sites where a range of minerals that form only in the presence of water were detected. The maps of olivine and pyroxene tell the story of volcanism and the evolution of the planet’s interior. Ferric oxides, a mineral phase of iron, are present everywhere on the planet: within the bulk crust, lava outflows and the dust oxidised by chemical reactions with the martian atmosphere, causing the surface to ‘rust’ slowly over billions of years, giving Mars its distinctive red hue. Copyright: ESA/CNES/CNRS/IAS/Université Paris-Sud, Orsay; NASA/JPL/JHUAPL; Background images: NASA MOLA
#1. First detection of hydrated minerals in the form of phyllosilicates and hydrated sulfates – evidence of long periods of flowing liquid water from the OMEGA visible and infrared spectrometer provided confirmation that Mars was once much wetter than it is today and may have been favorable for life to evolve.

#2. Possible detection of methane in the atmosphere from the Planetary Fourier Spectrometer (PFS) which could originate from biological or geological activity.

#3. Identification of recent glacial landforms via images from the High Resolution Stereo Camera (HRSC) are stem from viscous flow features composed of ice-rich material derived from adjacent highlands.

#4. Probing the polar regions. OMEGA and MARSIS determined that the south pole consists of a mixture frozen water ice and carbon dioxide. If all the polar ice melted the planet would be covered by an ocean 11 meters deep.

#5. Recent and episodic volcanism perhaps as recently as 2 million years ago. Mars has the largest volcanoes in the solar system . They are a major factor in the evolution of the martian surface, atmosphere and climate.

#6. Estimation of the current rate of atmospheric escape, helps researchers explain how Mars changed from a warm, wet place to the cold, dry place it is today.

#7. Discovery of localised aurora on Mars

#8. A new, meteoric layer in the martian ionosphere created by fast-moving cosmic dust which burns up as it hits the atmosphere.

#9. Unambiguous detection of carbon dioxide clouds. The freezing and vaporisation of CO2 is one of the main climatic cycles of Mars, and it controls the seasonal variations in surface air pressure.

#10. Unprecedented probing of the Martian moon Phobos – which could be a target for future landers and human missions.

The Mars-facing side of Phobos. Credit: ESA/DLR/FU Berlin (G. Neukum)

And don’t forget to “Send Your Name to Mars” aboard NASA’s MAVEN orbiter- details here. Deadline: July 1, 2013

Ken Kremer

…………….
Learn more about Conjunctions, Mars, Curiosity, Opportunity, MAVEN, LADEE, CIBER and NASA missions at Ken’s upcoming lecture presentations

June 11: “Send your Name to Mars on MAVEN” and “LADEE Lunar & Antares Rocket Launches from Virginia”; NJ State Museum Planetarium and Amateur Astronomers Association of Princeton (AAAP), Trenton, NJ, 730 PM.

June 12: “Send your Name to Mars on MAVEN” and “LADEE Lunar & Antares Rocket Launches from Virginia”; Franklin Institute and Rittenhouse Astronomical Society, Philadelphia, PA, 8 PM.

June 23: “Send your Name to Mars on MAVEN” and “CIBER Astro Sat, LADEE Lunar & Antares Rocket Launches from Virginia”; Rodeway Inn, Chincoteague, VA, 8 PM

How a Hubble Image Goes from Photons to Finished Beauty

Arp 274 is a trio of galaxies. They appear to be partially overlapping in this image, but may be located at different distances. Credit: NASA, ESA, M. Livio and the Hubble Heritage Team (STScI/AURA)

How does raw data from the Hubble Space Telescope end up to become a finished gorgeous color image, like the one of Arp 274, above? It’s an interesting process, because the cameras on Hubble do not take color pictures.

The Hubble team released a video today showing the process of creating an image of Arp 274:

Color images from the spacecraft are assembled from separate black & white images taken through color filters. For one image, the spacecraft has to take three pictures, usually through a red, a green, and a blue filter and then each of those photos gets downlinked to Earth. They are then combined with software into a color image. This happens automatically inside off-the-shelf color cameras that we use here on Earth. But Hubble has almost 40 color filters ranging from ultraviolet (“bluer” than our eyes can see,) through the visible spectrum, to infrared (“redder” than what is visible to humans.) This gives the imaging teams infinitely more flexibility, allowing them to eke out whatever science information they are looking for, as well as, sometimes, allowing them to take a little artistic license.

You can read our previous article about “true and false color” and the art of extraterrestrial photography.

What Does Antarctica Look Like Under the Ice?

New topography map of Antarctica by the British Antarctic Survey's Bedmap2 (NASA/GSFC)

Although it sits isolated at the “bottom of the world” Antarctica is one of the most influential continents on Earth, affecting weather, climate, and ocean current patterns over the entire planet. But Antarctica is also one of the most enigmatic landmasses too, incredibly remote, extremely harsh, and covered by a layer of ice over 2 km thick. And as Earth’s global temperature continues to climb steadily higher, the future of ice in Antarctica — a continent half again as large as the contiguous United States — is a big concern for scientists… but in order to know exactly how its ice will behave to changing conditions, they need to know what’s under it.

This is where the British Antarctic Survey — using data gathered by NASA’s ICESat and Operation IceBridge missions — comes in, giving us a better view of what lies beneath the southern continent’s frozen veil.

A new dataset called Bedmap2 gives a clearer picture of Antarctica from the ice surface down to the bedrock below. Bedmap2 is a significant improvement on the previous collection of Antarctic data — known as Bedmap — that was produced more than 10 years ago. The product was a result of work led by the British Antarctic Survey, where researchers compiled decades worth of geophysical measurements, such as surface elevation measurements from NASA’s Ice, Cloud and Land Elevation Satellite (ICESat) and ice thickness data collected by Operation IceBridge.

Bedmap2, like the original Bedmap, is a collection of three datasets—surface elevation, ice thickness and bedrock topography. Both Bedmap and Bedmap2 are laid out as grids covering the entire continent, but with a tighter grid spacing Bedmap2 includes many surface and sub-ice features too small to be seen in the previous dataset. Additionally, the extensive use of GPS data in more recent surveys improves the precision of the new dataset.

Improvements in resolution, coverage and precision will lead to more accurate calculations of ice volume and potential contribution to sea level rise.

Ice sheet researchers use computer models to simulate how ice sheets will respond to changes in ocean and air temperatures. An advantage of these simulations is that they allow testing of many different climate scenarios, but the models are limited by how accurate the data on ice volume and sub-ice terrain are.

Only the tips of many of Antarctica's mountains are visible above thousands of feet of ice. (Oct. 2012 IceBridge photo. Credit: NASA / Christy Hansen)
Only the tips of many of Antarctica’s mountains are visible above thousands of feet of ice. (Oct. 2012 IceBridge photo. Credit: NASA / Christy Hansen)

“In order to accurately simulate the dynamic response of ice sheets to changing environmental conditions, such as temperature and snow accumulation, we need to know the shape and structure of the bedrock below the ice sheets in great detail,” said Michael Studinger, IceBridge project scientist at NASA Goddard.

Knowing what the bedrock looks like is important for ice sheet modeling because features in the bed control the ice’s shape and affect how it moves. Ice will flow faster on a downhill slope, while an uphill slope or bumpy terrain can slow an ice sheet down or even hold it in place temporarily. “The shape of the bed is the most important unknown, and affect how ice can flow,” said Nowicki. “You can influence how honey spreads on your plate, by simply varying how you hold your plate.” The vastly improved bedrock data included in Bedmap2 should provide the level of detail needed for models to be realistic.

Bedmap2 data of Antarctica's bedrock. Verical elevation has been exaggerated by 17x. (NASA/GSFC)
Bedmap2 data of Antarctica’s bedrock. Verical elevation has been exaggerated by 17x. (NASA/GSFC)

“It will be an important resource for the next generation of ice sheet modelers, physical oceanographers and structural geologists,” said Peter Fretwell, BAS scientist and lead author.

The BAS’ work was published recently in the journal The Cryosphere. Read more on the original release by George Hale here.

Source: NASA Earth

Newly Found Truck-Sized Asteroid to Whiz by Earth June 8

Orbit diagram of Asteroid 2013 LR6. Credit: JPL Small Body Database.

A truck-sized asteroid just discovered yesterday (Thursday, June 6) will give Earth a relatively close shave later today/early tomorrow, depending on your time zone. Asteroid 2013 LR6 is somewhere between 5- 16 meters (16 to 54 feet) in diameter and will be flying by at only about 111,000 kilometers (69,000 mi, 0.29x Lunar Distances) from Earth at 4:43UTC/12:43AM EDT on June 8, 2013.

This is similar in size to the space rock that exploded over Russia back in February of this year. The Russian asteroid was about 15 meters (50 feet) in diameter before it exploded in an airburst event about 20-25 km (12-15 miles) above Earth’s surface.

Find out how you can watch the flyby live online, below.

This flyby is not at close as February’s 2012 DA14 flyby, but it indeed is quite close by Solar System standards. It will be speeding by 9.8 km a second (6.14 mi/s). The asteroid was first spotted by the Catalina Sky Survey and now several other observatories have made follow-up observations to verify and help determine its size and orbit.

According to the Minor Planet Center’s Twitter feed, 2013 LR6 is the 167th minor planetary object discovered so far in the month of June 2013! That is incredible, and as astronomer Nick Howes said via Twitter, “That number should give people a good heads up as to why searching is important.”

According to our David Dickinson, 2013 LR6 will be plunging thru the constellation Vela at closest approach tonight, but it will be a faint one, as it won’t break +13 magnitude.

Since this discovery is so new, Gianluca Masi and the Virtual Telescope Project in Italy has put together a last-minute opportunity to watch the flyby live, online via their telescopes.

The online event is scheduled for June 7, 2013 at 21:30 UTC. To watch, go to the Virtual Telescope project’s webcast page.

Update: Here’s an image taken during the webcast:

Near-Earth Asteroid 2013 LR6 approaching the Earth, about 300,000 km away. Credit: Virtual Telescope Project.

Spectacular Night Launch from NASA Wallops Shines Bright Beacon on Star Formation in Early Universe

Night time blast off of 4 stage NASA Black Brant XII suborbital rocket at 11:05 p.m. EDT on June 5, 2013 from the NASA Wallops Flight Facility carrying the CIBER astronomy payload to study when the first stars and galaxies formed in the universe. The Black Brant soars above huge water tower at adjacent Antares rocket launch pad at NASA Wallops. Credit: Ken Kremer- kenkremer.com

Night time blast off of 4 stage NASA Black Brant XII suborbital rocket at 11:05 p.m. EDT on June 5, 2013 from the NASA Wallops Flight Facility carrying the CIBER astronomy payload to study when the first stars and galaxies formed in the universe. The Black Brant soars above huge water tower at adjacent Antares rocket launch pad at NASA Wallops. Credit: Ken Kremer- kenkremer.com
Updated with more photos[/caption]

WALLOPS ISLAND, VA – The spectacular night time launch of a powerful Black Brant XII suborbital rocket from NASA’s launch range at the Wallops Flight Facility on Virginia’s Eastern Shore at 11:05 p.m. June 5 turned darkness into day as the rocket swiftly streaked skyward with the Cosmic Infrared Background ExpeRiment (CIBER) on a NASA mission to shine a bright beacon for science on star and galaxy formation in the early Universe.

A very loud explosive boom shook the local launch area at ignition that was also heard by local residents and tourists at distances over 10 miles away, gleeful spectators told me.

“The data looks good so far,” Jamie Bock, CIBER principal investigator from the California Institute of Technology, told Universe Today in an exclusive post-launch interview inside Mission Control at NASA Wallops. “I’m very happy.”

Ignition of NASA Black Brant XII suborbital rocket following night time launch at 11:05 p.m. EDT on June 5, 2013 from the NASA Wallops Flight Facility at the eastern Virginia shoreline. The launch pad sits in front of the Antares rocket Launch Complex 0A dominated by the huge water tower.  The rocket carried the CIBER astronomy payload to an altitude of approximately 358 miles above the Atlantic Ocean to study when the first stars and galaxies formed in the universe and how brightly they burned their nuclear fuel.  Credit: Ken Kremer- kenkremer.com
Ignition of NASA Black Brant XII suborbital rocket following night time launch at 11:05 p.m. EDT on June 5, 2013 from the NASA Wallops Flight Facility at the eastern Virginia shoreline. The launch pad sits in front of the Antares rocket Launch Complex 0A dominated by the huge water tower. The rocket carried the CIBER astronomy payload to an altitude of approximately 358 miles above the Atlantic Ocean to study when the first stars and galaxies formed in the universe and how brightly they burned their nuclear fuel. Credit: Ken Kremer- kenkremer.com

The four stage Black Brant XII is the most powerful sounding rocket in America’s arsenal for scientific research.

“I’m absolutely thrilled with this launch and this is very important for Wallops,” William Wrobel, Director of NASA Wallops Flight Facility, told me in an exclusive interview moments after liftoff.

Wallops is rapidly ramping up launch activities this year with two types of powerful new medium class rockets – Antares and Minotaur V- that can loft heavy payloads to the International Space Station (ISS) and to interplanetary space from the newly built pad 0A and the upgraded, adjacent launch pad 0B.

“We have launched over 16,000 sounding rockets.”

“Soon we will be launching our first spacecraft to the moon, NASA’s LADEE orbiter. And we just launched the Antares test flight on April 21.”

I was delighted to witness the magnificent launch from less than half a mile away with a big group of cheering Wallops employees and Wallops Center Director Wrobel. See my launch photos and time lapse shot herein.

Everyone could hear piercing explosions as each stage of the Black Brant rocket ignited as it soared to the heavens to an altitude of some 358 miles above the Atlantic Ocean.

Seconds after liftoff we could see what looked like a rain of sparkling fireworks showing downward towards the launch pad. It was a fabulous shower of aluminum slag and spent ammonium perchlorate rocket fuel.

A powerful NASA Black Brant XII suborbital rocket streaks into the night sky following its launch at 11:05 p.m. EDT on June 5, 2013 from the NASA Wallops Flight Facility at the eastern Virginia shoreline. The launch pad sits in front of the Antares rocket Launch Complex 0A dominated by the huge water tower.  The rocket carried the Cosmic Infrared Background ExpeRiment (CIBER) to an altitude of approximately 358 miles above the Atlantic Ocean to study when the first stars and galaxies formed in the universe and how brightly they burned their nuclear fuel.  Credit: Ken Kremer - kenkremer.com
A powerful NASA Black Brant XII suborbital rocket streaks spectacularly into the night sky following its launch at 11:05 p.m. EDT on June 5, 2013 from the NASA Wallops Flight Facility at the eastern Virginia shoreline. The launch pad sits in front of the Antares rocket Launch Complex 0A dominated by the huge water tower. The rocket carried the Cosmic Infrared Background ExpeRiment (CIBER) to an altitude of approximately 358 miles above the Atlantic Ocean to study when the first stars and galaxies formed in the universe and how brightly they burned their nuclear fuel. Side firing thrusters have ignited to impart stabilizing spin as rocket ascends above launch rail. Credit: Ken Kremer- kenkremer.com

The awesome launch took place on a perfectly clear night drenched with brightly shining stars as the Atlantic Ocean waves relentlessly pounded the shore just a few hundred feet away.

The rocket zoomed past the prominent constellation Scorpius above the Atlantic Ocean.

In fact we were so close that we could hear the spent first stage as it was plummeting from the sky and smashed into the ocean, perhaps 10 miles away.

After completing its spectral collection to determine when did the first stars and galaxies form and how brightly did they shine burning their nuclear fuel, the CIBER payload splashed down in the Atlantic Ocean and was not recovered.

Time lapse view of night launch of NASA Black Brant XII suborbital rocket zooming past constellation Scorpius (left) at 11:05 p.m. EDT above Atlantic Ocean on June 5, 2013 from the NASA Wallops Flight Facility carrying the CIBER astronomy payload. Credit: Ken Kremer- kenkremer.com
Night time launch of NASA Black Brant XII suborbital rocket at 11:05 p.m. EDT on June 5, 2013 from the NASA Wallops Flight Facility carrying the CIBER astronomy payload. Credit: Ken Kremer- kenkremer.com

NASA said the launch was seen from as far away as central New Jersey, southwestern Pennsylvania and northeastern North Carolina.

One of my astronomy friends Joe Stieber, did see the launch from about 135 miles away in central New Jersey and captured beautiful time lapse shots (see below).

Time lapse view of June 5 launch of Blank Brant XII sounding rocket from Wallops Island as seen from Carranza Field in Wharton State Forest, NJ (about 135 miles north from Wallops). Scorpius is above the trees at the far left. Credit: Joe Stieber- sjastro.com

Everything with the rocket and payload went exactly as planned.

“This was our fourth and last flight of the CIBER payload,” Bock told me. “We are still analyzing data from the last 2 flights.”

“CIBER first flew in 2009 atop smaller sounding rockets launched from White Sands Missile Range, N.M. and was recovered.”

“On this flight we wanted to send the experiment higher than ever before to collect more measurements for a longer period of time to help determine the brightness of the early Universe.”

CIBER is instrumented with 2 cameras and 2 spectrometers.

“The payload had to be cooled to 84 Kelvin with liquid nitrogen before launch in order for us to make the measurements,” Bock told me.

“The launch was delayed a day from June 4 because of difficulty both in cooling the payload to the required temperature and in keeping the temperature fluctuations to less than 100 microkelvins,” Bock explained

The CIBER experiment involves scientists and funding from the US and NASA, Japan and South Korea.

Bock is already thinking about the next logical steps with a space based science satellite.

Space.com has now featured an album of my CIBER launch photos – here

Night  launch of NASA Black Brant XII suborbital rocket at 11:05 p.m. EDT on June 5, 2013 from NASA Wallops Flight Facility, VA carrying CIBER astronomy payload. Credit: Ken Kremer
Night launch of NASA Black Brant XII suborbital rocket at 11:05 p.m. EDT on June 5, 2013 from NASA Wallops Flight Facility, VA carrying CIBER astronomy payload. Credit: Ken Kremer

And don’t forget to “Send Your Name to Mars” aboard NASA’s MAVEN orbiter- details here. Deadline: July 1, 2013

Ken Kremer

…………….
Learn more about Conjunctions, Mars, Curiosity, Opportunity, MAVEN, LADEE and NASA missions at Ken’s upcoming lecture presentations

June 11: “Send your Name to Mars on MAVEN” and “LADEE Lunar & Antares Rocket Launches from Virginia”; NJ State Museum Planetarium and Amateur Astronomers Association of Princeton (AAAP), Trenton, NJ, 730 PM.

June 12: “Send your Name to Mars on MAVEN” and “LADEE Lunar & Antares Rocket Launches from Virginia”; Franklin Institute and Rittenhouse Astronomical Society, Philadelphia, PA, 8 PM.

June 23: “Send your Name to Mars on MAVEN” and “CIBER Astro Sat, LADEE Lunar & Antares Rocket Launches from Virginia”; Rodeway Inn, Chincoteague, VA, 8 PM

Aerial view of NASA Wallops launch site on Virginia shore shows launch pads for both suborbital and orbital rockets. This photo was snapped from on top of Pad 0B that will soon launch NASA‘s LADEE orbiter to the Moon. Credit: Ken Kremer- kenkremer.com
Aerial view of NASA Wallops launch site on Virginia shore shows launch pads for both suborbital and orbital rockets. CIBER’s Black Brant XII rocket blasted off just behind the Pad 0A water tower. This photo was snapped from on top of Pad 0B that will soon launch NASA‘s LADEE orbiter to the Moon. Credit: Ken Kremer- kenkremer.com
NASA’s CIBER experiment seeks clues to the formation of the first stars and galaxies. CIBER blasted off on June 5 from the NASA  Wallops Flight Facility, Virginia. It will study the total sky brightness, to probe the component from first stars and galaxies using spectral signatures, and searches for the distinctive spatial pattern seen in this image, produced by large-scale structures from dark matter. This shows a numerical simulation of the density of matter when the universe was one billion years old. Galaxies formation follows the gravitational wells produced by dark matter, where hydrogen gas coalesces, and the first stars ignite.  Credit: Volker Springel/Virgo Consortium.
NASA’s CIBER experiment seeks clues to the formation of the first stars and galaxies. CIBER blasted off on June 5 from the NASA Wallops Flight Facility, Virginia. It will study the total sky brightness, to probe the component from first stars and galaxies using spectral signatures, and searches for the distinctive spatial pattern seen in this image, produced by large-scale structures from dark matter. This shows a numerical simulation of the density of matter when the universe was one billion years old. Galaxies formation follows the gravitational wells produced by dark matter, where hydrogen gas coalesces, and the first stars ignite. Credit: Volker Springel/Virgo Consortium.
NASA Time lapse view shows multiple stages firing during night launch of NASA Black Brant XII suborbital rocket at 11:05 p.m. EDT above Atlantic Ocean on June 5, 2013 from the NASA Wallops Flight Facility carrying the CIBER astronomy payload. Credit: NASA/Jamie Adkins
NASA Black Brant XII suborbital rocket streaks skyward after blastoff at 11:05 p.m. EDT on June 5, 2013 from NASA Wallops Flight Facility, VA carrying CIBER astronomy payload. Credit: Ken Kremer

June Arietids – The Invisible Meteor Shower You Just Might See

You might just see a few meteors from the combined Arietids and Zeta Perseid showers that peak Friday and Saturday mornings. This map shows the sky facing northeast at dawn for the mid-section of the U.S. Created with Stellarium

I’ve never seen an Arietid meteor and chances are you haven’t either. Peaking on June 7-8, the Arietid (AIR-ee-uh-tid) meteor shower is one of the strongest of the year with a maximum rate of 50-80 per hour. But there’s a rub. The shower radiant, the point in the sky from which the meteors appear to radiate, is near the sun and best seen during daylight hours. When was the last time you saw meteors in daylight?

Early scientific exploration of the sky in radio waves at Jodrell Bank Observatory in 1945. Credit: Jodrell Bank, University of Manchester

If you’re wondering how anyone could discover a meteor shower when the sun is out, it’s impossible unless your eyes can see radio waves. The Arietids were first “seen” in 1947 by operators of radio equipment at Jodrell Bank Observatory in England. Meteors leave trails of ionized gases when they rip through our upper atmosphere at tens of thousands of miles per hour and briefly make ideal reflectors of radio waves.

You can even hear them yourself by tuning to a “blank” spot between stations on an FM radio and listening for sudden bursts of talk or music when the meteor trail boosts a neighboring station into audibility. Click HERE for simple instructions if you’d like to give it a try.

The Arietids are joined by a second daytime shower at the same time by the Zeta Perseids, a smaller shower, to guarantee a couple busy days of meteor-listening — and potential meteor-watching —  on and around June 7-8. Most meteor showers are tied to a particular comet, since they’re swarms of dusty detritus left behind in a comet’s wake as it travels ’round the sun. When Earth intersects the stream, tiny comet bits slam into the atmosphere, heat up to 3,000 F or more and self-immolate in glowing streaks we call meteors. Occasionally a shower’s parent can be an asteroid as in the case of the January Quadrantid meteor shower. It’s suspected that the asteroid 2003 EH1 may be a extinct comet.

Most meteors are comet dust striking at the atmosphere at speeds so high, they vaporiz in a blaze of light. This is a meteor from the Leonid shower in 2001. Credit: Bob King

No one’s certain of the Arietids’ parentage. Likely candidates include the near-Earth asteroid 1566 Icarus and Comet 96P/Machholz, both of which have orbits that resemble the shower’s.

After ignoring May’s Eta Aquarid meteor shower for years because of its very low radiant at dawn, I was pleasantly surprised by the many meteors I saw when I happened to catch the shower at maximum on May 6 this year. Circumstances are only slightly worse for the Arietids. That’s why I think it’s worth your while to check out this shower tomorrow (Friday) and Saturday morning(June 7-8). Face east and start watching an hour or two before the start of dawn and continue your vigil until the sky brightens in the east.

The lesser Zeta Perseids are also active, adding to the fun. Since the two shower radiants are close to each other in the sky, it may be hard to tell which you’re seeing. No matter. Any fiery streaks you can trace back toward the east-northeast horizon will likely be one or the other.

Earth-grazing meteor photographed by Manuel Conde of Barcelona, Spain.

Whenever a radiant is near the horizon, many of the meteors approaching us do so at a very shallow angle almost horizontal to the Earth’s atmosphere. From our perspective they travel slowly and last a much longer time than do meteors striking the air at a steeper angle, typical for radiants that are higher in the sky.

Astronomers use the poetic “Earth-grazers” to describe them. Having seen a handful of these unique beauties during the May Aquarid shower, I’m hungry for more. Since the Arietids / Zeta Perseids also originate low in the sky, we should expect similar sights Friday and Saturday mornings.