I was personally so pumped to have seen the Aurora Borealis over the weekend in Central Minnesota! It was a beautiful display of a green and white glow with high, towering, bright spires. Unfortunately, I was in the car at the time, and I definitely need to upgrade my camera to be able to take images of the aurora. But lucky for us, astrophotographers from both hemispheres captured gorgeous shots of the Aurora Borealis and Aurora Australis.
According to SpaceWeather.com, the Earth passed through a region of south-pointing magnetism in the solar wind on June 28, “and the encounter set off one of the finest geomagnetic storms of the current solar cycle.”
This shot from Colin Chatfield shows the awesome auroral scenes over Saskatchewan.
James Stone from Opossum Bay, Tasmania captured this video of the Aurora Australis:
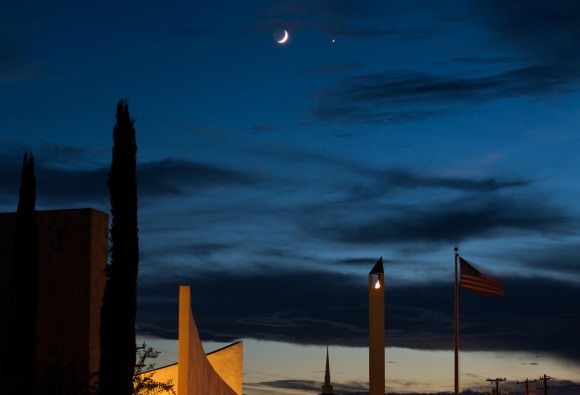
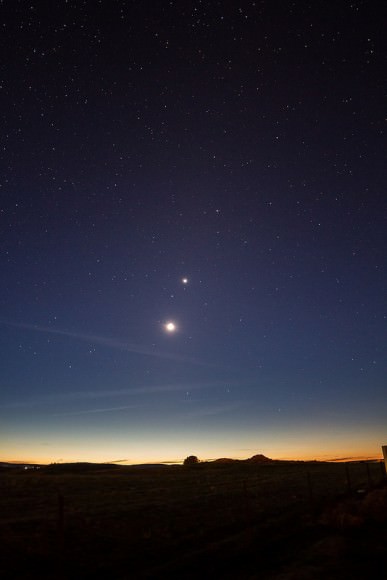
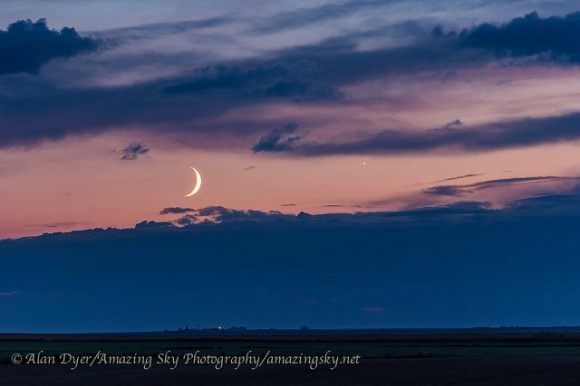
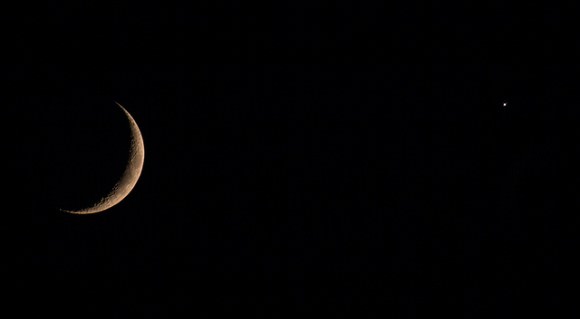
Can you get good astrophotography shots from within a city? Astrophotographer Bruno Letarte has proved you can capture stunning shots of both city and night sky and turn them into a beautiful timelapse. Last fall we featured a timelapse by Bruno taken at the dark sky site of the South African Large Telescope (SALT), but he said his latest project of shooting among the city lights was a “real learning experience.”
“It was a completely different challenge, much trickier than shooting a perfect dark sky, where you find your optimal exposure time and stick to it for everything,” Bruno told Universe Today via email. “Different objects and different focal lengths, lights in the foreground, moving cars, etc. Many sequences had to be decided on the spot with no time to really think it through.”
He captured various objects (Moon, Sun, planets, comets) either rising or setting against a nice city landscape — with light pollution and all – and all taken with an entry level enthusiast camera.
“It was a real learning experience for me to shoot in these various conditions. It’s also an invitation to the general public to look up in their night sky to see what’s up there, even in a city,” Bruno added. “And for the amateur photographer out there, I’ve included the tech details and comments for each sequences with a few seconds of flashing text.”
A pair of astronomers has proved that we haven’t seen the last of the Herschel Space Observatory! On June 17, 2013, engineers for the Herschel space telescope sent final commands to put the decommissioned observatory into its “graveyard” heliocentric parking orbit, after the liquid helium that cooled the observatory’s instruments was depleted. Now, Nick Howes and Ernesto Guido from the Remanzacco Observatory have used the 2 meter Faulkes Telescope North in Hawaii to take a picture of the infrared observatory as it is moving away from its orbit around the L2 LaGrange Point where it spent the entirety of its mission.
Howes told Universe Today that their observations not only improve future chances of it being seen, but also will help astronomers in that the observatory won’t be mistaken for a new asteroid.
“We saw a potential issue here,” Howes said via email, “as the spacecraft would be in a slow tumble, receding from its stable L2 orbit, subjected to solar radiation pressure. And as ESA’s ground stations were no longer communicating with it, so we wanted to basically check the orbits and make sure that for future science, it was not mistakenly detected as an asteroid.”
When Howes and Guido realized that JPL’s Horizons coordinate system — which generates coordinates for objects in space like Herschel — would be suspending coordinates for the observatory from the end of June, they quickly and urgently used the information they had on Herschel’s movements to make their observations.
“The ephemeris from JPL and the Minor Planet Center varied,” Howes said, “and appeared to show quite different long term positions, so we took the initiative to try to help make sure this orbit was better understood. We knew ESA’s scientists had a pretty good handle on the position, but were perplexed by the variance in the coordinates being generated by the two ephemeris systems”
Radiation pressure and a host of other factors would have and will continue to affect the position of the spacecraft, but with it getting fainter by the day, Howes and Guido made the effort by taking two nights of observations to try and find Herschel as it drifted away from L2.
“Imaging a several metre wide spacecraft at over 2.1 million km from Earth in an orbit that was not quite precise, and a tumbling spacecraft is not an easy task, at the faint magnitudes it theoretically could have been at, ” said Guido, who helps manage the Remanzacco Observatory in Italy. “And while we found what we thought could be it on the first night, our calculations would need to be verified by observing it on a second night to validate that it was indeed Herschel.”
Howes, who’d written about Herschel when working in science communications for ESA, contacted several of the mission team via emails, who gave valuable advice on the effects of the final orbital burn.
“We effectively had three possible locations to hunt in,” Howes said, “and luckily, as rain at one of our telescope sites stopped our plans for the third run, and nothing showed up in our first coordinates, we managed to get it in the second set of images, exactly where we thought it could be, with the correct data for its motion, position angle and other orbital characteristics. Ernesto worked on the data reduction for these images, and after about 30 minutes of frantic discussion, said ‘I think I’ve found it.’”
The team have filed their data with the Minor Planet Center, and have worked closely with astronomers at Kitt Peak, who also imaged the Observatory, further refining the observing arc, passing their coordinates even on to astronomers in Chile, with significantly larger telescopes to get even more images of it.
The Faulkes Telescope Project is based at the University of South Wales, and the telescopes are operated by the Las Cumbres Observatory Global Telescope Network. The telescopes are also used for educational purposes, and schools using the Faulkes Telescope will be able to follow Herschel as she leaves her orbit to wander around the Sun. It will return to our neck of the Solar System around 2027/2028 (astrometry measured by Howes and Guido is factoring in radiation pressure, so the values are approximate), when it will return at around magnitude 21.7.
“We’ve engaged schools in this project as it’s great for learning astrometry, and photometry as well as a fun thing to do, and they’ve also been making animations from our data.”
Howes and Guido hope that the updated information will help others keep an eye on the telescope in the future. “It’s been an exciting week, and we wanted to say thank you to ESA for building such a magnificent telescope,” Howes said. “We just wanted to give it a good send off!”
We don’t put much stock in astrology or horoscopes here at Universe Today, but there’s one thing related to the zodiac that’s all science and no superstition: zodiacal light, captured here in a gorgeous photo by astronomer Alan Fitzsimmons above ESO’s La Silla Observatory.
Created by sunlight reflected off fine particles of dust concentrated inside the plane of the Solar System, zodiacal light appears as a diffuse, hazy band of light visible in dark skies stretching away from a recently-set Sun (or before the Sun is about to rise).
The Moon is located just outside the frame of this picture, bathing the observatory in an eerie light that is reflected off the clouds below.
The La Silla Observatory is located at the outskirts of the Chilean Atacama Desert at an altitude of 2400 meters (7,900 feet). Like other observatories in this area, La Silla is located far from sources of light pollution and, like ESO’s Paranal Observatory, it has some of the darkest night skies on the Earth.
The dome in the foreground, just to the right, is the Swiss 1.2-metre Leonhard Euler Telescope named in honor of the famous Swiss mathematician Leonhard Euler (1707–83).
The short answer is, the average distance to the Moon is 384,403 km (238,857 miles). But before you go thinking that this is the final answer, you need to consider a few things. For starters, note the use of the word “average”. This refers to the fact that the Moon orbits around the Earth in an elliptical pattern, which means that at certain times, it will be father away; while at others, it will be closer.
Hence, the number 384,403 km, is an average distance that astronomers call the semi-major axis. At its closest point (known as perigee) the Moon is only 363,104 km (225,622 miles) away. And at its most distant point (called apogee) the Moon gets to a distance of 406,696 km (252,088 miles).
This means that distance from the Earth to the Moon can vary by 43,592 km. That’s a pretty big difference, and it can make the Moon appear dramatically different in size depending on where it is in its orbit. For instance, the size of the Moon can vary by more than 15% from when it’s at its closest to when it’s at the most distant point.
It can also have a dramatic effect on how bright the moon appears when it is in its Full phase. As one might expect, the brightest full Moons occur when the Moon is at the closest, which are typically 30% brighter than when it’s fathest away. When it’s a Full Moon, and it’s a close Moon, it’s known as a Supermoon; which is also known by it technical name – perigee-syzygy.
To get an idea of what this all looks like, check out the animation above that was released by the Goddard Space Flight Center Scientific Visualization Studio in 2011. The animation shows the geocentric phase, libration, position angle of the axis, and apparent diameter of the Moon throughout the year, at hourly intervals.
At this point, a good question to ask would be: how do we know how far away the Moon is? Well, that depends on when we’re talking. In the days of ancient Greece, astronomers relied on simple geometry, the diameter of the Earth – which they had already calculated to be the equivalent of 12,875 km (or 8000 miles) – and the measurements of shadows to make the first (relatively) accurate estimates.
Having observed and recorded how shadows work over a long period of history, the ancient Greeks had determined that when an object is placed in front of the Sun, the length of a shadow this generates will always be 108 times the diameter of the object itself. So a ball measuring 2.5 cm (1 inch) across and placed on a stick between the Sun and the ground will create a triangular shadow that extends for 270 cm (108 inches).
This reasoning was then applied to the phenomena of Lunar and Solar Eclipses.
In the former, they found that the Moon was imperfectly blocked by the shadow of the Earth, and that the shadow was roughly 2.5 times the width of the Moon. In the latter, they noted that the Moon was of sufficient size and distance to block out the Sun. What’s more, the shadow it would create terminated at Earth, and would end in the same angle that the shadow of the Earth does – making them different-sized versions of the same triangle.
Using the calculations on the diameter of the Earth, the Greeks reasoned that the larger triangle would measure one Earth diameter at its base (12,875 km/8000 miles) and be 1,390,000 km (864,000 miles) long. The other triangle would be the equivalent of 2.5 Moon diameters wide and, since the triangles are proportionate, 2.5 Moon orbits tall.
Adding the two triangles together would yield the equivalent of 3.5 Moon orbits, which would create the largest triangle and gave the (again, relatively) accurate measurement of the distance between the Earth and the Moon. In other words, the distance is 1.39 million km (864,000 miles) divided by 3.5, which works out to around 397,500 km (247,000 miles). Not exactly bang on, but not bad for ancient peoples!
Today, millimeter-precision measurements of the lunar distance are made by measuring the time it takes for light to travel between LIDAR stations here on the Earth and retroreflectors placed on the Moon. This process is known as the Lunar Laser Ranging experiment, a process that was made possible thanks to the efforts of the Apollo missions.
When astronauts visited the Moon more than forty years ago, they left a series of retroreflecting mirrors on the lunar surface. When scientists here on Earth shoot a laser at the Moon, the light from the laser is reflected right back at them from one of these devices. For every 100 quadrillion photons shot at the Moon, only a handful come back, but that’s enough to get an accurate appraisal.
Since light is moving at almost 300,000 kilometers (186,411 miles) per second, it takes a little more than a second to make the journey. And then it takes another second or so to return. By calculating the exact amount of time it takes for light to make the journey, astronomers are able to know exactly how far the Moon is at any time, down to millimeter accuracy.
From this technique, astronomers have also discovered that the Moon is slowly drifting away from us, at a glacial rate of 3.8 cm (1.5 inches) a year. Millions of years in the future, the Moon will appear smaller in the sky than it does today. And within a billion years or so, the Moon will be visually smaller than the Sun and we will no longer experience total solar eclipses.
I love those images taken from the International Space Station that show the Moon rising or setting above Earth’s limb, and when I first saw this image posted on Universe Today’s Flickr Group page, I thought someone had randomly posted one of those images taken by an astronaut on the ISS. But then I saw it was taken by Patrick Cullis, one of our “regulars” in our featured astrophotography posts.
This very beautiful, crisp and clear image was taken from a meteorological balloon at 86,000 feet (26,200 meters) above Earth, and it was no fluke that Patrick captured the Moon setting above Earth — it was planned.
“Once I knew the weather was going to work out for a launch I really planned out what time it needed to happen for the Moon to show up in the frame,” Patrick said via Flickr. “Definitely got lucky since the camera is just swinging around randomly under the balloon.”
He calls this image “Divided Moon,” as it shows the Continental Divide in Colorado. “I-70 can be seen snaking up from the bottom center towards Georgetown (valley stretching from left to right,) Loveland Pass, and the Eisenhower Tunnel,” Patrick explained. If you click on the image above (or go here to see it on Flickr) you can see other landmarks labeled.
Opportunity rover captures spectacular view ahead to her upcoming mountain climbing goal, the raised rim of “Solander Point” at right, located along the western edge of Endeavour Crater. It may harbor clay minerals indicative of a habitable zone. This pancam photo mosaic was taken on Sol 3335, June 11, 2013. Credit: NASA/JPL/Cornell/ASU/Marco Di Lorenzo/Ken Kremer (kenkremer.com)
See full panoramic scene – below Your last chance to “Send Your Name to Mars aboard NASA’s MAVEN orbiter” – below[/caption]
NASA’s nearly decade old Opportunity Mars rover is sailing swiftly on a southerly course towards her first true mountain climbing destination – named “Solander Point” – in search of further evidence of habitable environments with the chemical ingredients necessary to sustain Martian life forms.
At Solander Point, researchers have already spotted deep stacks of ancient rocks transformed by flowing liquid water eons ago. It is located along the western rim of huge Endeavour Crater.
“Right now the rover team is discussing the best way to approach and drive up Solander,” Ray Arvidson told Universe Today. Arvidson is the mission’s deputy principal scientific investigator from Washington University in St. Louis, Mo.
Solander Point may harbor clay minerals in the rock stacks indicative of a past Martian habitable zone.
“One idea is to drive part way up Solander from the west side of the rim, turn left and then drive down the steeper north facing slopes with the stratographic sections,” Arvidson told me.
“That way we don’t have to drive up the relatively steeper slopes. The rover can drive up rocky surfaces inclined about 12 to 15 degrees.”
“We want to go through the stratographic sections on the north facing sections.”
The science team hopes that by scaling Solander, Opportunity will build on her recent historic discovery of a habitable environment at a rock called “Esperance” that possesses a cache of phyllosilicate clay minerals.
These aluminum rich clay minerals typically form in neutral, drinkable water that is not extremely acidic or basic and therefore could support a path to potential Martian microbes.
“Esperance ranks as one of my personal Top 5 discoveries of the mission,” said Steve Squyres of Cornell University, Ithaca, N.Y., principal investigator for NASA’s rover mission at a recent media briefing.
Using high resolution CRISM spectral data collected from Mars orbit, the rover was specifically directed to Esperance, Arvidson explained. The rock was found about a kilometer back on Matijevic Hill at ‘Cape York’, a rather low hilly segment of the western rim of giant Endeavour crater which spans 14 miles (22 km) across.
‘Solander Point’ offers roughly about a 10 times taller stack of geological layering compared to ‘Cape York.’ Both areas are raised segments of the western rim of Endeavour Crater.
The team is working now to obtain the same type of high resolution spectral evidence for phyllosilicate clay minerals at Solander as they had at Cape York to aid in targeting Opportunity to the most promising outcrops, Arvidson explained.
Opportunity is snapping ever more spectacular imagery of Solander Point and the eroded rim of Endeavour Crater as she approaches closer every passing Sol, or Martian Day. See our original photo mosaics herein by Marco Di Lorenzo and Ken Kremer.
The long lived robot arrived at the edge of Endeavour crater in mid-2011 and will spend her remaining life driving around the scientifically rich crater rim segments.
On June 21, 2013, Opportunity marked five Martian years on Mars since landing on Jan 24, 2004 with a mere 90 day (Sol) ‘warranty’.
This week Opportunity’s total driving distance exceeded 23 miles (37 kilometers).
The solar powered robot remains in excellent health and the life giving solar arrays are producing plenty of electrical power at the moment.
Solander Point also offers northerly tilled slopes that will maximize the power generation during Opportunity’s upcoming 6th Martian winter .
The rover handlers want Opportunity to reach Solander’s slopes by August, before winter’s onset.
As ot today (tosol) Opportunity has trekked about halfway from Cape York to Solander Point – tip to tip.
On the opposite side of Mars at Gale Crater, Opportunity’s younger sister rover Curiosity also discovered clay minerals and a habitable environment originating from a time when the Red Planet was far warmer and wetter billions of years ago.
And this is your last chance to “Send Your Name to Mars” aboard NASA’s MAVEN orbiter- details here. Deadline: July 1, 2013. Launch: Nov. 18, 2013
Atoms, string theory, dark matter, dark energy… there’s an awful lot about the Universe that might make sense on paper (to physicists, anyway) but is extremely difficult to detect and measure, at least with the technology available today. But at the core of science is observation, and what’s been observed of the Universe so far strongly indicates an overwhelming amount of… stuff… that cannot be observed. But just because it can’t be seen doesn’t mean it’s not there; on the contrary, it’s what we can’t see that actually makes up the majority of the Universe.
If this doesn’t make sense, that’s okay — they’re all pretty complex concepts. So in order to help non-scientists (which, like dark energy, most of the population is comprised of) get a better grasp as to what all this “dark” stuff is about, CERN scientist and spokesperson James Gillies has teamed up with TED-Ed animators to visually explain some of the Universe’s darkest secrets. Check it out above (and see more space science lessons from TED-Ed here.)
Because everything’s easier to understand with animation!
It’s one of the most intense and violent of all events in space – a supernova. Now a team of researchers at the Max Planck Institute for Astrophysics have been taking a very specialized look at the formation of neutron stars at the center of collapsing stars. Through the use of sophisticated computer simulations, they have been able to create three-dimensional models which show the physical effects – intense and violent motions which occur when stellar matter is drawn inward. It’s a bold, new look into the dynamics which happen when a star explodes.
As we know, stars which have eight to ten times the mass of the Sun are destined to end their lives in a massive explosion, the gases blown into space with incredible force. These cataclysmic events are among the brightest and most powerful events in the Universe and can outshine a galaxy when they occur. It is this very process which creates elements critical to life as we know it – and the beginnings of neutron stars.
Neutron stars are an enigma unto themselves. These highly compact stellar remnants contain as much as 1.5 times the mass of the Sun, yet are compressed to the size of a city. It is not a slow squeeze. This compression happens when the stellar core implodes from the intense gravity of its own mass… and it takes only a fraction of a second. Can anything stop it? Yes. It has a limit. Collapse ceases when the density of the atomic nuclei is exceeded. That’s comparable to around 300 million tons compressed into something the size of a sugar cube.
Studying neutron stars opens up a whole new dimension of questions which scientists are keen to answer. They want to know what causes stellar disruption and how can the implosion of the stellar core revert to an explosion. At present, they theorize that neutrinos may be a critical factor. These tiny elemental particles are created and expelled in monumental numbers during the supernova process and may very well act as heating elements which ignite the explosion. According to the research team, neutrinos could impart energy into the stellar gas, causing it to build up pressure. From there, a shock wave is created and as it speeds up, it could disrupt the star and cause a supernova.
As plausible as it might sound, astronomers aren’t sure if this theory could work or not. Because the processes of a supernova cannot be recreated under laboratory conditions and we’re not able to directly see into the interior of a supernovae, we’ll just have to rely on computer simulations. Right now, researchers are able to recreate a supernova event with complex mathematical equations which replicate the motions of stellar gas and the physical properties which happen at the critical moment of core collapse. These types of computations require the use of some of the most powerful supercomputers in the world, but it has also been possible to use more simplified models to get the same results. “If, for example, the crucial effects of neutrinos were included in some detailed treatment, the computer simulations could only be performed in two dimensions, which means that the star in the models was assumed to have an artificial rotational symmetry around an axis.” says the research team.
With the support of the Rechenzentrum Garching (RZG), scientists were able to create in a singularly efficient and fast computer program. They were also given access to most powerful supercomputers, and a computer time award of nearly 150 million processor hours, which is the greatest contingent so far granted by the “Partnership for Advanced Computing in Europe (PRACE)” initiative of the European Union, the team of researchers at the Max Planck Institute for Astrophysics (MPA) in Garching could now for the first time simulate the processes in collapsing stars in three dimensions and with a sophisticated description of all relevant physics.
“For this purpose we used nearly 16,000 processor cores in parallel mode, but still a single model run took about 4.5 months of continuous computing”, says PhD student Florian Hanke, who performed the simulations. Only two computing centers in Europe were able to provide sufficiently powerful machines for such long periods of time, namely CURIE at Très Grand Centre de calcul (TGCC) du CEA near Paris and SuperMUC at the Leibniz-Rechenzentrum (LRZ) in Munich/Garching.
Given several thousand billion bytes of simulation data, it took some time before researchers could fully understand the implications of their model runs. However, what they saw both elated and surprised them. The stellar gas performed in a manner very much like ordinary convection, with the neutrinos driving the heating process. And that’s not all… They also found strong sloshing motions which transiently change to rotational motions. This behavior has been observed before and named Standing Accretion Shock Instability. According to the news release, “This term expresses the fact that the initial sphericity of the supernova shock wave is spontaneously broken, because the shock develops large-amplitude, pulsating asymmetries by the oscillatory growth of initially small, random seed perturbations. So far, however, this had been found only in simplified and incomplete model simulations.”
“My colleague Thierry Foglizzo at the Service d’ Astrophysique des CEA-Saclay near Paris has obtained a detailed understanding of the growth conditions of this instability”, explains Hans-Thomas Janka, the head of the research team. “He has constructed an experiment, in which a hydraulic jump in a circular water flow exhibits pulsational asymmetries in close analogy to the shock front in the collapsing matter of the supernova core.” Known as Shallow Water Analogue of Shock Instability, the dynamic process can be demonstrated in less technicalized manners by eliminating the important effects of neutrino heating – a reason which causes many astrophysicists to doubt that collapsing stars might go through this type of instability. However, the new computer models are able to demonstrate the Standing Accretion Shock Instability is a critical factor.
“It does not only govern the mass motions in the supernova core but it also imposes characteristic signatures on the neutrino and gravitational-wave emission, which will be measurable for a future Galactic supernova. Moreover, it may lead to strong asymmetries of the stellar explosion, in course of which the newly formed neutron star will receive a large kick and spin”, describes team member Bernhard Müller the most significant consequences of such dynamical processes in the supernova core.
Are we finished with supernova research? Do we understand everything there is to know about neutron stars? Not hardly. At the present time, the scientist are ready to further their investigations into the measurable effects connected to SASI and refine their predictions of associated signals. In the future they will further their understanding by performing more and longer simulations to reveal how instability and neutrino heating react together. Perhaps one day they’ll be able to show this relationship to be the trigger which ignites a supernova explosion and conceives a neutron star.
It sure would be interesting to watch two stars run into each other — from a safe distance, of course. One can imagine there would be quite the titanic battle going on between their competing gravitational forces, throwing off gas and matter as they collide.
They also leave behind interesting echoes, at least according to new research. A European team looked at the leftovers of one collision and found a type of pulsating star that has never been seen before.
It’s common for stars to form in groups or to be paired up, since they form from immense gas clouds. Sometimes, a red giant star in a binary system gets so big that it will bump into a companion star orbiting nearby. This crash could shave 90% of the red giant star’s mass off, but astronomers are still trying to get their heads around what happens.
“Only a few stars that have recently emerged from a stellar collision are known, so it has been difficult to study the connection between stellar collisions and the various exotic stellar systems they produce,” Keele University, which led the research, stated.
Researchers who made the find were actually on the hunt for alien planets. They turned up what is called an “eclipsing” binary system, meaning that one of the stars passes in front of the other from the perspective of Earth.
The scientists then used a high-speed camera on the Very Large Telescope in Chile called ULTRACAM. The camera is capable of taking up to 500 pictures a second to track fast-moving astronomical events.
Observations revealed that “the remnant of the stripped red giant is a new type of pulsating star,” Keele stated.
“We have been able to find out a lot about these stars, such as how much they weigh, because they are in a binary system,” stated Pierre Maxted, an astrophysicist at Keele.
“This will really help us to interpret the pulsation signal and so figure out how these stars survived the collision and what will become of them over the next few billion years.”
The next step for the researchers will be to calculate when the star will begin cooling down and become a white dwarf, which is what is left behind after a star runs out of fuel to burn.