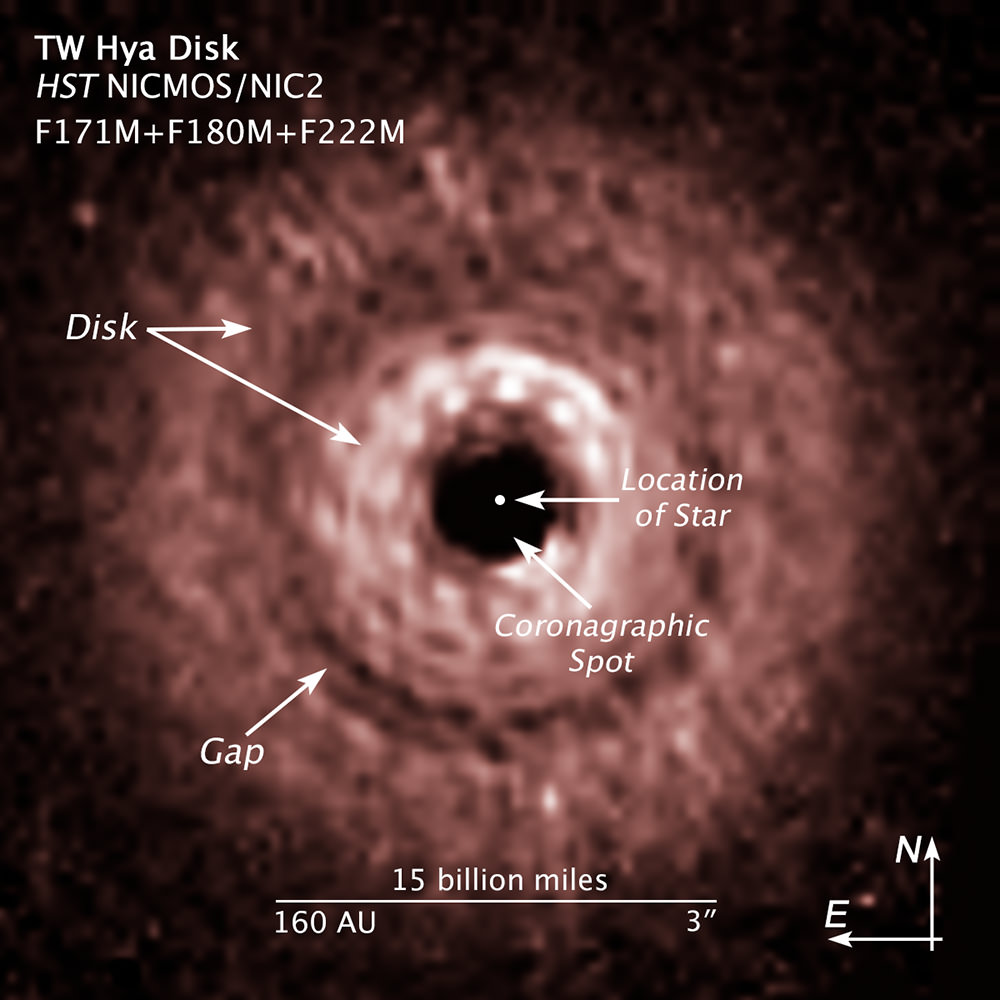
An image of TW Hydrae and the protoplanetary stuff surrounding the star. Astronomers believe a planet is forming within the gas and dust and sweeping up debris, as shown by the gap in this picture. Credit: NASA, ESA, J. Debes (STScI), H. Jang-Condell (University of Wyoming), A. Weinberger (Carnegie Institution of Washington), A. Roberge (Goddard Space Flight Center), and G. Schneider (University of Arizona/Steward Observatory)
Take a close look at the blurry image above. See that gap in the cloud? That could be a planet being born some 176 light-years away from Earth. It’s a small planet, only 6 to 28 times Earth’s mass.
That’s not even the best part.
This alien world, if we can confirm it, shouldn’t be there according to conventional planet-forming theory.
The gap in the image above — taken by the Hubble Space Telescope — probably arose when a planet under construction swept through the dust and debris in its orbit, astronomers said.
That’s not much of a surprise (at first blush) given what we think we know about planet formation. You start with a cloud of debris and gas swirling around a star, then gradually the bits and pieces start colliding, sticking together and growing bigger into small rocks, bigger ones and eventually, planets or gas giant planet cores.
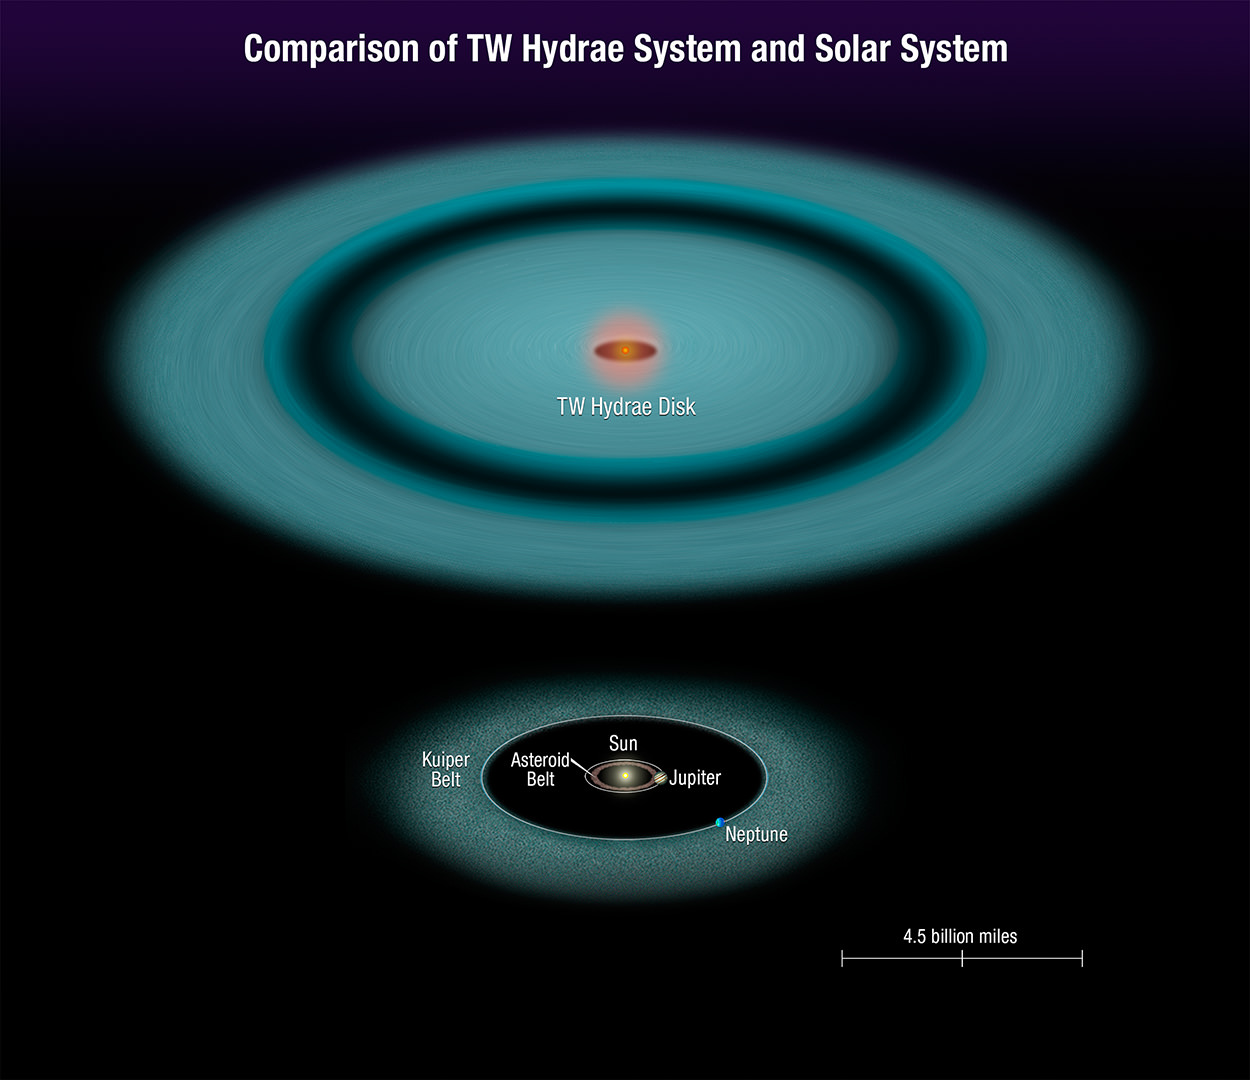
But there’s something puzzling astronomers this time around: this planet is a heck of a long way from its star, TW Hydrae, about twice Pluto’s distance from the sun. Given that alien systems’ age, that world shouldn’t have formed so quickly.
An illustration of TW Hydrae’s disk in comparison with that of Earth’s solar system. Credit: NASA, ESA, and A. Feild (STScI)
Astronomers believe that Jupiter took about 10 million years to form at its distance away from the sun. This planet near TW Hydrae should take 200 times longer to form because the alien world is moving slower, and has less debris to pick up.
But something must be off, because TW Hydrae‘s system is believed to be only 8 million years old.
“There has not been enough time for a planet to grow through the slow accumulation of smaller debris. Complicating the story further is that TW Hydrae is only 55 percent as massive as our sun,” NASA stated, adding it’s the first time we’ve seen a gap so far away from a low-mass star.
The lead researcher put it even more bluntly: “Typically, you need pebbles before you can have a planet. So, if there is a planet and there is no dust larger than a grain of sand farther out, that would be a huge challenge to traditional planet formation models,” stated John Debes, an astronomer at the Space Telescope Science Institute in Baltimore.
Like a raindrop forming in a cloud, a star forms in a diffuse gas cloud in deep space. As the star grows, its gravitational pull draws in dust and gas from the surrounding molecular cloud to form a swirling disk called a “protoplanetary disk.” This disk eventually further consolidates to form planets, moons, asteroids and comets. Credit: NASA/JPL-Caltech
At this point, you would suppose the astronomers are seriously investigating other theories. One alternative brought up in the press release: perhaps part of the disc collapsed due to gravitational instability. If that is the case, a planet could come to be in only a few thousand years, instead of several million.
“If we can actually confirm that there’s a planet there, we can connect its characteristics to measurements of the gap properties,” Debes stated. “That might add to planet formation theories as to how you can actually form a planet very far out.”
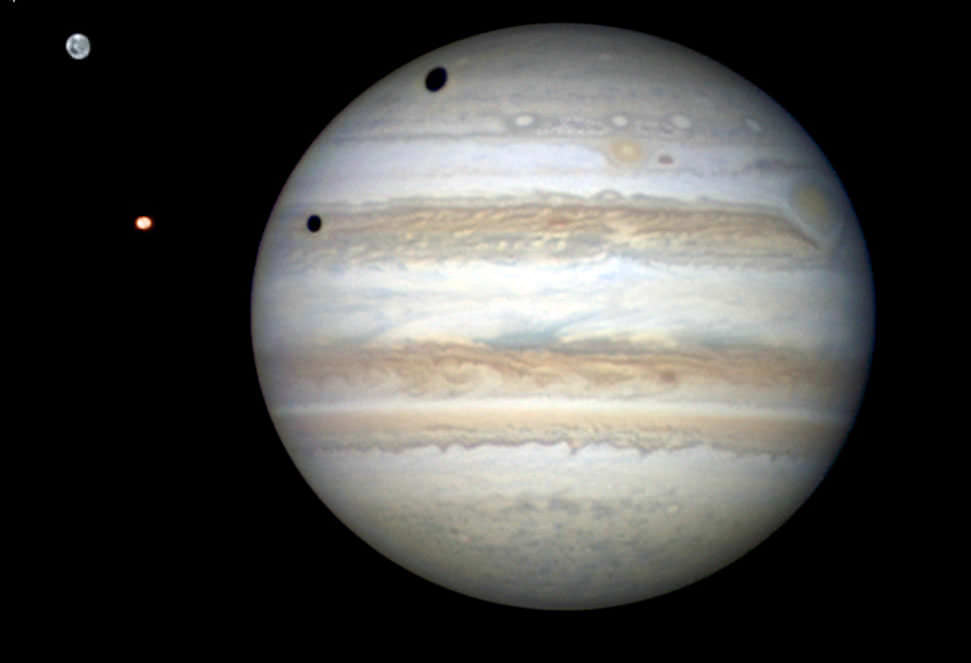
A rare double transit of Jupiter’s moon Ganymede (top) and Io on Jan. 3, 2013. Here, the sun is shining from the left causing shadows cast by the moons to fall onto the planet’s cloud tops. Credit: Damian Peach
There’s a trick with the “direct collapse” theory, though: astronomers believe it takes a bunch of matter that is one to two times more massive than Jupiter before a collapse can occur to form a planet.
There are also intriguing results about the gap. Chile’s Atacama Large Millimeter/submillimeter Array (ALMA) — which is designed to look at dusty regions around young stars — found that the dust grains in this system, orbiting nearby the gap, are still smaller than the size of a grain of sand.
Astronomers plan to use ALMA and the James Webb Space Telescope, which should launch in 2018, to get a better look. In the meantime, the results will be published in the June 14 edition of the Astrophysical Journal.
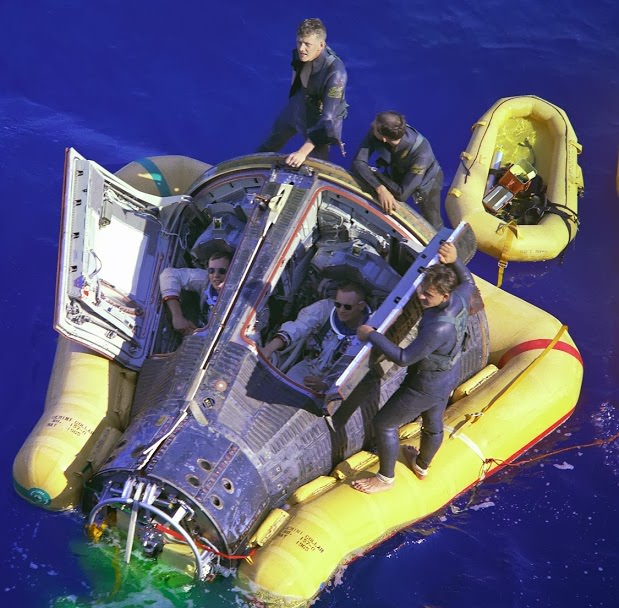
Neil Armstrong and David Scott in the Gemini VIII capsule, after splashdown, March 16, 1966. Credit: NASA.
So, you’ve just endured a harrowing experience where your orbiting spacecraft has gone wildly out of control. You somehow — while undergoing the incredible, vertigo-inducing G-forces of your spinning spacecraft — figure out a plan, undock your spacecraft from another spacecraft and abort your original mission.
Six and a half orbits and ten hours and 44 minutes after you’ve thunderously launched into space, you violently re-enter Earth’s atmosphere and splash down in a pitching ocean. Obviously, you have to throw up, and so does your crewmate. But there’s just one air sickness bag.
But by the time the rescue crew has arrived you’ve donned your sunglasses and look as cool as a cucumber.
That’s Neil Armstrong and Dave Scott’s experience during the Gemini 8 mission.
The different colors in this MESSENGER image of Mercury indicate the chemical, mineralogical, and physical differences between the rocks that make up the planet’s surface. Credit: NASA/Johns Hopkins University Applied Physics Laboratory/Carnegie Institution of Washington.
The MESSENGER mission has now mapped the entire surface of planet Mercury — and this is the first time this has even been done. MESSENGER is the first spacecraft to be in orbit of Mercury, and has been there since 2011, with a couple of flybys starting in 2008 as it slowly looped its way into orbit. The seven scientific instruments and radio science investigation on the spacecraft have provided an entirely new view of the planet.
This colorful view of Mercury is, of course, not what Mercury would look like to the human eye. It was created by using images from the color base map imaging campaign during MESSENGER’s primary mission. These colors enhance the chemical, mineralogical, and physical differences between the rocks that make up Mercury’s surface, allowing scientists to figure out all the different minerals that are on the planet’s surface.
The complete map of Mercury was completed and released in February of 2013, and is made of thousands of images taken by MESSENGER. The spinning video map shows Mercury as, really, we’ve not seen it before, and it is fun to watch features like large rayed craters and basins spin into view.
The MESSENGER team explained the colors:
Young crater rays, extending radially from fresh impact craters, appear light blue or white. Medium- and dark-blue areas are a geologic unit of Mercury’s crust known as the “low-reflectance material”, thought to be rich in a dark, opaque mineral. Tan areas are plains formed by eruption of highly fluid lavas. The giant Caloris basin is the large circular tan feature located just to the upper right of center of the image.
You can see an image of the other side of Mercury here, and the complete gallery of science images and mosaics here.
The Subaru Telescope. Credit: National Astronomical Observatory of Japan
Put another checkmark beside the “cold dark matter” theory. New observations by Japan’s Subaru Telescope are helping astronomers get a grip on the density of dark matter, this mysterious substance that pervades the universe.
We can’t see dark matter, which makes up an estimated 85 percent of the universe, but scientists can certainly measure its gravitational effects on galaxies, stars and other celestial residents. Particle physicists also are on the hunt for a “dark matter” particle — with some interesting results released a few weeks ago.
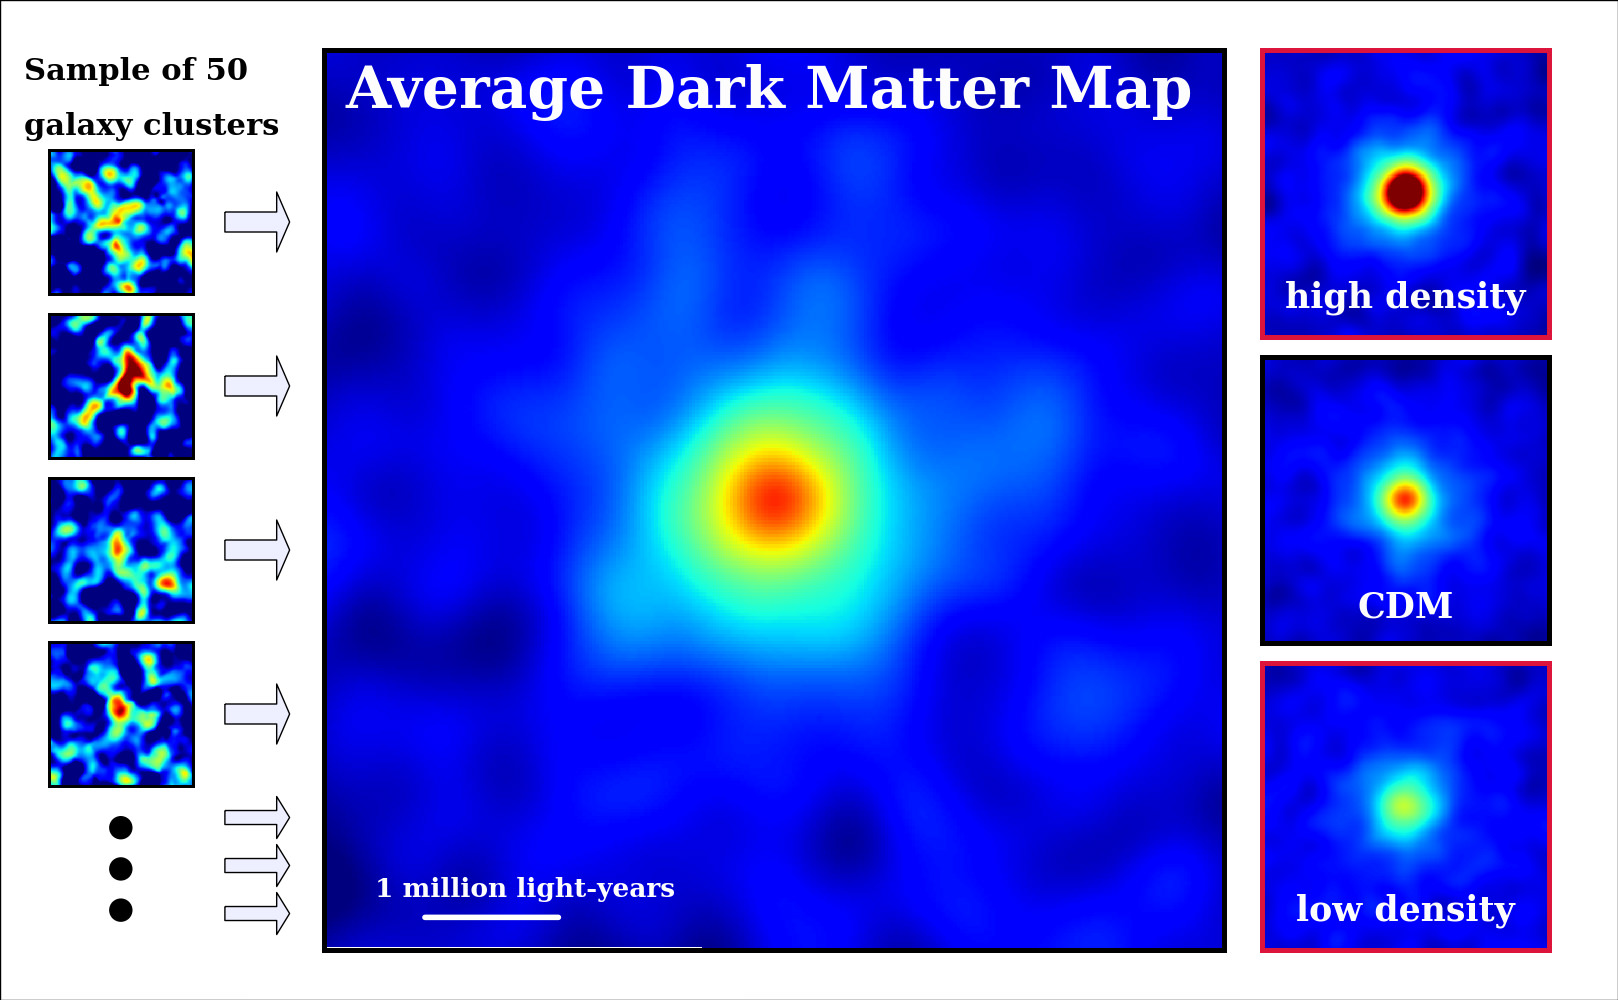
The latest experiment with Subaru measured 50 clusters of galaxies and found that the density of dark matter is largest in the center of these clusters, and smallest on the outskirts. These measurements are a close match to what is predicted by cold dark matter theory, scientists said.
Cold dark matter assumes that this material can’t be observed in any part of the electromagnetic spectrum, the band of light waves that ranges from high-energy X-rays to low-energy infrared heat. Also, the theory dictates that dark matter is made up of slow-moving particles that, because they collide with each other infrequently, are cold. So, the only way dark matter interacts with other particles is by gravity, scientists have said.
To check this out, Subaru peered at “gravitational lensing” in the sky — areas where the light of background objects are bent around dense, massive objects in front. Galaxy clusters are a prime example of these super-dense areas.
Several dark matter maps: one based on a sample of 50 individual galaxy clusters (left), another looking at an average galaxy cluster (center), and another based on dark matter theory (right). Red is the highest concentration of dark matter, followed by yellow, green and blue. At right, in the middle, is a map based on cold dark matter theory that comes close to the average galaxy cluster observed with the Suburu Telescope. Credit: NAOJ/ASIAA/School of Physics and Astronomy, University of Birmingham/Kavli IPMU/Astronomical Institute, Tohoku University)
“The Subaru Telescope is a fantastic instrument for gravitational lensing measurements. It allows us to measure very precisely how the dark matter in galaxy clusters distorts light from distant galaxies and gauge tiny changes in the appearance of a huge number of faint galaxies,” stated Nobuhiro Okabe, an astronomer at Academia Sinica in Taiwan who led the study.
Next, the team members could compare where the matter was most dense with that predicted by cold dark matter theory. To do that, they measured 50 of the most massive, known clusters of galaxies. Then, they measured the “concentration parameter”, or the cluster’s average density.
“They found that the density of dark matter increases from the edges to the center of the cluster, and that the concentration parameter of galaxy clusters in the near universe aligns with CDM theory,” stated the National Astronomical Observatory of Japan.
The next step, researchers stated, is to measure dark matter density in the center of the galaxy clusters. This could reveal more about how this substance behaves. Check out more about this study in Astrophysical Journal Letters.
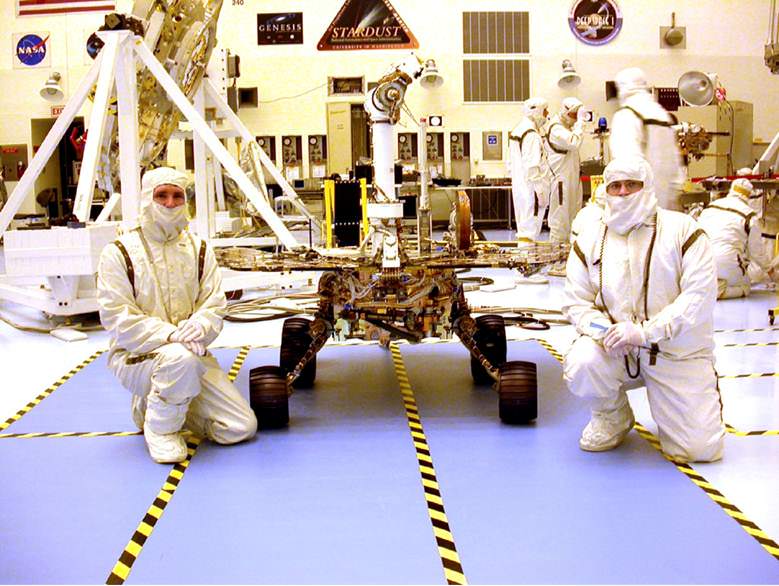
Chris Lewicki in the clean room. His role as flight director for the two MER rovers and surface operations manager for the Phoenix mission required an intimate knowledge of all the spacecraft systems. Image courtesy Chris Lewicki.
Chris Lewicki is the President and Chief Engineer for one of the most pioneering and audacious companies in the world today. Planetary Resources was founded in 2008 by two leading space advocates, Peter Diamandis, Chairman and CEO of the X-Prize Foundation and Eric Anderson, a forerunner in the field of space tourism. In from the earliest days of the company, in turning to Lewicki, Anderson and Diamandis have gained scientific and management expertise which reaches far beyond low Earth orbit.
Chris is a recipient of two NASA Exceptional Achievement Medals and has an asteroid name in his honour, 13609 Lewicki. Chris holds bachelor’s and master’s degrees in Aerospace Engineering from the University of Arizona.
In this exclusive interview with Nick Howes, Lewicki gives us a feel for what lies behind Planetary Resources most compelling step yet in their quest to bring space to the masses.
Chris Lewicki is the President and Chief Engineer for Planetary Resources, Inc. Image courtesy Planetary Resources.
Nick Howes – So Chris, what first inspired you to get in to astronomy and space science?
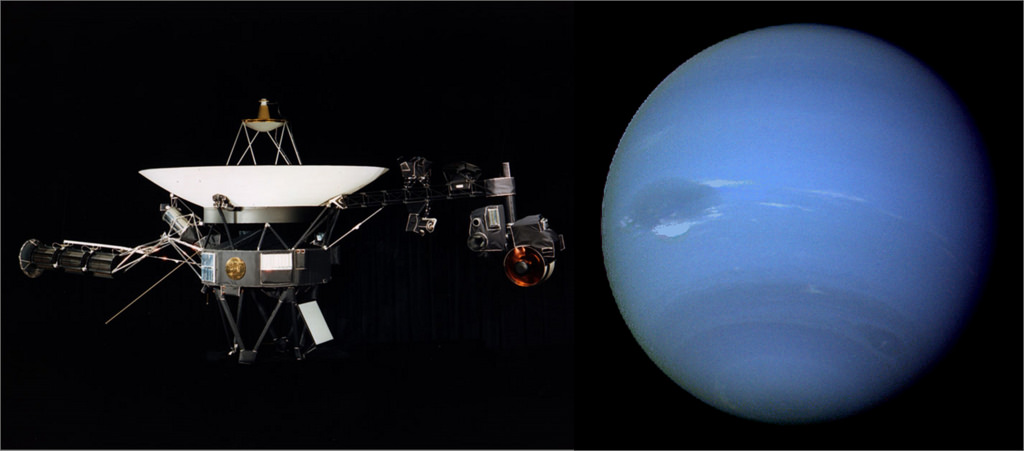
Chris Lewicki – So, I guess it wasn’t a person as most would say, but a mission that got me started on this road. Even before college, and you have to remember I grew up in dairy country in Northern Wisconsin, where we didn’t really have much in the way of space. I wanted to do something interesting, and found I was good at math. When I saw the Voyager 2 spacecraft flyby of Neptune and Triton, I thought “wow this is it,” and wanted to work at JPL pretty much from that moment onwards. Thinking that this was a “really special place.”
Voyager 2’s encounter with Nepture. Credit: NASA
NH – At college were you determined to work for someone like NASA, and was your time at Blastoff a good stepping stone in to this?
CL – I think it really did start even before college, like I said, from the Voyager 2 encounter and all the subsequent missions which JPL were involved in this was kind of the goal. Ahead of JPL though, was my first encounter with Peter (Diamandis) and Eric (Anderson) when we worked on starport.com where I was a web developer. Prior to that I’d had a spell at the Goddard Space Flight Centre, but with Eric and Peter, we really did form a bond. Starport didn’t last too long though, as it was at the time of the dotcom boom and bubble, but it taught me some valuable lessons in those months.
Then I took up a position at JPL, but as you probably know, not everything they do is mission design and planning, and while it is an amazing place, I wanted to get my hands on some real mission stuff, so moved on after just under a year.
Then came Blastoff which kind of set a lot of the wheels in motion for ideas relating to the Google Lunar X-Prize. We had a lot of fun there designing rovers and exploratory missions to the Moon, lots of great people with great ideas.
I was then at a small satellites conference in Utah, when a representative of JPL came up to me after my talk, gave me his business card and effectively said I should come and do an interview for them. Peter and Eric didn’t really want me to go, but I told them “I really have to go off and learn how to build rockets.” Thus really started the real journey working with NASA on some of the most exciting missions in recent history.
NH – How thrilling was it being the flight director for two of the most successful missions in NASA’s history?
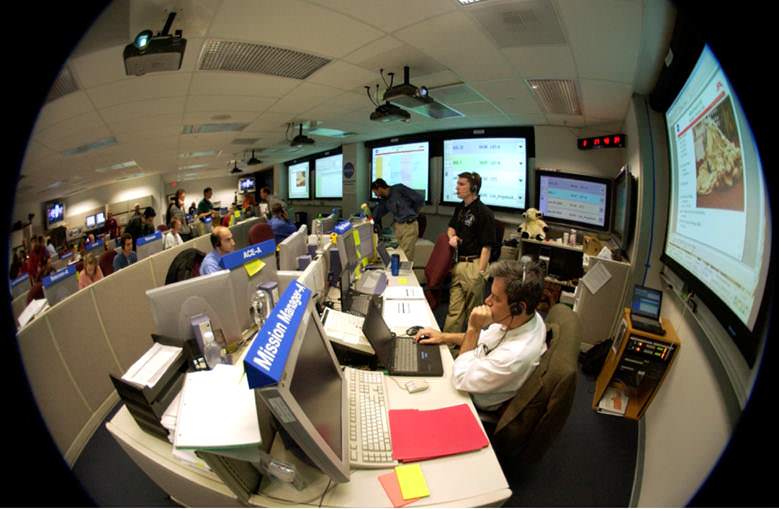
A view of the Flight Control room at the Jet Propulsion Laboratory during the landing of the Spirit Mars Exploration Rover, Spirit, with Chris in the Flight Director hotseat. Credit: NASA/JPL.
CL – Thrilling really doesn’t come close to covering it. There I was, 29 years old, thinking “should I really be doing this?” but then, realising “yes, I can do this” sitting in the flight directors desk for two of NASA’s most audacious missions, being Spirit and Opportunity. It was my role to get them safely down on the surface, and boy did we test those missions.
The simulators were so realistic; we’d be running so many different scenarios for years prior to the actual EDL phase, now known as the “7 minutes of terror”. It really doesn’t feel quite real though when it’s actually happening, you just know it is because the room is full of TV cameras, and you have that extra notion in the back of your mind saying it’s not a sim this time. The telemetry though in the simulations was so close to the real data, just a few variations, it kind of showed how much testing and planning went in to those missions, and how it all paid off.
NH – With Phoenix you’d obviously experienced the sadness of the loss of Polar Lander before hand; did that teach you any valuable lessons which you have now carried forward to your role at Planetary Resources?
CL – Phoenix started with a failure review, but that’s what I think is so important about engineering and indeed life in general. You have to fail to understand how to make things better. During that design review we figured out a dozen more reasons for things that could have gone wrong with Mars Polar Lander, and implemented the changes for Phoenix. You have to plan for failure so much with missions of this type, and it’s quite an exhilarating but in some ways stressful ride, and one that after Phoenix I felt like I needed to pass the mantle on to for Curiosity.
NH – On the topic of Planetary Resources, when did you start to think about being part of a company of this magnitude?
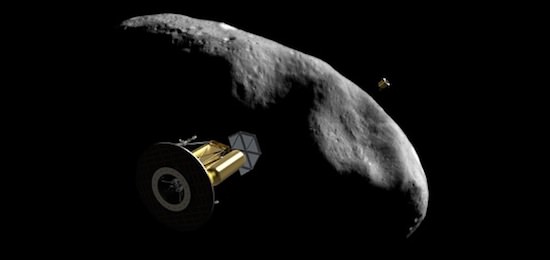
Artist concept of the ARKYD spacecraft by an asteroid. Credit: Planetary Resources.
CL – Well working with Peter and Eric again was mooted as long ago as 2008, the company ideas being formulated then when it was called Arkyd Astronautics, a name which stuck with us until 2012. Eric and Peter approached me about possibly coming back. As I said, I’d pretty much resigned myself to not working on Curiosity, and having to put myself through all of the phases associated with that landing, and there’s a quote which many people believe comes from Mark Twain, but is really from Jackson Brown, that basically says
“Twenty years from now you will be more disappointed by the things that you didn’t do than by the ones you did do. So throw off the bowlines. Sail away from the safe harbor. Catch the trade winds in your sails. Explore. Dream. Discover” I decided to throw off the bowlines and set sail with Planetary Resources.
NH – How do you see your relationship with a company like Planetary Resources with the major space agencies? Do you see yourselves as complimenting them or competing?
CL – Complimenting totally. NASA has over 50 years of incredible exploration, missions, research, development and insight, and a great future ahead of them too. With NASA recently transferring some of their low Earth orbit operations in to the commercial sector, we feel that this is really a great time to be in this industry, with our goals for being at the forefront of the types of science and commercial operations that the business sector can excel in, leaving NASA to focus on the amazing deep space missions, like landing on Europa or going back to Titan, missions like that, which only the large government agencies can really pull off at this time.
NH – The Arkyd has to be one of the most staggering Kickstarter success stories ever, raising aaround $800,000 in a week…did you imagine that the reaction to putting a space telescope available for all in to orbit would garner so much enthusiasm?
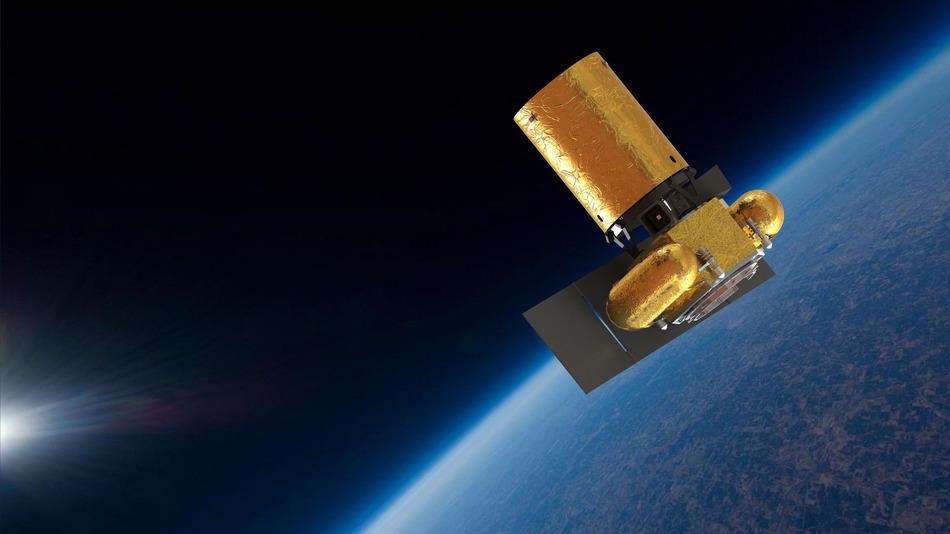
Artist concept of the ARKYD telescope in space. Credit: Planetary Resources.
CL – Staggering again doesn’t really do it enough justice. This is the biggest space based Kickstarter in their history, as it’s also in the photography category; it’s the biggest photographic Kickstarter ever too. We have many more surprises planned which I can’t go in to now, but in setting the $1 million minimum bar to “test the water” with public interest in a space telescope, we’ve not really exceeded expectations, but absolutely reached what we felt was possible. From talking to people ahead of the launch, and just seeing their reaction (note from author, I was one of those people, and my reaction was jaw dropping) we knew we had something really special. The idea of the space selfie we felt was part of the cornerstone of what we wanted to achieve, opening up space to everyone, not just the real die hard space enthusiasts.
NH – With the huge initial success of the Arkyd project, do you see any scope for a flotilla of space telescopes for the public, much like say the LCOGT or iTelescope networks are on Earth?
CL – Possibly in the future. You yourself know with your work with the Las Cumbres and Faulkes network and iTelescope networks that having a suite of telescopes around the planet has huge benefits when it comes to observations and science. At present we have the plan for one telescope for public use as you know.
The Arkyd 100, which will be utilising our Arkyd technologies, which we’ll be using to examine near Earth asteroids. If you think, that in the last 100 years, the Hale’s, Lowell’s etc of this world were all private individuals sponsoring and building amazing instruments for space exploration, it’s really just a natural progression on from this. We’re partnering closely with the Planetary Society on this, as they have common goals and interests to us, and also with National Geographic. We feel this really does open up space to a whole new group of people, and it’s apparent from the phenomenal interest we’ve had from Kickstarter, and the thousands of people who’ve pledged their support, that this vision was right.
NH – Planetary Resources has some huge goals in terms of asteroids in future, but you seem to have a very balanced and phased scientific plan to study and then proceed to the larger scale operations. Does this come from your science background?
CL – As I said, I grew up in dairy country in Wisconsin, where I had to really make my own opportunities be a part of this industry, there was no space there. On saying that, I have been an advocate of space pretty much all my life, and yes, I guess my scientific background, and experience with working at JPL has come to bear in Planetary Resources. We have a solid plan in terms of risk management with our “swarm” mentality, of sending up lots of spacecraft, and even if one or more fails, we’ll still be able to get valuable science data. I see it really in that lots of people have big ideas, and set up companies with them, but then after initial investment dries up, the ideas may still be big and there, but there is no way to pursue them.
We’ve all come from companies which have seen this kind of mindset in the past, and now, whilst we love employing students and college graduates who have big ideas, who take chances, we have a plan, a long term, and sustainable plan, and yes, we’re taking a steady approach to this, so that we can guarantee that our investors get a return on what they have supported.
NH – Can you give us a timeline for what Planetary Resources aim to achieve?
CL – Our first test launch will be as early as 2014, and then in 2015 we’ll start with the space telescopes using the Arkyd technology. By 2017 we hope to be identifying and on our way to classification of potentially interesting NEO targets for future mining. By the early 2020’s the aim is to be doing extraction from asteroids, and starting sample return missions.
NH – You were and still it seems from all I have read, remain passionate about student involvement, with SEDS etc, what could you say to younger people inspired by what you’re doing to encourage them to get in to the space industry?
CL – Tough one, but I’d say that looking at the people you admire, always remember that they are not superhuman, they are like you and me, but to have goals, take chances and be determined is a great way to look forward. The SEDS movement played a big part in my early life, and I would encourage any student to get involved in that for sure.
NH – In conclusion, what would be your ultimate goal as a pioneer of the new frontier in space exploration?
CL – Our ultimate goal is to be the developer of the economic engine that makes space exploration commercially viable. Once we have established that, we can then look at more detailed exploration of space, with tourism, scientific missions, and extending our reach out even further. I’ve already been a part of placing three missions on the surface of Mars, so nothing really is beyond our reach.
Nick’s closing comments :
I first met Chris at the Spacefest V conference in Tucson, where he gave me a preview of the Arkyd space telescope. There is no doubt in my mind that after meeting him, that he and the team at Planetary Resources will succeed in their mission. A quite brilliant individual, but humble with it, someone who you can spend hours talking to and come away feeling truly inspired. This interview we talked for what seemed like hours, and Chris said I could have written a book with the answers he gave, I hope this article gives you some taste however of the person behind the missions which, at the new frontier of exploration, much like the prospectors in the Gold Rush, are charting new and unknown, yet hugely exiting territories. As the old saying goes…and possibly more aptly then ever… watch this space.
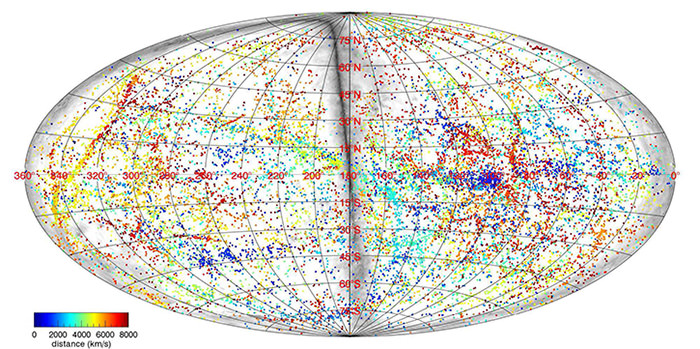
Map showing all galaxies in the local universe color-coded by their distance to us: blue galaxies are the closest, and red are farther, up to 300 million light-years away. Credit: University of Hawaii.
Researchers with the Cosmic Flows project have been working to map both visible and dark matter densities around our Milky Way galaxy up to a distance of 300 million light-years, and they’ve now released this new video map which shows the motions of structures of the nearby Universe in greater detail than ever before.
“The complexity of what we are seeing is almost overwhelming,” says researcher Hélène Courtois, associate professor at the University of Lyon, France, and associate researcher at the Institute for Astronomy (IfA), University of Hawaii (UH) at Manoa. Courtois narrates the video.
The video zooms into our local area of the Universe — our Milky Way galaxy lies in a supercluster of 100,000 galaxies — and then slowly draws back to show the cosmography of the Universe out to 300 million light years.
The map shows how the large-scale structure of the Universe is a complex web of clusters, filaments, and voids. Large voids are bounded by filaments that form superclusters of galaxies. These are the largest structures in the universe.
The team explains:
The movements of the galaxies reveal information about the main constituents of the Universe: dark energy and dark matter. Dark matter is unseen matter whose presence can be deduced only by its effect on the motions of galaxies and stars because it does not give off or reflect light. Dark energy is the mysterious force that is causing the expansion of the universe to accelerate.
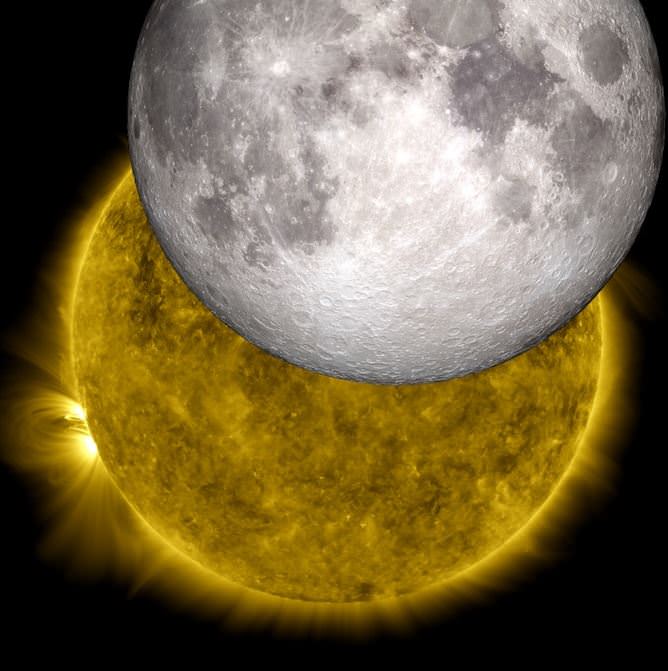
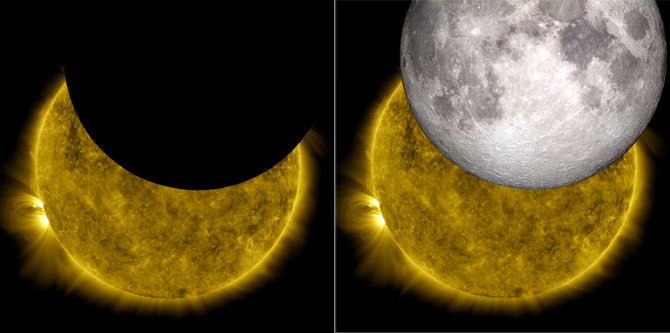
This is an image of a unique eclipse as viewed by NASA's Solar Dynamics Observatory, with a model of the moon from NASA's Lunar Reconnaissance Orbiter replacing the lunar shadow. Credit: NASA/SDO/LRO/GSFC
You’ve probably never before seen an image like the one above. That’s because it is the first time something like this has ever been created, and it is only possible thanks to two fairly recent NASA missions, the Solar Dynamics Observatory and the Lunar Reconnaissance Orbiter. We’ve shared previously how two or three times a year, SDO goes through “eclipse season” where it observes the Moon traveling across the Sun, blocking its view.
Now, Scott Wiessinger and Ernie Wright from Goddard Space Flight Center’s Scientific Visualization Studio used SDO and LRO data to create a model of the Moon that exactly matches SDO’s perspective of a lunar transit from October 7, 2010. They had to precisely match up data from the correct time and viewpoint for the two separate spacecraft, and the end result is this breathtaking image of the Sun and the Moon.
“The results look pretty neat,” Wiessinger said via email, “and it’s a great example of everything working: SDO image header data, which contains the spacecraft’s position; our information about lunar libration, elevation maps of the lunar surface, etc. It all lines up very nicely.”
‘Nicely’ is an understatement. How about “freaking awesome!”
And of course, they didn’t just stop there.
his is an up close shot of two NASA images: An image rendered from a model of the moon from the Lunar Reconnaissance Orbiter overlaid onto an image of the sun from the Solar Dynamics Observatory, during a lunar transit as seen by SDO on Oct. 7, 2010. The various features of the moon’s horizon are labeled. Credit: NASA/SDO/LRO/GSFC
Since the data from both spacecraft are at such high resolution, if you zoom in to the LRO image, features of the Moon’s topography are visible, such as mountains and craters. This annotated image shows what all is visible on the Moon. And then there’s the wonderful and completely unique view in the background of SDO’s data of the Sun.
So while the imagery is awesome, this exercise also means that both missions are able to accurately provide images of what’s happening at any given moment in time.
The image on the left is a view of the sun captured by NASA’s Solar Dynamics Observatory on Oct. 7, 2010, while partially obscured by the moon. Looking closely at the crisp horizon of the moon against the sun shows the outline of lunar mountains. A model of the moon from NASA’s Lunar Reconnaissance Orbiter has been inserted into a picture on the right, showing how perfectly the moon’s true topography fits into the shadow observed by SDO. Credit: NASA/SDO/LRO/GSFC
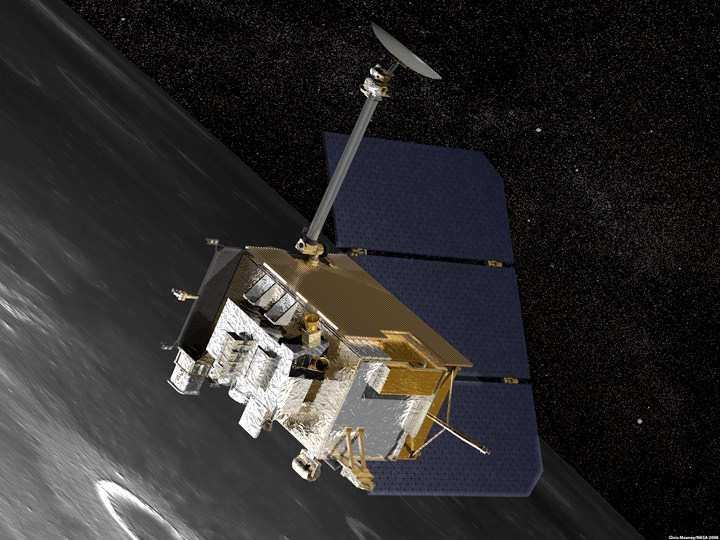
The CRaTER instrument aboard NASA's Lunar Reconnaissance Orbiter measures the effect of cosmic rays on "human tissue-equivalent" plastic. (NASA)
It could work, say researchers from the University of New Hampshire and the Southwest Research Institute.
One of the inherent dangers of space travel and long-term exploration missions beyond Earth is the constant barrage of radiation, both from our own Sun and in the form of high-energy particles originating from outside the Solar System called cosmic rays. Extended exposure can result in cellular damage and increased risks of cancer at the very least, and in large doses could even result in death. If we want human astronauts to set up permanent outposts on the Moon, explore the dunes and canyons of Mars, or mine asteroids for their valuable resources, we will first need to develop adequate (and reasonably economical) protection from dangerous space radiation… or else such endeavors will be nothing more than glorified suicide missions.
While layers of rock, soil, or water could protect against cosmic rays, we haven’t yet developed the technology to hollow out asteroids for spaceships or build stone spacesuits (and sending large amounts of such heavy materials into space isn’t yet cost-effective.) Luckily, there may be a much easier way to protect astronauts from cosmic rays — using lightweight plastics.
While aluminum has always been the primary material in spacecraft construction, it provides relatively little protection against high-energy cosmic rays and can add so much mass to spacecraft that they become cost-prohibitive to launch.
Using observations made by the Cosmic Ray Telescope for the Effects of Radiation (CRaTER) orbiting the Moon aboard LRO, researchers from UNH and SwRI have found that plastics, adequately designed, can provide better protection than aluminum or other heavier materials.
“This is the first study using observations from space to confirm what has been thought for some time—that plastics and other lightweight materials are pound-for-pound more effective for shielding against cosmic radiation than aluminum,” said Cary Zeitlin of the SwRI Earth, Oceans, and Space Department at UNH. “Shielding can’t entirely solve the radiation exposure problem in deep space, but there are clear differences in effectiveness of different materials.”
Zeitlin is lead author of a paper published online in the American Geophysical Union journal Space Weather.
A block of tissue-equivalent plastic (TEP) Credit: UNH
The plastic-aluminum comparison was made in earlier ground-based tests using beams of heavy particles to simulate cosmic rays. “The shielding effectiveness of the plastic in space is very much in line with what we discovered from the beam experiments, so we’ve gained a lot of confidence in the conclusions we drew from that work,” says Zeitlin. “Anything with high hydrogen content, including water, would work well.”
The space-based results were a product of CRaTER’s ability to accurately gauge the radiation dose of cosmic rays after passing through a material known as “tissue-equivalent plastic,” which simulates human muscle tissue.
(It may not look like human tissue, but it collects energy from cosmic particles in much the same way.)
Prior to CRaTER and recent measurements by the Radiation Assessment Detector (RAD) on the Mars rover Curiosity, the effects of thick shielding on cosmic rays had only been simulated in computer models and in particle accelerators, with little observational data from deep space.
The CRaTER observations have validated the models and the ground-based measurements, meaning that lightweight shielding materials could safely be used for long missions — provided their structural properties can be made adequate to withstand the rigors of spaceflight.
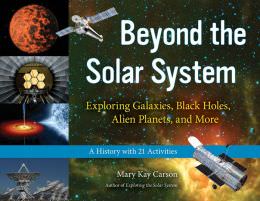
In reviewing the book “Beyond the Solar System: Exploring Galaxies, Black Holes, Alien Planets, and More; A History with 21 Activities” by Mary Kay Carson, UT writer Eva Gallant described it as “written for children and for the inquisitive child within us.”
Thanks to the publisher, Universe Today has three free copies of this book to giveaway — perfect for the kids in your life (even if that’s you!)
This contest will run for a week starting today, so get your entries in! How?
In order to be entered into the giveaway drawing, just put your email address into the box at the bottom of this post (where it says “Enter the Giveaway”) before Monday, June 19, 2013. We’ll send you a confirmation email, so you’ll need to click that to be entered into the drawing.
We’re only going to use these email addresses for Universe Today giveaways/contests and announcements. We won’t be using them for any other purpose, and we definitely won’t be selling the addresses to anyone else. Once you’re on the giveaway notification list, you’ll be able to unsubscribe any time you like.
It is probably a safe bet that even as children, Universe Today readers gazed at the night sky with awe and wonder. Did you wish upon the first star light, star bright in the sky? Cultures across time have spun tales around constellations – images projected on the night’s expanse based on our perceptions. As science and technology progressed we realized the vast depths of space are truly full of wonder. There’s an incredible array of amazing things to be discovered, researched and understood.
The images within the chapters are well appointed. For example, at the beginning of the book during a journey from prehistory-1600 you’ll find a fantastic Library of Congress image of the Great Bear constellation, joined by the British Library’s ancient Chinese Star Map, that dates back to the 600’s A.D. This reviewer will definitely be trying some of the activities explained among the chapters such as “Make a 3-D Starscape” found on page 32. This craft project demonstrates the artificial grouping we’ve given our constellations and shows that they are actually comprised of stars great distances from each other and us.
Perhaps the best review of this book comes from my 8 year old daughter. For the past week, she has been reading this book in the car while travelling to school. A recent morning’s question from the back seat was “What’s a pulsar?” She’s excited to try all of the activities; first up will be making a radio picture found on page 82 or turning a friend into a pulsar by spinning them in a chair with two flashlights on page 89. In addition to her “two thumbs” up eagerness to read this every morning, she simply stated “I love this book.”
I extend a thank you to the author for creating a fun, educational STEM source that attracted not only the attention of my science oriented 14 year old boy, but also my daughter, who is as equally bright, capable and curious about the world around her.