Building the Alpha Magnetic Spectrometer: 16 Years in 3 Minutes

Endeavour approaches the International Space Station. Visible is the Alpha Magnetic Spectrometer in the payload bay. Credit: NASA

The Alpha Magnetic Spectrometer on board the International Space Station released its first results today (read about them here) after having been in space since 2011. But this particle physics experiment was years in the making. In just 3 minutes, you can watch 16 years of building, preparing, launching and activating this detector.

Below, watch another video from NASA that provides an overview of the AMS:

Wrapping Around The Mystery Of Spiral Galaxy Arms

Credit: Thiago Ize & Chris Johnson (Scientific Computing and Imaging Institute)

How disk galaxies form their spiral arms have been puzzling astrophysicists for almost as long as they have been observing them. With time, they have come to two conclusions… either this structure is caused by differences in gravity sculpting the gas, dust and stars into this familiar shape, or its just a random occurrence which comes and goes with time.

Now researchers are beginning to wrap their conclusions around findings based on new supercomputer simulations – simulations which involve the motion of up to 100 million “stellar particles” that mimic gravitational and astrophysical forces which shape them into natural spiral structure. The research team from the University of Wisconsin-Madison and the Harvard-Smithsonian Center for Astrophysics are excited about these conclusions and report the simulations may hold the essential clues of how spiral arms are formed.

“We show for the first time that stellar spiral arms are not transient features, as claimed for several decades,” says UW-Madison astrophysicist Elena D’Onghia, who led the new research along with Harvard colleagues Mark Vogelsberger and Lars Hernquist.

“The spiral arms are self-perpetuating, persistent, and surprisingly long lived,” adds Vogelsberger.

When it comes to spiral structure, it’s probably the most widely occurring of universal shapes. Our own Milky Way galaxy is considered to be a spiral galaxy and around 70% of the galaxies near to us are also spiral structured. When we think in a broader sense, just how many things take on this common formation? Whisking up dust with a broom causes particles to swirl into a spiral shape… draining water invokes a swirling pattern… weather formations go spiral. It’s a universal happening and it happens for a reason. Apparently that reason is gravity and something to perturb it. In the case of a galaxy, it’s a giant molecular cloud – the star-forming regions. Introduced into the simulation, the clouds, says D’Onghia, a UW-Madison professor of astronomy, act as “perturbers” and are enough to not only initiate the formation of spiral arms but to sustain them indefinitely.

“We find they are forming spiral arms,” explains D’Onghia. “Past theory held the arms would go away with the perturbations removed, but we see that (once formed) the arms self-perpetuate, even when the perturbations are removed. It proves that once the arms are generated through these clouds, they can exist on their own through (the influence of) gravity, even in the extreme when the perturbations are no longer there.”

So, what of companion galaxies? Can spiral structure be caused by proximity? The new research also takes that into account and models for “stand alone” galaxies as well. However, that’s not all the study included. According to Vogelsberger and Hernquist, the new computer-generated simulations are focusing on clarifying observational data. They are taking a closer look at the high-density molecular clouds and the “gravitationally induced holes in space” which act as ” the mechanisms that drive the formation of the characteristic arms of spiral galaxies.”

Until then, we know spiral structure isn’t just a chance happening and – to wrap things up – it’s probably the most common form of galaxy in our Universe.

Original Story Source: Harvard-Smithsonian Center for Astrophysics.

Space Station Detector Finds Extra Antimatter in Space, Maybe Dark Matter

From its vantage point about 400 km above Earth on the International Space Station, the Alpha Magnetic Spectrometer collects data from primordial cosmic rays from space. Credit: NASA

The first results from the largest and most complex scientific instrument on board the International Space Station has provided tantalizing hints of nature’s best-kept particle secrets, but a definitive signal for dark matter remains elusive. While the AMS has spotted millions of particles of antimatter – with an anomalous spike in positrons — the researchers can’t yet rule out other explanations, such as nearby pulsars.

“These observations show the existence of new physical phenomena,” said AMS principal investigator Samuel Ting,” and whether from a particle physics or astrophysical origin requires more data. Over the coming months, AMS will be able to tell us conclusively whether these positrons are a signal for dark matter, or whether they have some other origin.”

The positron fraction measured by AMS. Credit: CERN.

The AMS was brought to the ISS in 2011 during the final flight of space shuttle Endeavour, the penultimate shuttle flight. The $2 billion experiment examines ten thousand cosmic-ray hits every minute, searching for clues into the fundamental nature of matter.

During the first 18 months of operation, the AMS collected of 25 billion events. It found an anomalous excess of positrons in the cosmic ray flux — 6.8 million are electrons or their antimatter counterpart, positrons.

The AMS found the ratio of positrons to electrons goes up at energies between 10 and 350 gigaelectronvolts, but Ting and his team said the rise is not sharp enough to conclusively attribute it to dark matter collisions. But they also found that the signal looks the same across all space, which would be expected if the signal was due to dark matter – the mysterious stuff that is thought to hold galaxies together and give the Universe its structure.

Additionally, the energies of these positrons suggest they might have been created when particles of dark matter collided and destroyed each other.

A screenshot from Ting's presentation at CERN on April 3, 2013. 'It took us 18 years to complete this result,' Ting said.
A screenshot from Ting’s presentation at CERN on April 3, 2013. ‘It took us 18 years to complete this result,’ Ting said.

The AMS results are consistent with the findings of previous telescopes, like the Fermi and PAMELA gamma-ray instruments, which also saw a similar rise, but Ting said the AMS results are more precise.

The results released today do not include the last 3 months of data, which have not yet been processed.

“As the most precise measurement of the cosmic ray positron flux to date, these results show clearly the power and capabilities of the AMS detector,” Ting said.

Cosmic rays are charged high-energy particles that permeate space. An excess of antimatter within the cosmic ray flux was first observed around two decades ago. The origin of the excess, however, remains unexplained. One possibility, predicted by a theory known as supersymmetry, is that positrons could be produced when two particles of dark matter collide and annihilate. Ting said that over the coming years, AMS will further refine the measurement’s precision, and clarify the behavior of the positron fraction at energies above 250 GeV.

Although having the AMS in space and away from Earth’s atmosphere – allowing the instruments to receive a constant barrage of high-energy particles — during the press briefing, Ting explained the difficulties of operating the AMS in space. “You can’t send a student to go out and fix it,” he quipped, but also added that the ISS’s solar arrays and the departure and arrival of the various spacecraft can have an effect on thermal fluctuations the sensitive equipment might detect. “You need to monitor and correct the data constantly or you are not getting accurate results,” he said.

Despite recording over 30 billion cosmic rays since AMS-2 was installed on the International Space Station in 2011, the Ting said the findings released today are based on only 10% of the readings the instrument will deliver over its lifetime.

Asked how much time he needs to explore the anomalous readings, Ting just said, “Slowly.” However, Ting will reportedly provide an update in July at the International Cosmic Ray Conference.

More info: CERN press release, the team’s paper: First Result from the Alpha Magnetic Spectrometer on the International Space Station: Precision Measurement of the Positron Fraction in Primary Cosmic Rays of 0.5–350 GeV

Astrophotos: We Have Liftoff from the Sun!

A large prominence from the Sun, on April 1, 2013. Credit and copyright: Paul Andrew.

Here are three images showing large prominences recently lifting off from the Sun’s surface. Solar prominences are sheets or arcs of luminous gas emanating from the Sun’s surface. They can loop hundreds of thousands of kilometers into space. In the image below by noted Australian amatuer Monty Leventhal, he estimates the prominence he captured stretches 233,000 km! Against the Sun, prominences appear dark, but against the sky they appear brighter. Prominences are held above the Sun’s surface by strong magnetic fields and can sometimes last for long periods of time.

See more and varied views below:

A negative image of the Sun and large prominences on March 31, 2013. Credit and copyright: César Cantú.
This digital filtergram shows an active prominence on the SE limb of the Sun, stretching across for approximately 233,000 km on March 27, 2013. Credit and copyright: Monty Leventhal.

Want to get your astrophoto featured on Universe Today? Join our Flickr group or send us your images by email (this means you’re giving us permission to post them). Please explain what’s in the picture, when you took it, the equipment you used, etc.

How Big Are Galaxies?

Galaxy size comparison chart by astrophysicist Rhys Taylor

I’m going to refrain from the initial response that comes to mind… actually, no I won’t — they’re really, really, really big!!!!

</Kermit arms>

Ok, now that that’s out of the way check out this graphic by Arecibo astrophysicist Rhys Taylor, which neatly illustrates the relative sizes of 25 selected galaxies using images made from NASA and ESA observation missions… including a rendering of our own surprisingly mundane Milky Way at the center for comparison. (Warning: this chart may adversely affect any feelings of bigness you may have once held dear.) According to Taylor on his personal blog, Physicists of the Caribbean (because he works had worked at the Arecibo Observatory in Puerto Rico) “Type in ‘asteroid sizes’ into Google and you’ll quickly find a bunch of  images comparing various asteroids, putting them all next to each at the same scale. The same goes for planets and stars. Yet the results for galaxies are useless. Not only do you not get any size comparisons, but scroll down even just a page and you get images of smartphones, for crying out loud.” So to remedy that marked dearth of galactic comparisons, Taylor made his own. Which, if you share my personal aesthetics, you’ll agree is quite nicely done.

“I tried to get a nice selection of well-known, interesting objects,” Taylor explains. “I was also a little limited in that I needed high-resolution images which completely mapped the full extent of each object… still, I think the final selection has a decent mix, and I reckon it was a productive use of a Saturday.” And even with the dramatic comparisons above, Taylor wasn’t able to accurately portray to scale one of the biggest — if not the biggest — galaxies in the observable universe: IC 1101.

For an idea of how we measure up to that behemoth, he made this graphic:

Galaxy sizes including IC 1101, the largest-known galaxy. Click for a zoomable version. (Credit: Rhys Taylor)

That big bright blur in the center? That’s IC 1101, the largest known galaxy — in this instance created by scaling up an image of M87, another supersized elliptical galaxy that just happens to be considerably closer to our own (and thus has had clearer images taken of it.) But the size is right — IC 1101 is gargantuan.

At an estimated 5.5 million light-years wide, over 50 Milky Ways could fit across it! And considering it takes our Solar System about 225 million years to complete a single revolution around the Milky Way… well… yeah. Galaxies are big. Really, really, reallyreally big!

</Kermit arms>

Now if you’ll pardon me, I need to go stop my head from spinning… Read this and more on Rhys Taylor’s blog here, and add Rhys to your awesome astronomy Google+ circles here. And you can find out more about IC 1101 in the video below from Tony Darnell, aka DeepAstronomy:

Earth Month: NASA Launches New Interactive Image Gallery

Ice sheet loss increasing at both poles. Image credit: Ian Joughin, University of Washington.

In honor of Earth month, NASA has launched a beautiful new interactive image gallery that explores and highlights our latest understanding of Earth science and our changing planet. Included are spectacular images and visualizations to help understand the latest findings.

Included is information on the decline of sea ice in the Arctic, a visualization of global aerosols, images of the latest storms, and much more.

Check out the “Earth Month 2013” website.

First-Ever High Resolution Radio Images of Supernova 1987A

An overlay of radio emission (contours) and a Hubble space telescope image of Supernova 1987A. Credit: ICRAR (radio contours) and Hubble (image.)

On February 23, 1987, the brightest extragalactic supernova in history was seen from Earth. Now 26 years later, astronomers have taken the highest resolution radio images ever of the expanding supernova remnant at extremely precise millimeter wavelengths. Using the Australia Telescope Compact Array radio telescope in New South Wales, Australia, Supernova 1987A has been now observed in unprecedented detail. The new data provide some unique imagery that takes a look at the different regions of the supernova remnant.

“Not only have we been able to analyze the morphology of Supernova 1987A through our high resolution imaging, we have compared it to X-ray and optical data in order to model its likely history,” said Bryan Gaensler, Director of CAASTRO (Centre for All-sky Astrophysics) at the University of Sydney.

Radio image at 7 mm. Credit: ICRAR Radio image of the remnant of SN 1987A produced from observations performed with the Australia Telescope Compact Array (ATCA).
Radio image at 7 mm. Credit: ICRAR
Radio image of the remnant of SN 1987A produced from observations performed with the Australia Telescope Compact Array (ATCA).

SN 1987A has been on one of the most-studied astronomical objects, as its “close” proximity in the Large Magellanic Cloud allows it to be a focus for researchers around the world. Astronomers says it has provided a wealth of information about one of the Universe’s most extreme events.

“Imaging distant astronomical objects like this at wavelengths less than 1 centimetre demands the most stable atmospheric conditions,” said lead author, Giovanna Zanardo of ICRAR, the International Center for Radio Astronomy Research. “For this telescope these are usually only possible during cooler winter conditions but even then, the humidity and low elevation of the site makes things very challenging,”

Unlike optical telescopes, a radio telescope can operate in the daytime and can peer through gas and dust allowing astronomers to see the inner workings of objects like supernova remnants, radio galaxies and black holes.

“Supernova remnants are like natural particle accelerators, the radio emission we observe comes from electrons spiraling along the magnetic field lines and emitting photons every time they turn. The higher the resolution of the images the more we can learn about the structure of this object,” said Professor Lister Staveley-Smith, Deputy Director of ICRAR and CAASTRO.

An RGB overlay of the supernova remnant. Credit: ICRAR A Red/Green/Blue overlay of optical, X-Ray and radio observations made by 3 different telescopes. In red are the 7-mm (44GHz) observations made with the Australian Compact Array in New South Wales, in green are the optical observations made by the Hubble Space Telescope, and in blue is an X-ray view of the remnant, observed by Nasa's space based Chandra X-ray Observatory.
An RGB overlay of the supernova remnant. Credit: ICRAR
A Red/Green/Blue overlay of optical, X-Ray and radio observations made by 3 different telescopes. In red are the 7-mm (44GHz) observations made with the Australian Compact Array in New South Wales, in green are the optical observations made by the Hubble Space Telescope, and in blue is an X-ray view of the remnant, observed by Nasa’s space based Chandra X-ray Observatory.

Scientists study the evolution of supernovae into supernova remnants to gain an insight into the dynamics of these massive explosions and the interaction of the blast wave with the surrounding medium.

The team suspects a compact source or pulsar wind nebula to be sitting in the centre of the radio emission, implying that the supernova explosion did not make the star collapse into a black hole. They will now attempt to observe further into the core and see what’s there.

Their paper was published in the Astrophysical Journal.

Source: ICRAR

NASA Trailer Achieves Crowdfunding Goal to Run Before Star Trek: Into Darkness

Here’s one bit of NASA outreach that won’t be affected by suspensions or sequesters: an edited version of “We Are The Explorers,” a video highlighting the past successes and future goals of the space administration — created by NASA and featuring an inspiring narration by Peter “Optimus Prime” Cullen — will be screened in several major U.S. cities during the premiere of Star Trek Into Darkness thanks to an overwhelmingly successful crowdfunding effort on Indiegogo.com.

Now that the initial goal of $33,000 has been met and the 30-second ad spot can be purchased, the team responsible for the campaign (Aerospace Industries Association of America) will use any funds donated during the next 29 days to reach its next target: getting the ad in at least one theater in every state in America for two weeks. In order for that to happen, a grand total of $94,000 will need to be reached.

Want to help make it so? Find out more about how you can contribute:

According to the Indiegogo campaign page, “If we raise our funding total to $94,000, students, young people, and the general public will see this video from coast to coast. This new goal will expand our reach from 59 movie theater screens to 750 screens!”

That means a lot more chances that the spot will run at the theater where you go to see the new Star Trek film when it comes out on May 17. (Because you know you’re going to go see it, let’s be honest. It’s Star Trek.)

And because it’s Indiegogo you’ll get a “perk” depending on the amount you contribute, ranging from digital copies of the final spot to DVD copies of the excellent HBO series “From Earth to the Moon” (while supplies last.) Because the initial goal has been met, some perks are already sold out… but then, contributing to something as important as space exploration isn’t about the stuff you get, it’s about the message you can give.

“This is more than a fundraiser, it’s a demonstration of support for space exploration programs. By donating to this campaign, you’re making a very powerful statement about the widespread enthusiam that exists for space programs. A crowdfunding campaign is the best vehicle to deliver this message. By reaching our goal, we not only enable a first-of-its-kind ad campaign, we also demonstrate that countless people support a strong space program that’s in development.”

You can contribute here, and be sure to spread the word too. That way, when you’re looking at the video on the big screen, when you see them putting Al Shepard’s gloves on, when you see the fiery exhaust of the Saturn rocket and you hear Cullen’s voice rumble “we are the explorers,” you can know that you helped make it happen — and that somewhere in that same theater a young mind may very well be inspired to continue the exploration.

Maybe that mind might even be be your own.

“Our next destination awaits. We don’t know what new discoveries lie ahead, but this is the very reason we must go.

This crowdfunding campaign is the work of the Aerospace Industries Association (AIA) of America. This campaign is not endorsed by NASA nor is it conducted at their direction or request. Note: by donating you acknowledge that donations are not tax deductible.

Astronomers Watch as a Black Hole Eats a Rogue Planet

Screen capture from the ESA video.

In Star Wars, the Millennium Falcon narrowly escaped being devoured by an exogorth (space slug) slumbering inside an asteroid crater. An unsuspecting rogue giant planet wasn’t as lucky. Astronomers using the Integral space observatory were able to watch as the planet was eaten by a black hole that had been inactive for decades. It woke up just in time to make a meal out of the unwary planet.

“The observation was completely unexpected, from a galaxy that has been quiet for at least 20–30 years,” says Marek Nikolajuk of the University of Bialystok, Poland, lead author of the paper in Astronomy & Astrophysics.

Nikolajuk and his team added that the event is a preview of a similar feeding event that is expected to take place with the black hole at the center of our own Milky Way Galaxy.

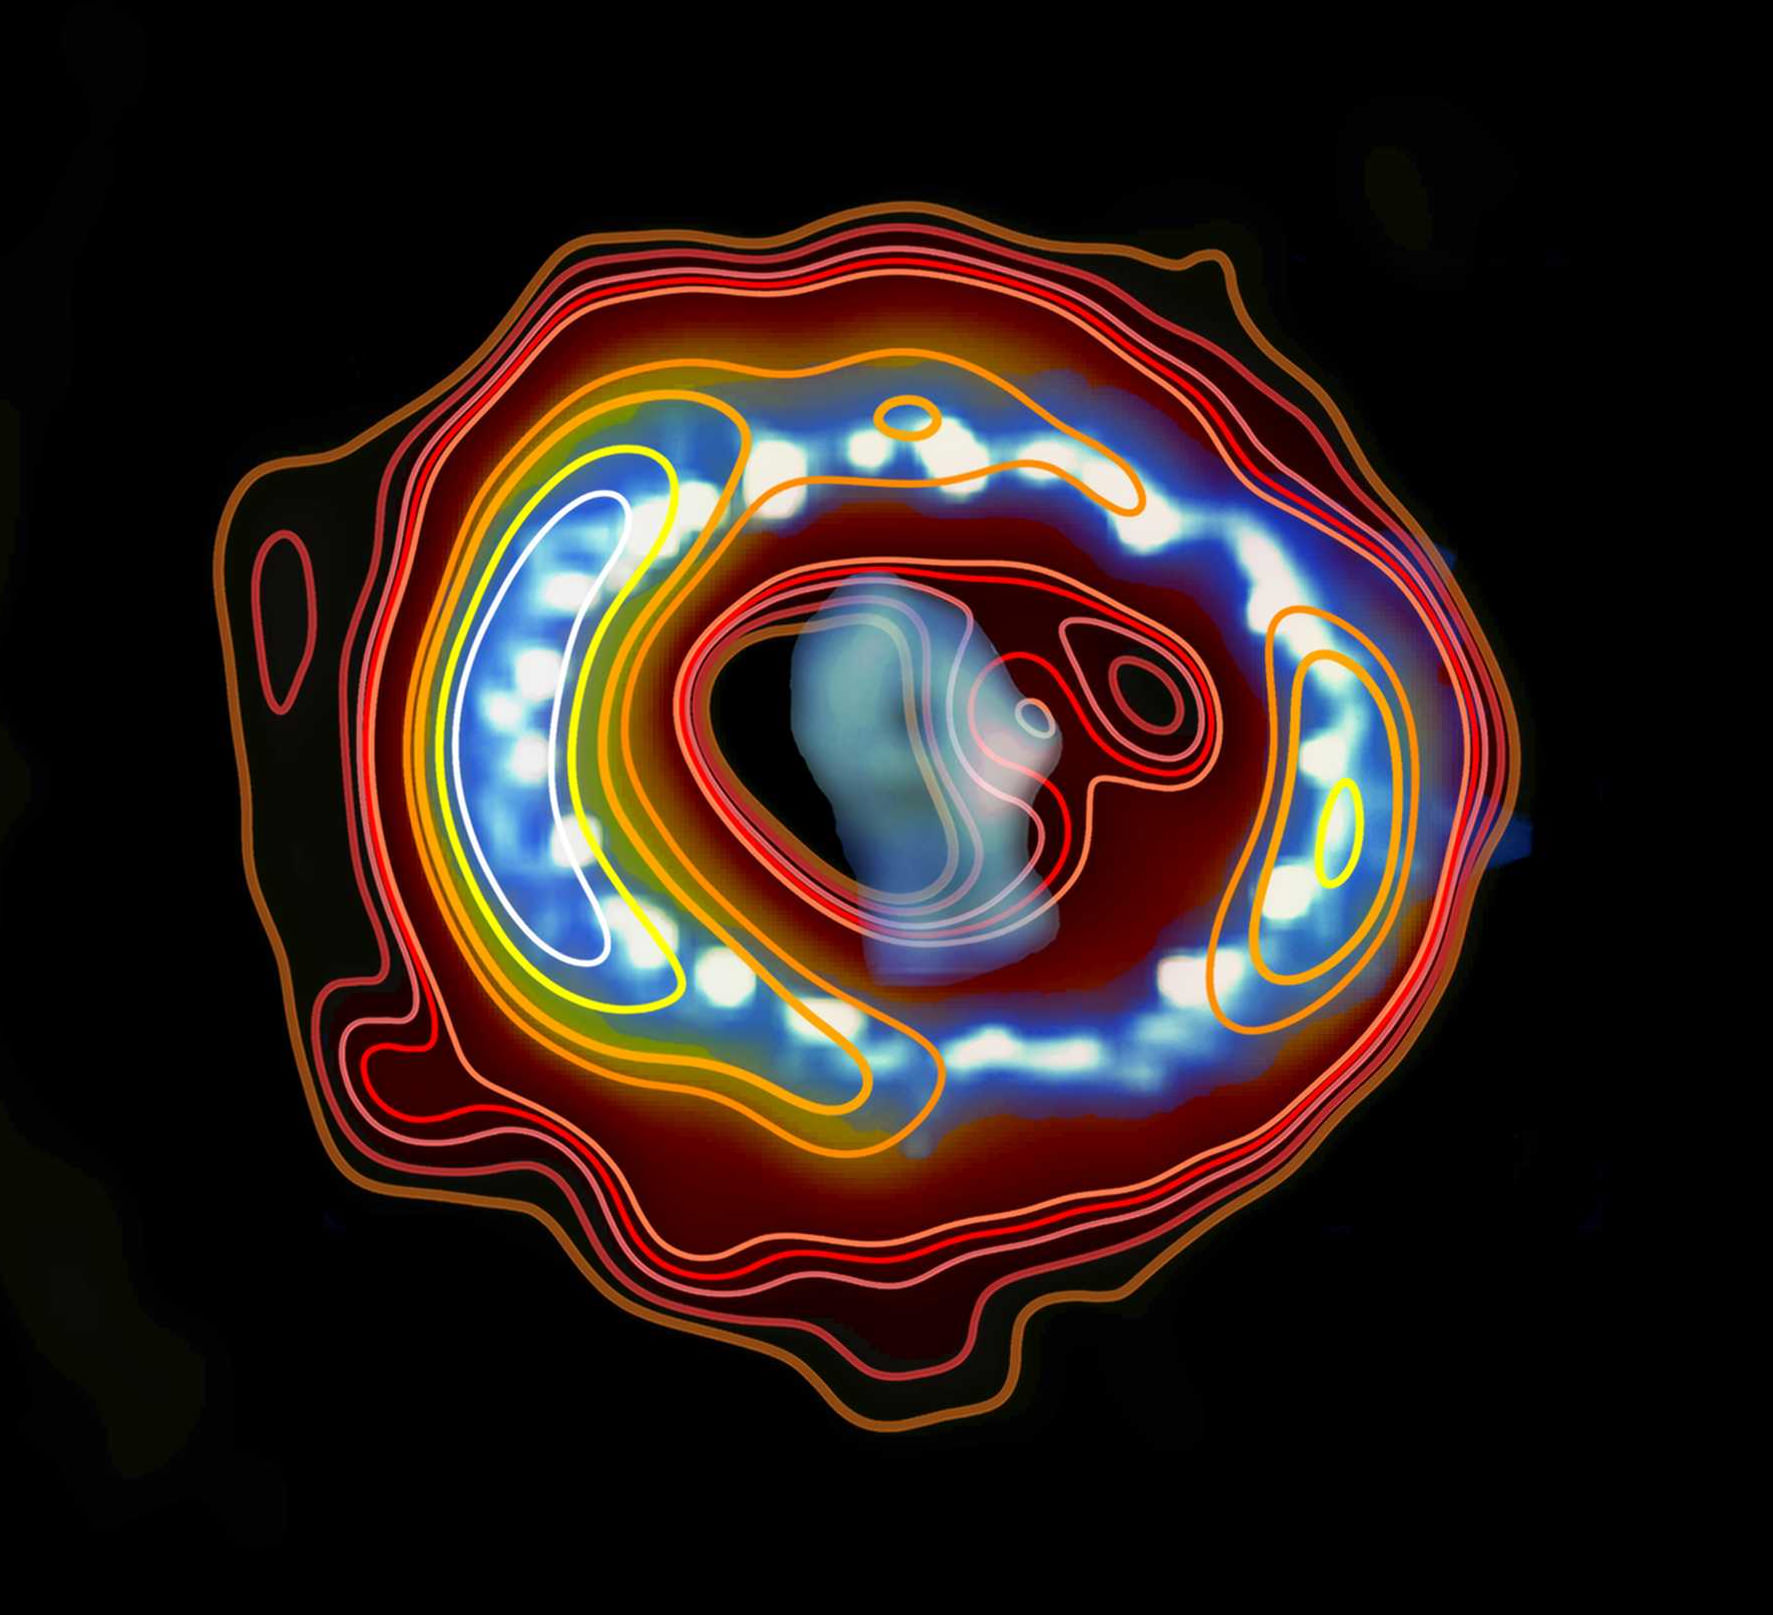
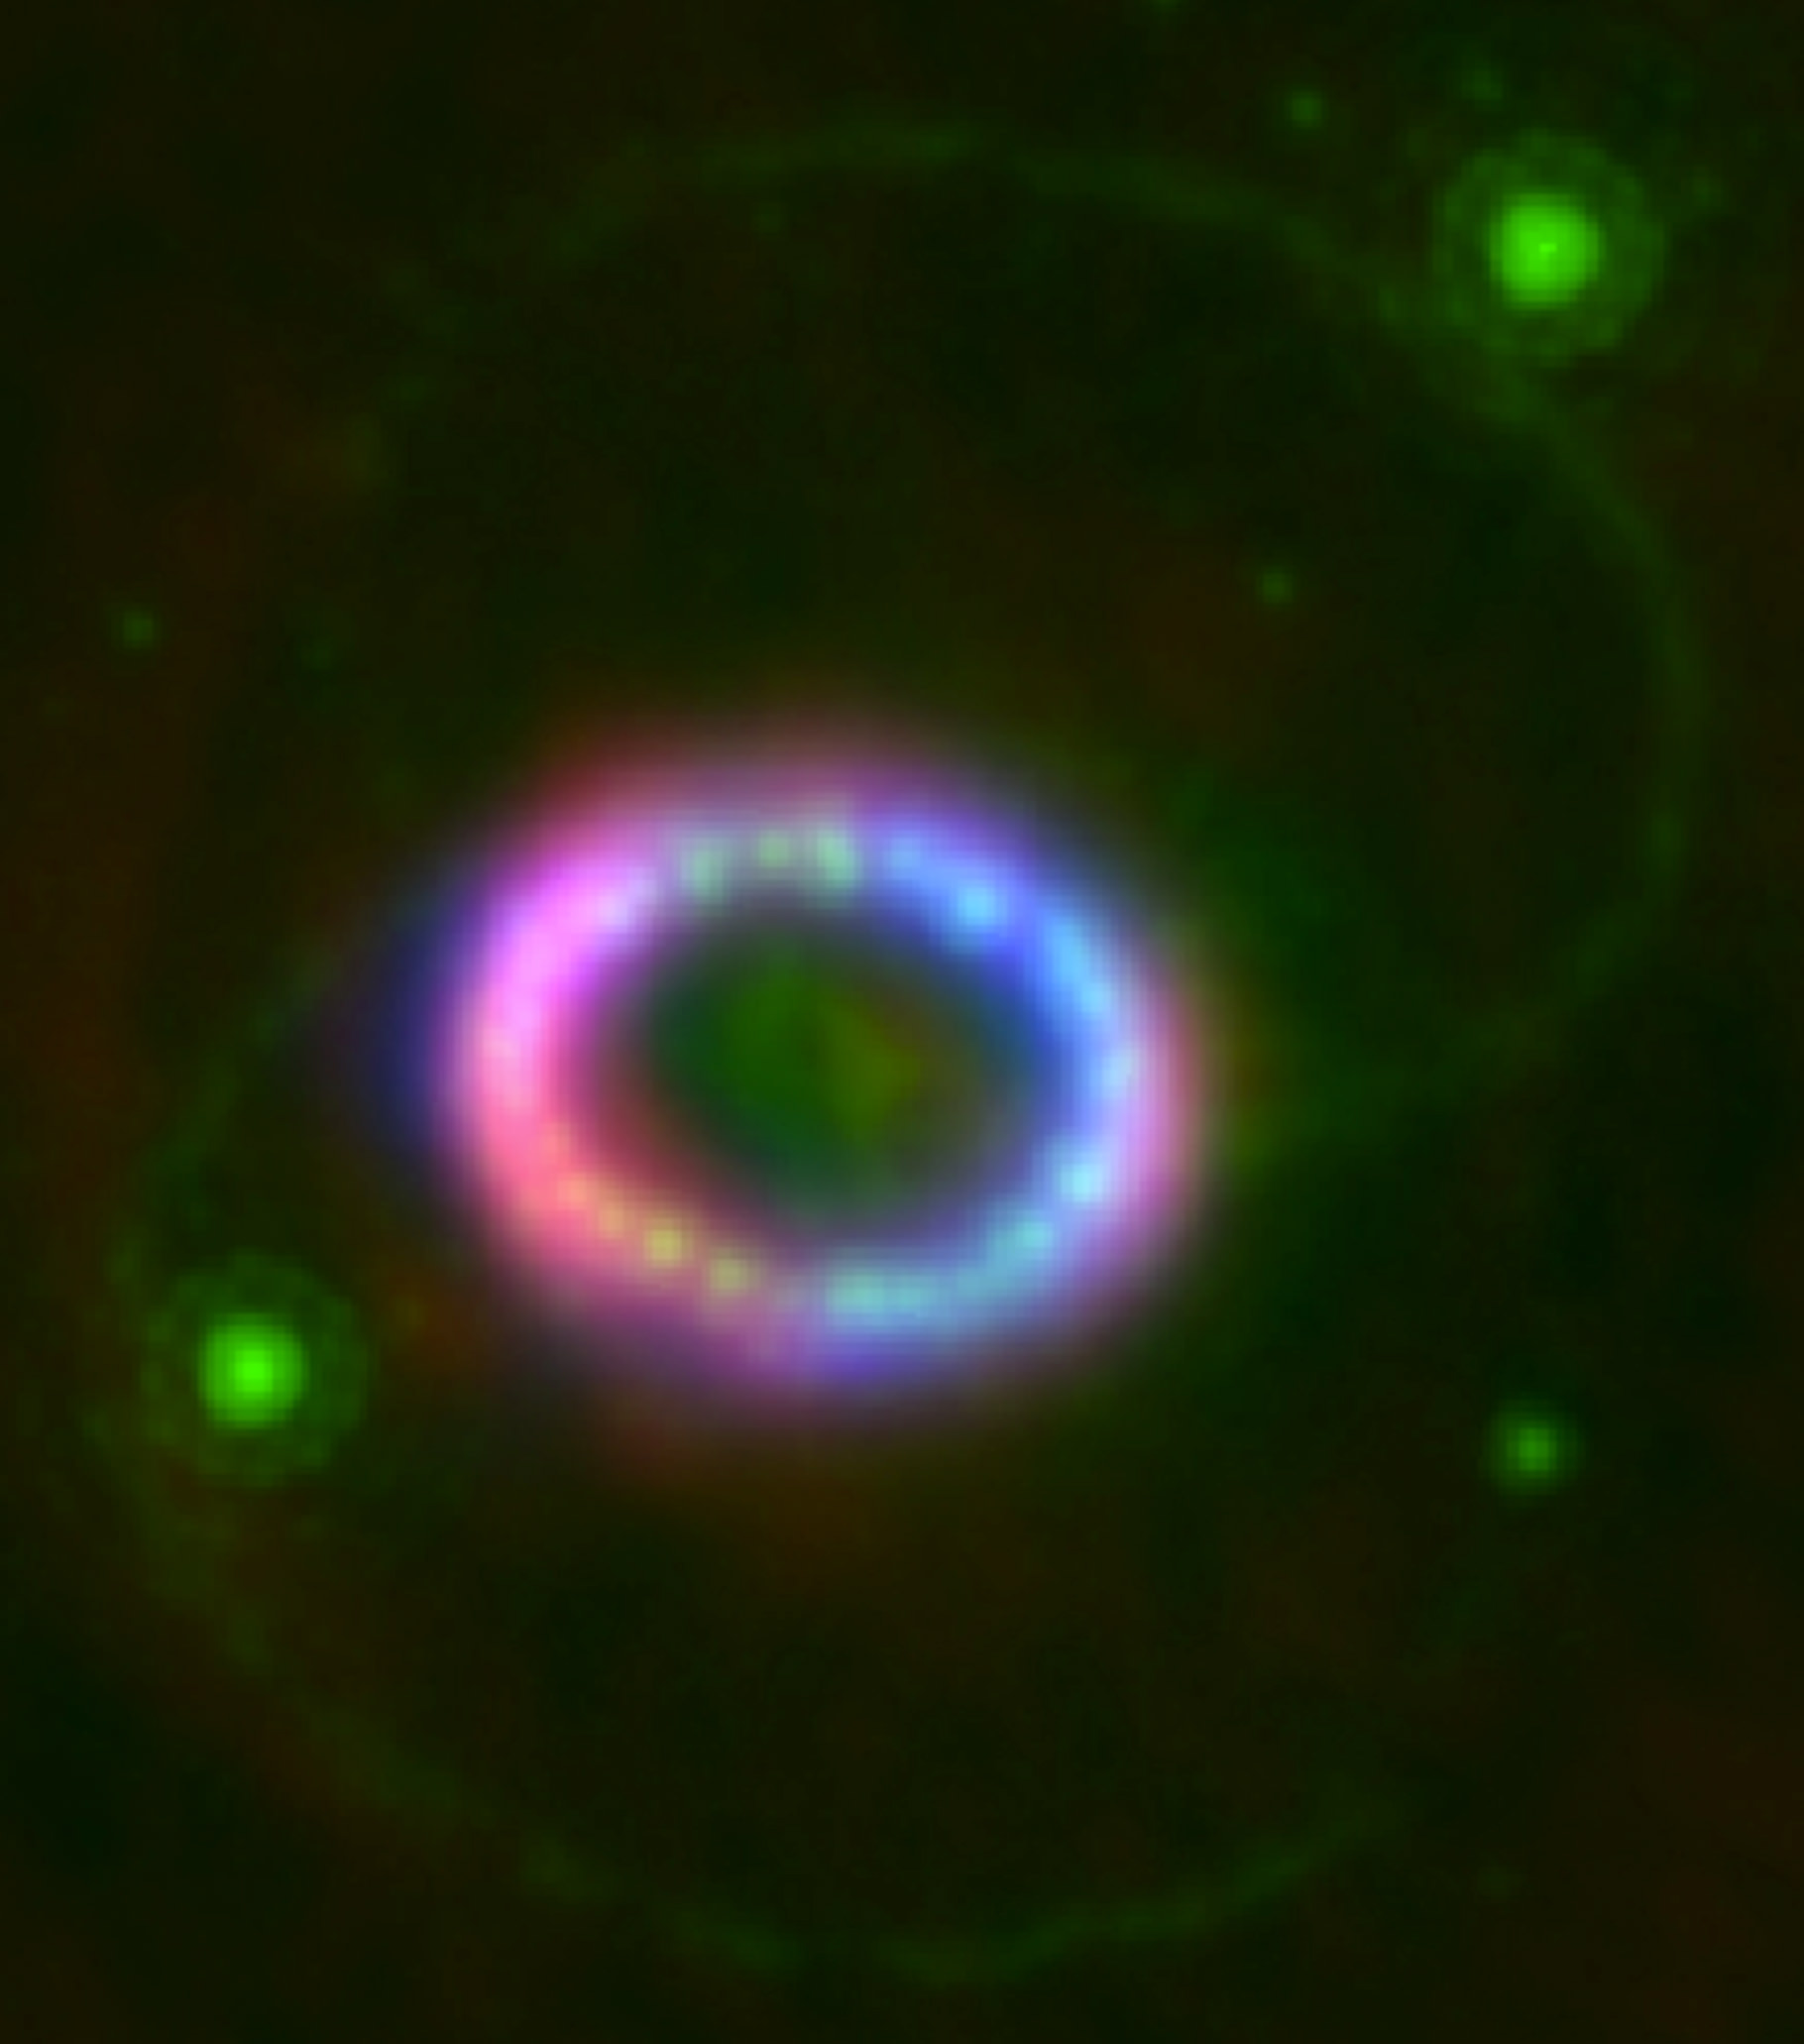
The discovery in galaxy NGC 4845, 47 million light-years away, was made by Integral, with follow-up observations from ESA’s XMM-Newton, NASA’s Swift and Japan’s MAXI X-ray monitor on the International Space Station.

Astronomers were using Integral to study a different galaxy when they noticed a bright X-ray flare coming from another location in the same wide field-of-view. Using XMM-Newton, the origin was confirmed as NGC 4845, a galaxy never before detected at high energies.

Along with Swift and MAXI, the emission was traced from its maximum in January 2011, when the galaxy brightened by a factor of a thousand, and then as it subsided over the course of the year.

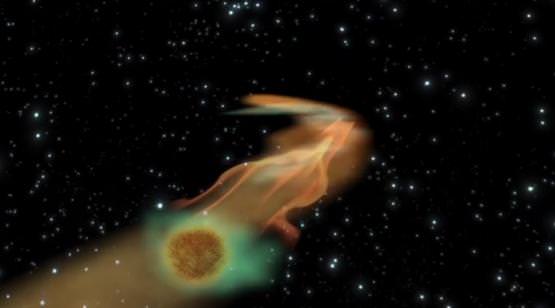
By analyzing the characteristics of the flare, the astronomers could determine that the emission came from a halo of material around the galaxy’s central black hole as it tore apart and fed on an object of 14–30 Jupiter masses, and so the astronomers say the object was either a super-Jupiter or a brown dwarf.

This object appears to have been ‘wandering,’ which would fit the description of recent studies that have suggested that free-floating planetary-mass objects of this kind may occur in large numbers in galaxies, ejected from their parent solar systems by gravitational interactions.

The black hole in the center of NGC 4845 is estimated to have a mass of around 300,000 times that of our own Sun. The astronomers said it also appears to enjoy playing with its food: the way the emission brightened and decayed shows there was a delay of 2–3 months between the object being disrupted and the heating of the debris in the vicinity of the black hole.

“This is the first time where we have seen the disruption of a substellar object by a black hole,” said co-author Roland Walter of the Observatory of Geneva, Switzerland. “We estimate that only its external layers were eaten by the black hole, amounting to about 10% of the object’s total mass, and that a denser core has been left orbiting the black hole.”

The flaring event in NGC 4845 might be similar to what is expected to happen with the supermassive black hole at the center of our own Milky Way Galaxy, perhaps even this year, when an approaching Earth-mass gas cloud is expected to meet its demise.

Along with the object seen being eaten by the black hole in NGC 4845, these events will tell astronomers more about what happens to the demise of different types of objects as they encounter black holes of varying sizes.

“Estimates are that events like these may be detectable every few years in galaxies around us, and if we spot them, Integral, along with other high-energy space observatories, will be able to watch them play out just as it did with NGC 4845,” said Christoph Winkler, ESA’s Integral project scientist.

The team’s paper: Tidal disruption of a super-Jupiter in NGC 4845

Source: ESA