Region in LMC Ablaze with Light and Color

Nearly 200 000 light-years from Earth, the Large Magellanic Cloud, a satellite galaxy of the Milky Way, floats in space, in a long and slow dance around our galaxy. As the Milky Way’s gravity gently tugs on its neighbour’s gas clouds, they collapse to form new stars. In turn, these light up the gas clouds in a kaleidoscope of colours, visible in this image from the NASA/ESA Hubble Space Telescope.

Hubble view of star formation region N11 from the NASA/ESA Hubble Space Telescope. Image credit: NASA/ESA Hubble. Zoom by John Williams/TerraZoom using Zoomify.

New computer wallpaper alert. Light from the Large Magellanic Cloud takes nearly 200,000 years to travel to Earth. And it’s worth the wait.

Behold LHA 120-N 11, or just simply N11, in this image from the NASA/ESA Hubble Space Telescope.

Continue reading “Region in LMC Ablaze with Light and Color”

Stunning Timelapse of Earth and Sky — Volume 3

I’ve been waiting for this! We’ve featured previous timelapse videos by Dustin Farrell, and here is part three of his “Landscapes” video series showing stunning views of Earth and sky. This is really gorgeous. Watching in HD with a big screen is recommended.

On Vimeo, Dustin writes that this is the final volume in this series, at least for a while. “I hope you have enjoyed my work on this series over the last three years,” he wrote. “It has been an amazing ride full of amazing experiences. I plan to continue shooting landscapes timelapses but putting together videos of this magnitude will be difficult to continue on a regular basis.”

Sounds like maybe he’s moving on to bigger and better things, and he’s also got a new website where his new work will be showcased.
Continue reading “Stunning Timelapse of Earth and Sky — Volume 3”

New Look and New Animation for Orion’s 2017 Flight to the Moon and Back

The Orion spacecraft has gotten a new look for its first launch atop the inaugural flight of NASA’s Space Launch System (SLS) booster on the Exploration Mission-1 flight around the Moon in 2017 as seen in this new animation.

The vehicles service module will be built by the European Space Agency (ESA), as a result of a new bilateral agreement between NASA and ESA. Orion is designed to carry humans back to the Moon and to deep space destinations like Asteroids and Mars.

The service module will fuel and propel the capsule on its uncrewed journey to the Moon and back on EM-1 in 2017.

Read my follow-up report for details about the new NASA/ESA agreement. See my earlier story here, about preparations for the first Orion launch in September 2014 on the upcoming Exploration Flight Test-1 in 2014 atop a Delta IV Heavy. An unmanned Orion will fly on a two orbit test flight to an altitude of 3,600 miles above Earth’s surface, farther than a human spacecraft has gone in 40 years, and then plunge back to Earth to test the spacecrafts systems and heat shield.

NASA is also simultaneously fostering the development of commercial ‘space taxis’ to fly astronauts to the International Space Station (ISS) as part of a dual track approach to restore America’s human space launch capability. The 1st commercial crew vehicle might fly as early as 2015 – details here.

Ken Kremer

Image caption: Orion EFT-1 crew cabin construction ongoing at the Kennedy Space Center which is due to blastoff in September 2014 atop a Delta 4 Heavy rocket. Credit: Ken Kremer

Global Temperatures Continue to Rise

This map represents global temperature anomalies averaged from 2008 through 2012. Credit: NASA Goddard Institute for Space Studies/NASA Goddard's Scientific Visualization Studio.

This week, scientists at NASA released their global climate analysis for 2012 which revealed that Earth continues to experience warmer temperatures than several decades ago. The past year was the ninth warmest year on record since 1880, continuing what appears to be a long-term global trend of rising temperatures. The ten warmest years in the 132-year record have all occurred since 1998, and the last year that was cooler than average was 1976. The hottest years on record were 2010 and 2005.

The analysis was done by NASA’s Goddard Institute for Space Studies (GISS) which monitors global surface temperatures on an ongoing basis, comparing temperatures around the globe to the average global temperature from the mid-20th century.

In 2012, the average temperature was about 14.6 degrees Celsius (58.3 degrees Fahrenheit). This is .55 degrees C (1.0 degree F) warmer than the mid-20th century baseline, with the global average temperature having risen about 0.8 degrees C (1.4 degrees F) since 1880. The majority of that change has occurred in the past forty years.

Additionally, last week the US National Climatic Data Center (NCDC) released their latest climate report from 2012 and found that it was the warmest year ever recorded in the contiguous United States. The average temperature for the contiguous United States for 2012 was 13 degrees C (55.3 degrees F) which was 3.2°F above the 20th century average.

The map depicts temperature anomalies, or changes, by region in 2012; while the line plot above shows yearly temperature anomalies from 1880 to 2011 as recorded by NASA GISS, the National Oceanic and Atmospheric Administration (NOAA) National Climatic Data Center, the Japanese Meteorological Agency, and the Met Office Hadley Centre in the United Kingdom. NASA Goddard Institute for Space Studies.

The data was gathered by NASA GISS, the National Oceanic and Atmospheric Administration (NOAA) National Climatic Data Center, the Japanese Meteorological Agency, and the Met Office Hadley Centre in the United Kingdom. All four institutions tally temperature data from stations around the world and make independent judgments about whether the year was warm or cool compared to other years. Though there are minor variations from year to year, all four records show peaks and valleys in sync with each other. All show rapid warming in the past few decades, and all show the last decade as the warmest.

Scientists emphasize that weather patterns cause fluctuations in average temperatures from year to year, but the continued increase in greenhouse gas levels in the atmosphere assures that there will be a long-term rise in global temperatures. Each individual year will not necessarily be warmer than the previous year, but scientists expect each decade to be warmer than the previous decade.

“One more year of numbers isn’t in itself significant,” GISS climatologist Gavin Schmidt said. “What matters is this decade is warmer than the last decade, and that decade was warmer than the decade before. The planet is warming. The reason it’s warming is because we are pumping increasing amounts of carbon dioxide into the atmosphere.”

See an interactive global temperature map from New Scientist.

Carbon dioxide traps heat and largely controls Earth’s climate. It occurs naturally but is also released by the burning of fossil fuels for energy. The level of carbon dioxide in Earth’s atmosphere has been rising consistently for decades, largely driven by increasing man-made emissions. The carbon dioxide level in the atmosphere was about 285 parts per million in 1880, the first year of the GISS temperature record. By 1960, the atmospheric carbon dioxide concentration, measured at NOAA’s Mauna Loa Observatory, was about 315 parts per million. Today, that measurement exceeds 390 parts per million.

The continental U.S. endured its warmest year on record by far, according to NOAA, the official keeper of U.S. weather records. NOAA also announced that global temperatures were 10th warmest on record by their analysis methods.

“The U.S. temperatures in the summer of 2012 are an example of a new trend of outlying seasonal extremes that are warmer than the hottest seasonal temperatures of the mid-20th century,” NASA GISS director James E. Hansen said. “The climate dice are now loaded. Some seasons still will be cooler than the long-term average, but the perceptive person should notice that the frequency of unusually warm extremes is increasing. It is the extremes that have the most impact on people and other life on the planet.”

For more explanation of how the analysis works, read World of Change: Global Temperatures (pdf).

Sources: NASA, NASA’s Earth Observatory

NASA to BEAM Up Inflatable Space Station Module

NASA Deputy Administrator Lori Garver and President and founder of Bigelow Aerospace Robert Bigelow talk while standing next to the Bigelow Expandable Activity Module (BEAM) during a media briefing on , Jan. 16, 2013. BEAM is scheduled to arrive at the space station in 2015 for a two-year technology demonstration. Photo Credit: (NASA/Bill Ingalls)

More details have emerged on NASA’s plan to add the first commercial module to the International Space Station, an inflatable room built by Bigelow Aerospace. The Bigelow Expandable Activity Module (BEAM), which is scheduled to arrive at the space station in 2015 for a two-year technology demonstration. It will be delivered by another commercial company, SpaceX, on what is planned to be the eighth cargo resupply mission too the ISS for Dragon and the Falcon 9 rocket. Astronauts will use the station’s robotic arm to install the module on the aft port of the Tranquility node. NASA Deputy Administrator Lori Garver announced Wednesday NASA has awarded a $17.8 million contract to Bigelow Aerospace for BEAM.

“Today we’re demonstrating progress on a technology that will advance important long-duration human spaceflight goals,” Garver said. “NASA’s partnership with Bigelow opens a new chapter in our continuing work to bring the innovation of industry to space, heralding cutting-edge technology that can allow humans to thrive in space safely and affordably.”

BEAM is a cylindrical module, like all other ISS modules, and is about somewhat similar in size to the US Harmony module, as BEAM is about 4 meters (13 feet) long and 3.2 meters (10.5 feet) wide; Harmony 7.2 meters (24 ft) in length, and it has a diameter of 4.4 meters (14 ft). But weight is where the two vastly differ: Harmony weighs in 14,288 kilograms (31,500 lb), while BEAM weighs roughly 1,360 kg (3,000 pounds). And that is the big advantage of inflatable structures for use in space: their mass and volume are relatively small when launched, reducing launch costs.

The Bigelow Expandable Activity Module (BEAM) is seen during a media briefing on January 16, 2013. Credit: NASA/Bill Ingalls

Leonard David reports on Space.com that the BEAM module should be much quieter than the other modules due to the non-metallic nature of the structure.

Read: Sounds of the Space Station

After the module is berthed to the Tranquility node, the station crew will activate a pressurization system to expand the structure to its full size using air stored within the packed module.

During the two-year test period, station crew members and ground-based engineers will gather performance data on the module, including its structural integrity and leak rate. An assortment of instruments embedded within module also will provide important insights on its response to the space environment. This includes radiation and temperature changes compared with traditional aluminum modules.

BEAM will also be assessed for future habitats for long-duration space missions, said Bill Gerstenmaier, associate administrator for human exploration and operations at NASA.

Watch how the BEAM module will be attached and inflated:

Astronauts periodically will enter the module to gather performance data and perform inspections. Following the test period, the module will be jettisoned from the station, and will burn up on re-entry.

Bigelow Aerospace says the BEAM 330 module can function as an independent space station, or several of the inflatable habitats can be connected together in a modular fashion to create an even larger and more capable orbital space complex.

Bigelow also lists their radiation shielding as equivalent to or better than the other modules on the International Space Station and substantially reduces the dangerous impact of secondary radiation, while their innovative Micrometeorite and Orbital Debris Shield “provides protection superior to that of the traditional ‘aluminum can’ designs, according to the Bigelow Aerospace website.

The BEAM module docked at the International Space Station. Credit: NASA.

Find out how Bigelow Aerospace's BEAM expandable module will enhance the living area of the International Space Station, in this SPACE.com infographic.
Source SPACE.com.

Sounds of the Space Station

Canadian Space Agency astronaut Chris Hadfield uses a camera to photograph the topography of a point on Earth from a window in the Cupola of the International Space Station. Credit: NASA

CSA astronaut Chris Hadfield strums some chords in the cupola (NASA)

You’ve probably seen plenty of photos of astronauts and cosmonauts working aboard the International Space Station, and maybe even some videos of ISS briefings and interviews and tours throughout the different modules (and perhaps even an astronaut-produced song or two.) But have you ever wondered what the average, everyday sounds inside Station are like?

If so, Canadian astronaut and Expedition 34 flight engineer Chris Hadfield has an earful for you.

To share his ISS experience past mere pixels, Hadfield has posted some recordings on Soundcloud taken from various locations around Station, giving an idea of the many ambient noises found inside humanity’s orbiting “place in space.” (But if you think it sounds anything like the bridge of the U.S.S. Enterprise, you may be in for a surprise.)

iss034e010603Here’s just a few of the recordings Hadfield has posted (you’ll have to click each to play in Soundcloud):

Ambient Noise of the Space Station

Station Noises and Sounds

Russian Segment Handrails

Soyuz Orbital Module

And here’s one that really doesn’t sound like anything on Earth: Toilet Starting on Station

So even though life on the ISS might not sound like what you’d first imagine in a spaceship or have a dramatic score to accompany its soaring adventures around the world, it certainly has a unique sound all its own (and sometimes the astronauts do get to add their own original soundtrack too.)

Space Folk

Chris may have founded a new music genre: “Space Folk”

Listen to more sounds of the Station on Chris Hadfield’s Soundcloud page here.

Inset image: Chris Hadfield poses with a Materials Science Laboratory Furnace Launch Support Structure (FLSS) in the Destiny laboratory of the International Space Station. NASA astronaut Tom Marshburn, flight engineer, uses a computer in the background.

Curiosity’s Rambling Tracks Visible from Mars Orbit

Tracks from the Curiosity rover were imaged by the HiRISE camera on the Mars Reconnaissance Orbiter on January 2, 2012. Credit: NASA/JPL/University of Arizona.

Look closely and see where the Curiosity rover has been roving about inside Gale Crater on Mars, from “Bradbury Landing” to its current location in “Yellowknife Bay.” This shot was taken by the HiRISE camera on board the Mars Reconnaissance Orbiter on January 2, 2013.

“This image shows the entire distance traveled from the landing site (dark smudge at left) to its location as of 2 January 2013 (the rover is bright feature at right),” wrote HiRISE principal investigator Alfred McEwen on the HiRISE website. “The tracks are not seen where the rover has recently driven over the lighter-toned surface, which may be more indurated [hardened] than the darker soil.”

You can compare this image to one taken on September 8, 2012 to see how much the rover has driven in Gale Crater:

Curiosity rover tracks seen from orbit by HiRISE on September 8, 2012. Credit: NASA/JPL/University of Arizona.

And here’s a map of Curiosity’s travels that NASA released yesterday:

This image maps the traverse of NASA's Mars rover Curiosity from "Bradbury Landing" to "Yellowknife Bay," with an inset documenting a change in the ground's thermal properties with arrival at a different type of terrain. Image credit: NASA/JPL-Caltech/Univ. of Arizona/CAB(CSIC-INTA)/FMI.

Mission scientists said at a briefing yesterday (January 15, 2013) that between Sol (Martian day) 120 and Sol 121 of the mission — which equates to Dec. 7 and Dec. 8, 2012 — Curiosity crossed over a terrain boundary into lighter-toned rocks that correspond to high thermal inertia values observed by NASA’s Mars Odyssey orbiter. The green dashed line marks the boundary between the terrain types.

The inset graphs the range in ground temperature recorded each day by the Rover Environmental Monitoring Station (REMS) on Curiosity. Note that the arrival onto the lighter-toned terrain corresponds with an abrupt shift in the range of daily ground temperatures to a consistently smaller spread in values. This independently signals the same transition seen from orbit, and marks the arrival at well-exposed, stratified bedrock.

Sol 124 (Dec. 11, 2012) marked the arrival into an area called “Yellowknife Bay,” where sulfate-filled veins and concretions were discovered, along with much finer-grained sediments providing evidence of past water interacting with the surface.

Here’s the Mars weather report provided by REMS for Sol 158 (January 15, 2013):

Daily Weather Report
Image credit: NASA/JPL-Caltech.
Daily Weather Report. Image credit: NASA/JPL-Caltech.

A video showing the new HiRISE image of Curiosity’s tracks:

Space Station Gets a New Telescope

Canadian astronaut Chris Hadfield with the new ISERV (International Space Station SERVIR Environmental Research and Visualization System), a modified Celestron telescope for Earth observation. Credit: NASA/CSA

Astronauts on the International Space Station today are installing a new modified Celestron telescope. This won’t be used to observe the stars, but instead look back to Earth to acquire imagery of specific areas of the world for disaster analysis and environmental studies. Called ISERV (International Space Station SERVIR Environmental Research and Visualization System), it is a new remote-controlled imaging system.

“Essentially, it will be pointed out of one of the windows of the Space Station, and used for Earth imaging,” Andrea Tabor, social media coordinator for Celestron told Universe Today, “especially for natural disasters and to help countries that may not have their own Earth-observing satellites to help assess damage and assist with evacuations.”

ISERV will be installed in the Window Observational Research Facility (WORF) in the station’s Destiny laboratory.

The Celestron CPC 925, is a 9.25″ diffraction limited Schmidt-Cassegrain telescope and off-the-shelf sells for $2,500 including the mount, (just the 9.25 inch optical tube sells for $1,479). It was modified at the Marshall Space Flight Center.

“They used the fork mount that comes with it,” Tabor said, “but they just removed the tripod and replaced it with a specialized mount to anchor and stabilize it on the ISS.”

Because it is pointed out of a window and because the ISS is moving so fast, it would be difficult to align it with the sky and do any celestial imaging, Tabor said.

ISERV is the first of what is hoped to be a series of space station Earth-observing instruments, each to feature progressively more capable sensors to help scientists gain operational experience and expertise, as well as help design better systems in the future. Scientists envision that future sensors could be mounted on the exterior of the station for a clearer, wider view of Earth.

It arrived on the ISS in July of 2012 on board the Japanese HTV-3.

“It’s been up there sitting in a box, so today was unboxing and assembly day,” Tabor said. She added that they hope to post some of the first images from the telescope on their Twitter and Facebook pages.

The telescope will normally be operated by remote-controlled from Earth and so the astronauts won’t likely be working with it directly except for assessing its operation or troubleshooting any problems.

“Images captured from ISERV on the ISS could provide valuable information back here on Earth,” said Dan Irwin, SERVIR program director at Marshall. “We hope it will provide new data and information from space related to natural disasters, environmental crises and the increased effects of climate variability on human populations.”

Image via @Cmdr_Hadfield on Twitter

Dark Nebula Hides Star Birth

A new image from ESO shows a dark cloud where new stars are forming along with a cluster of brilliant stars that have already emerged from their dusty stellar nursery. Credit: ESO/F. Comeron.

Dark nebulas, or dark clouds in space are intriguing because they appear to be “holes” in the sky where there aren’t any stars. But they really are just blocking our view. Also called absorption nebulas, these dark, smokey clouds of gas and dust block light from the regions of space behind it. This new image from ESO shows a dark cloud called Lupus 3 along with a cluster of brilliant stars.

While the dark cloud and the bright cluster of stars appear to be very different, they are in fact closely linked. The cloud contains huge amounts of cool cosmic dust and is a nursery where new stars are being born. We likely wouldn’t be able to see the absorption nebula unless it was silhouetted against the much brighter region of space produced by the star cluster, since absorption nebulas do not create their own light.

As light from space reaches an absorption nebula it is absorbed by it and does not pass through. It is likely that the Sun formed in a similar star formation region more than four billion years ago. The stars seen here are probably less than one million years old.

Lupus 3 lies about 600 light-years from Earth in the constellation of Scorpius. The dark section shown here is about five light-years across.

The new picture was taken with the MPG/ESO 2.2-metre telescope at the La Silla Observatory in Chile and is the best image ever taken in visible light of this little-known object.

Source: ESO

New South Pole Marker Honors Planets, Pluto, and Armstrong

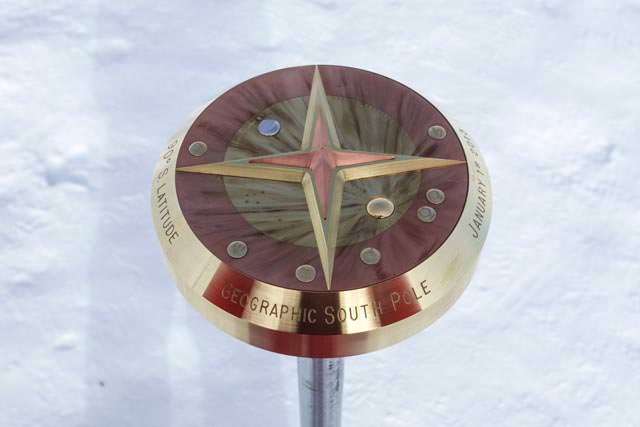
The new geographic South Pole marker that stands at 90º S latitude. (Credit: Jeffrey Donenfeld)

Because the Amundsen-Scott South Pole Station sits atop a layer of moving ice almost 2 miles thick, the location of the marker for the Earth’s geographic South Pole needs to be relocated regularly. Tradition has this done on New Year’s Day, and so this past January 1 saw the unveiling of the newest South Pole marker: a beautiful brass-and-copper design created by Station machinist Derek Aboltins.

pole-marker-top-closeup-1The top of the marker has seven small discs that represent the planets in the positions they would be in on Jan. 1, 2013, as well as two larger discs representing the setting Sun and Moon. Next to the Moon disc are the engraved words “Accomplishment & Modesty,” a nod to the first man on the Moon.

“This was a reference to honor Neil Armstrong, as he passed away when I was making this section with the moon,” Aboltins said.

And for folks who might think the planet count on the new marker is one too few, a surprise has been tucked away on the reverse side.

“For those of you who still think Pluto should be a planet, you’ll find it included underneath, just to keep everyone happy,” Aboltins said. “Bring back Pluto, I say!”

And so, on the underside of the marker along with the signatures of South Pole Station researchers and workers, is one more disc — just for the distant “demoted” dwarf planet.

pole-marker-underside

Underside of the South Pole marker (Credit: Jeffrey Donenfeld)

“For those of you who still think Pluto should be a planet, you’ll find it included underneath, just to keep everyone happy!”

– Derek Aboltins, designer and machinist

(See high resolution versions of these images here.)

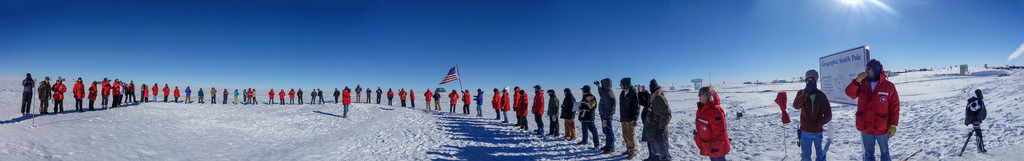
The marker was placed during a ceremony on the ice on Jan. 1, during which time the previous flag marker was removed and put into its new position.

8375171352_5f2b446640_b

(Photo credit: Jeffrey Donenfeld)

According to The Antarctic Sun:

“Almost all hands were present for the ceremony, including station manager Bill Coughran, winter site manager Weeks Heist, and National Science Foundation representative Vladimir Papitashvili. The weather was sunny and a warm at just below minus 14 degrees Fahrenheit.”

(Even though it’s mid-summer in Antarctica, “warm” is clearly a relative term!)

Read more about this and other Antarctic news on The Antarctic Sun site, and see more photos from Antarctica by Jeffrey Donenfeld here.

_____________________

Named for explorers Roald Amundsen and Robert F. Scott, who attained the South Pole in 1911 and 1912, the Amundsen-Scott South Pole Station stands at an elevation of 2,835 meters (9,306 feet) on Antarctica’s ice sheet, which is about 2,700 meters (9,000 feet) thick at that location. The station drifts with the ice sheet at about 10 meters (33 feet) each year. Research is conducted at the station in the fields of astronomy, astrophysics, glaciology, geophysics and seismology, ocean and climate systems, biology, and medicine.