Gorgeous Images: Ancient River on Mars?

Perspective view of Reull Vallis. ESA’s Mars Express imaged the striking upper part of the Reull Vallis region of Mars with its high-resolution stereo camera last year. Reull Vallis, the river-like structure in these images, is believed to have formed when running water flowed in the distant martian past, cutting a steep-sided channel through the Promethei Terra Highlands before running on towards the floor of the vast Hellas basin. Credit and Copyright: ESA/DLR/FU Berlin (G. Neukum)

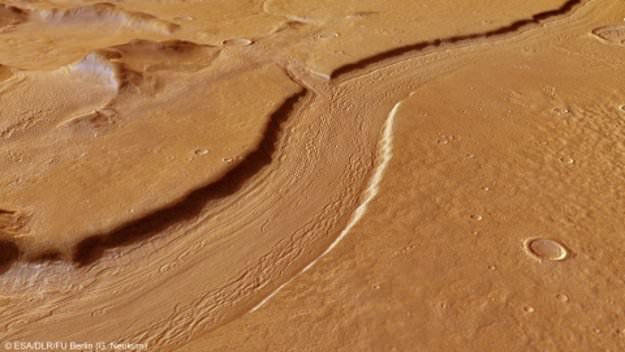
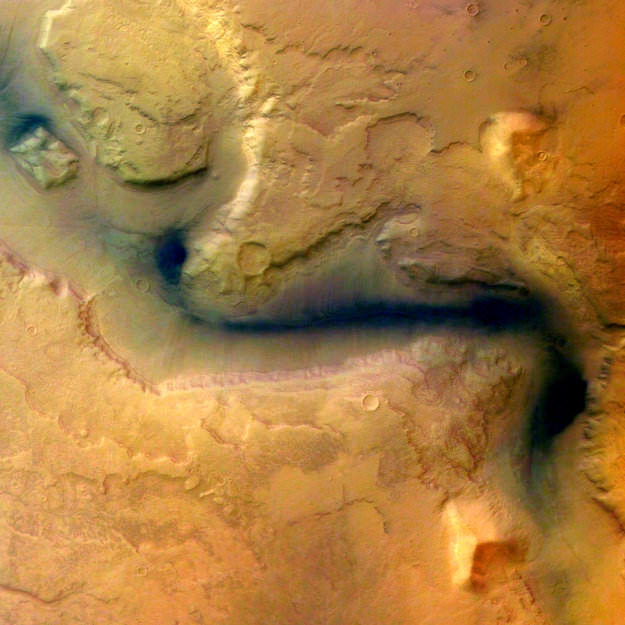
The Mars Express has long been taking pictures of what appears to be an ancient riverbed on Mars. In fact, Reull Vallis was one of the first objects on the Red Planet that Mars Express ever imaged back in 2004 when the spacecraft arrived in orbit. The latest images show the sinuous river-like feature that stretches for nearly 1,500 km across the Martian landscape. This winding depression is 6-10 km wide, and its depth varies from 100-600 meters. In comparison, the Amazon River on Earth is about 6,500 km long and 11 km wide in places.

So, is this really an ancient river?

High-Resolution Stereo Camera image of Reul Vallis taken on May 14, 2012 by ESA’s Mars Express. Credit:  ESA/DLR/FU Berlin (G. Neukum)
High-Resolution Stereo Camera image of Reul Vallis taken on May 14, 2012 by ESA’s Mars Express. Credit: ESA/DLR/FU Berlin (G. Neukum)

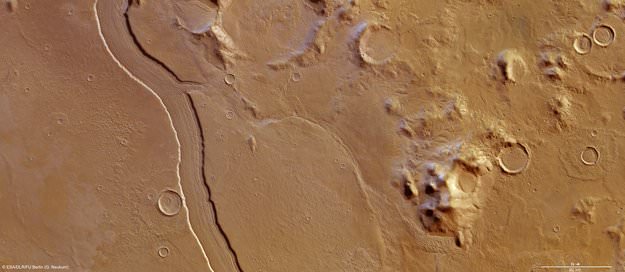
Planetary scientists seem to be fairly unanimous that, from orbit, this appears to be a riverbed. There is a system of tributaries and side channels that all appear to flow into the huge Hellas Basin.

There are various theories as to how it may have formed, however. Some scientists say that this feature may have been created quickly in a sudden deluge or runoff event, as the entire system look like stream beds cut by sudden runoff in desert regions on the Earth.

Reull Vallis in context. Credit: NASA MGS MOLA Science Team.

Others suggest this system consists of parts that were formed during several phases rather than being a single continuous channel, and likely had independent formation phases and different sources of water. For example, numerous crescent-shaped features could be older craters distorted by water flow.

There is also evidence of deposits of volatiles in the walls of the channel that could be ice.

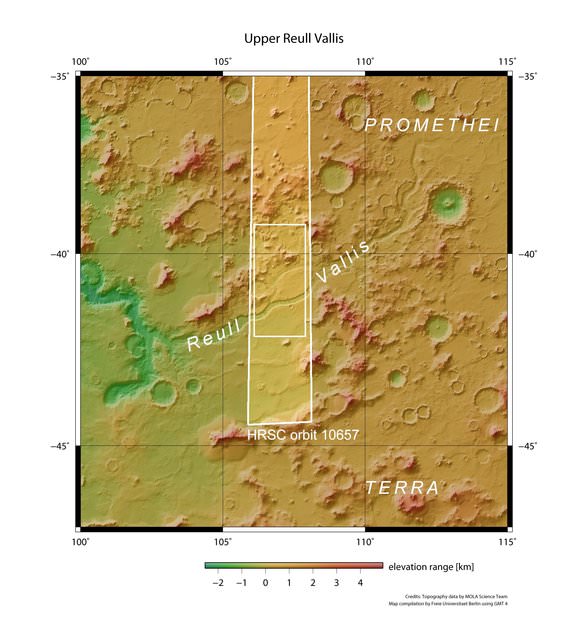
In the wider context image above, the tributary intersecting the main channel appears to be part of a forking of the main valley into two distinct branches further upstream before merging back into a single main valley.

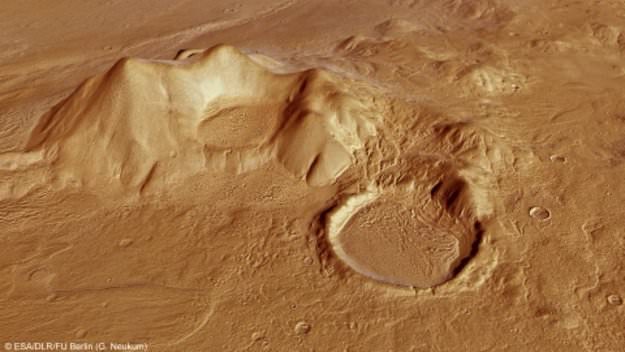
The right (northern) part of the main image is dominated by the Promethei Terra Highlands with their high and soft-rounded mountains shown in these images, rising around 2500 m above the surrounding flat plains.

The perspective view below shows one of these mountains with nearby sediment-filled impact craters:

This computer-generated perspective view shows part of the Promethei Terra highlands adjacent to Reull Vallis. Credit: ESA/DLR/FU Berlin (G. Neukum) >
This computer-generated perspective view shows part of the Promethei Terra highlands adjacent to Reull Vallis. Credit: ESA/DLR/FU Berlin (G. Neukum)

What about lava flow? Could this be a giant lava flow or tube that has collapsed? Astronomers say that lava and glacial erosion would have produced very different channels.

And so it appears Reull Vallis provides evidence of past water on Mars. And if so, it means that the planet’s climate has changed dramatically since these features were formed between 3.5 billion and 1.8 billion years ago.

One of the first images taken by Mars Express in 2004 of Reull Vallis. Credit: Credit: ESA/DLR/FU Berlin (G. Neukum)

Sources: ESA Science paper from 1997 by Scott Mest and David Crown, University of Pittsburgh, Paper by Kostama, et al, 2007, ESA 2004.

The Secrets of Moondogs

A Moondog, captured over Hampton Bays, New York in December 2011. Credit: Jeff Schultz

[/caption]

You’ve probably heard of — and likely have even seen — a Sundog, the atmospheric phenomenon that creates rainbow-colored blobs or arcs of light on either side of the Sun. But did you know the Moon can have ‘dogs’ too? Also known as mock moons, false moons, or the scientific name of paraselenae, Moondogs aren’t seen as often as Sundogs. However, the conditions needed to create either of the ‘dogs’ are about the same. This great image of a Moondog, above, by Jeff Schultz is a perfect example of the kind of night you might see this gorgeous phenomenon.

What are the secrets to how Moondogs are produced?

A bright Moondog on January 20, 2012 seen in Wiltshire, England. Credit and copyright: Richard Fleet. Used by permission.
A bright Moondog on January 20, 2012 seen in Wiltshire, England. Credit: Richard Fleet

Moondogs are seen most often in the winter when ice crystals may be present in the atmosphere. But they can appear anytime of the year when hexagon-shaped ice crystals might be high in the sky, or also when thin cirrus or cirrostratus clouds are just right. What happens is that the ice crystals or clouds refract the moonlight, creating blobs or arcs of light to the left and right of the Moon, or sometimes just on one side.

Also, the Moon usually needs to be full or nearly full, along with being low in the sky for the effect to be produced. The angular separation of the light blobs from the Moon is usually 22 degrees.

Sometimes, a full halo of light around the Moon will also appear in conjunction with the Moondogs; other times smaller arcs of light will be part of the effect, but often Moondogs appear without any other effects.

Moondogs can appear colorful like a Sundog or ‘shine’ with a light similar to the Moon.

A Moondog seen in Adelaide, Australia on November 28, 2012. Credit: Ian Musgrave.
A Moondog seen over Adelaide, Australia on November 28, 2012. Credit: Ian Musgrave.

Moondogs are seen in both hemispheres, as this image from Ian Musgrave in Australia attests, but it seems that the effect is seen most often the farther north you are in the northern hemisphere and the farther south you are in the southern hemisphere.

You never know exactly when you might be lucky enough to see a Moondog, so we recommend looking at the Moon every night! Also, don’t forget to wink at the Moon, too.

For more detailed information and images of Moondogs, Sundogs and other optical effects, Richard Fleet (the photographer who captured the second image in this article) has a great website: “Glows, Bows and Haloes.”

Our Phases of the Moon App is Now a Lunar Atlas

We’ve done a major update to our Phases of the Moon app for iPhone/iPad and Android, finally fulfilling the most requested feature: a Lunar Atlas.

You can now pinch-zoom the Moon and two-finger pan it around. As you zoom the Moon beyond a certain size, labels for lunar features will appear, like major craters, Apollo landing sites and lunar seas (mare). As you zoom in more, smaller features become visible. Now that we’ve figured out how to actually implement this functionality, we’ll keep improving it, to make Phases of the Moon a really handy tool for stargazing, especially when you’re using a telescope.

There are lots of other features we’ve recently added including: total lunar eclipses, Live Wallpaper and Widgets (for Android), social sharing, and more.

You can download the iPhone/iPad version here.

Or you can access the Android version here.

Either app costs only $.99 and helps support the costs of Universe Today.

P.S. If you’ve already got either app, please take a second and give us a review on iTunes or Google Play. Every little bit helps.

NASA’s Lunar Orbiter Gets an Art Lesson with Lasers

In the ultimate example of science imitating art, engineers working with NASA’s Lunar Reconnaissance Orbiter recently beamed an image of the Mona Lisa to the LRO and back via laser beam in order to measure the rate of transmission between the spacecraft and Earth. This allowed them to then calibrate their software to correct for any discrepancies between the image sent and the one received, resulting in a picture-perfect result.

Leonardo would definitely have approved.

From NASA’s Goddard Space Flight Center:

As part of the first demonstration of laser communication with a satellite at the moon, scientists with NASA’s Lunar Reconnaissance Orbiter (LRO) beamed an image of the Mona Lisa to the spacecraft from Earth.

The iconic image traveled nearly 240,000 miles in digital form from the Next Generation Satellite Laser Ranging (NGSLR) Station at NASA’s Goddard Space Flight Center in Greenbelt, MD, to the Lunar Orbiter Laser Altimeter (LOLA) instrument on the spacecraft. By transmitting the image piggyback on laser pulses that are routinely sent to track LOLA’s position, the team achieved simultaneous laser communication and tracking.

“This test, and the data obtained from it, sets the stage for future high data-rate laser communications demonstrations that will be an essential feature of NASA’s next Moon mission: the Lunar Atmosphere and Dust Environment Explorer.

Video: NASA/GSFC

Region in LMC Ablaze with Light and Color

Nearly 200 000 light-years from Earth, the Large Magellanic Cloud, a satellite galaxy of the Milky Way, floats in space, in a long and slow dance around our galaxy. As the Milky Way’s gravity gently tugs on its neighbour’s gas clouds, they collapse to form new stars. In turn, these light up the gas clouds in a kaleidoscope of colours, visible in this image from the NASA/ESA Hubble Space Telescope.

Hubble view of star formation region N11 from the NASA/ESA Hubble Space Telescope. Image credit: NASA/ESA Hubble. Zoom by John Williams/TerraZoom using Zoomify.

New computer wallpaper alert. Light from the Large Magellanic Cloud takes nearly 200,000 years to travel to Earth. And it’s worth the wait.

Behold LHA 120-N 11, or just simply N11, in this image from the NASA/ESA Hubble Space Telescope.

Continue reading “Region in LMC Ablaze with Light and Color”

Stunning Timelapse of Earth and Sky — Volume 3

I’ve been waiting for this! We’ve featured previous timelapse videos by Dustin Farrell, and here is part three of his “Landscapes” video series showing stunning views of Earth and sky. This is really gorgeous. Watching in HD with a big screen is recommended.

On Vimeo, Dustin writes that this is the final volume in this series, at least for a while. “I hope you have enjoyed my work on this series over the last three years,” he wrote. “It has been an amazing ride full of amazing experiences. I plan to continue shooting landscapes timelapses but putting together videos of this magnitude will be difficult to continue on a regular basis.”

Sounds like maybe he’s moving on to bigger and better things, and he’s also got a new website where his new work will be showcased.
Continue reading “Stunning Timelapse of Earth and Sky — Volume 3”

New Look and New Animation for Orion’s 2017 Flight to the Moon and Back

The Orion spacecraft has gotten a new look for its first launch atop the inaugural flight of NASA’s Space Launch System (SLS) booster on the Exploration Mission-1 flight around the Moon in 2017 as seen in this new animation.

The vehicles service module will be built by the European Space Agency (ESA), as a result of a new bilateral agreement between NASA and ESA. Orion is designed to carry humans back to the Moon and to deep space destinations like Asteroids and Mars.

The service module will fuel and propel the capsule on its uncrewed journey to the Moon and back on EM-1 in 2017.

Read my follow-up report for details about the new NASA/ESA agreement. See my earlier story here, about preparations for the first Orion launch in September 2014 on the upcoming Exploration Flight Test-1 in 2014 atop a Delta IV Heavy. An unmanned Orion will fly on a two orbit test flight to an altitude of 3,600 miles above Earth’s surface, farther than a human spacecraft has gone in 40 years, and then plunge back to Earth to test the spacecrafts systems and heat shield.

NASA is also simultaneously fostering the development of commercial ‘space taxis’ to fly astronauts to the International Space Station (ISS) as part of a dual track approach to restore America’s human space launch capability. The 1st commercial crew vehicle might fly as early as 2015 – details here.

Ken Kremer

Image caption: Orion EFT-1 crew cabin construction ongoing at the Kennedy Space Center which is due to blastoff in September 2014 atop a Delta 4 Heavy rocket. Credit: Ken Kremer

Global Temperatures Continue to Rise

This map represents global temperature anomalies averaged from 2008 through 2012. Credit: NASA Goddard Institute for Space Studies/NASA Goddard's Scientific Visualization Studio.

This week, scientists at NASA released their global climate analysis for 2012 which revealed that Earth continues to experience warmer temperatures than several decades ago. The past year was the ninth warmest year on record since 1880, continuing what appears to be a long-term global trend of rising temperatures. The ten warmest years in the 132-year record have all occurred since 1998, and the last year that was cooler than average was 1976. The hottest years on record were 2010 and 2005.

The analysis was done by NASA’s Goddard Institute for Space Studies (GISS) which monitors global surface temperatures on an ongoing basis, comparing temperatures around the globe to the average global temperature from the mid-20th century.

In 2012, the average temperature was about 14.6 degrees Celsius (58.3 degrees Fahrenheit). This is .55 degrees C (1.0 degree F) warmer than the mid-20th century baseline, with the global average temperature having risen about 0.8 degrees C (1.4 degrees F) since 1880. The majority of that change has occurred in the past forty years.

Additionally, last week the US National Climatic Data Center (NCDC) released their latest climate report from 2012 and found that it was the warmest year ever recorded in the contiguous United States. The average temperature for the contiguous United States for 2012 was 13 degrees C (55.3 degrees F) which was 3.2°F above the 20th century average.

The map depicts temperature anomalies, or changes, by region in 2012; while the line plot above shows yearly temperature anomalies from 1880 to 2011 as recorded by NASA GISS, the National Oceanic and Atmospheric Administration (NOAA) National Climatic Data Center, the Japanese Meteorological Agency, and the Met Office Hadley Centre in the United Kingdom. NASA Goddard Institute for Space Studies.

The data was gathered by NASA GISS, the National Oceanic and Atmospheric Administration (NOAA) National Climatic Data Center, the Japanese Meteorological Agency, and the Met Office Hadley Centre in the United Kingdom. All four institutions tally temperature data from stations around the world and make independent judgments about whether the year was warm or cool compared to other years. Though there are minor variations from year to year, all four records show peaks and valleys in sync with each other. All show rapid warming in the past few decades, and all show the last decade as the warmest.

Scientists emphasize that weather patterns cause fluctuations in average temperatures from year to year, but the continued increase in greenhouse gas levels in the atmosphere assures that there will be a long-term rise in global temperatures. Each individual year will not necessarily be warmer than the previous year, but scientists expect each decade to be warmer than the previous decade.

“One more year of numbers isn’t in itself significant,” GISS climatologist Gavin Schmidt said. “What matters is this decade is warmer than the last decade, and that decade was warmer than the decade before. The planet is warming. The reason it’s warming is because we are pumping increasing amounts of carbon dioxide into the atmosphere.”

See an interactive global temperature map from New Scientist.

Carbon dioxide traps heat and largely controls Earth’s climate. It occurs naturally but is also released by the burning of fossil fuels for energy. The level of carbon dioxide in Earth’s atmosphere has been rising consistently for decades, largely driven by increasing man-made emissions. The carbon dioxide level in the atmosphere was about 285 parts per million in 1880, the first year of the GISS temperature record. By 1960, the atmospheric carbon dioxide concentration, measured at NOAA’s Mauna Loa Observatory, was about 315 parts per million. Today, that measurement exceeds 390 parts per million.

The continental U.S. endured its warmest year on record by far, according to NOAA, the official keeper of U.S. weather records. NOAA also announced that global temperatures were 10th warmest on record by their analysis methods.

“The U.S. temperatures in the summer of 2012 are an example of a new trend of outlying seasonal extremes that are warmer than the hottest seasonal temperatures of the mid-20th century,” NASA GISS director James E. Hansen said. “The climate dice are now loaded. Some seasons still will be cooler than the long-term average, but the perceptive person should notice that the frequency of unusually warm extremes is increasing. It is the extremes that have the most impact on people and other life on the planet.”

For more explanation of how the analysis works, read World of Change: Global Temperatures (pdf).

Sources: NASA, NASA’s Earth Observatory

NASA to BEAM Up Inflatable Space Station Module

NASA Deputy Administrator Lori Garver and President and founder of Bigelow Aerospace Robert Bigelow talk while standing next to the Bigelow Expandable Activity Module (BEAM) during a media briefing on , Jan. 16, 2013. BEAM is scheduled to arrive at the space station in 2015 for a two-year technology demonstration. Photo Credit: (NASA/Bill Ingalls)

More details have emerged on NASA’s plan to add the first commercial module to the International Space Station, an inflatable room built by Bigelow Aerospace. The Bigelow Expandable Activity Module (BEAM), which is scheduled to arrive at the space station in 2015 for a two-year technology demonstration. It will be delivered by another commercial company, SpaceX, on what is planned to be the eighth cargo resupply mission too the ISS for Dragon and the Falcon 9 rocket. Astronauts will use the station’s robotic arm to install the module on the aft port of the Tranquility node. NASA Deputy Administrator Lori Garver announced Wednesday NASA has awarded a $17.8 million contract to Bigelow Aerospace for BEAM.

“Today we’re demonstrating progress on a technology that will advance important long-duration human spaceflight goals,” Garver said. “NASA’s partnership with Bigelow opens a new chapter in our continuing work to bring the innovation of industry to space, heralding cutting-edge technology that can allow humans to thrive in space safely and affordably.”

BEAM is a cylindrical module, like all other ISS modules, and is about somewhat similar in size to the US Harmony module, as BEAM is about 4 meters (13 feet) long and 3.2 meters (10.5 feet) wide; Harmony 7.2 meters (24 ft) in length, and it has a diameter of 4.4 meters (14 ft). But weight is where the two vastly differ: Harmony weighs in 14,288 kilograms (31,500 lb), while BEAM weighs roughly 1,360 kg (3,000 pounds). And that is the big advantage of inflatable structures for use in space: their mass and volume are relatively small when launched, reducing launch costs.

The Bigelow Expandable Activity Module (BEAM) is seen during a media briefing on January 16, 2013. Credit: NASA/Bill Ingalls

Leonard David reports on Space.com that the BEAM module should be much quieter than the other modules due to the non-metallic nature of the structure.

Read: Sounds of the Space Station

After the module is berthed to the Tranquility node, the station crew will activate a pressurization system to expand the structure to its full size using air stored within the packed module.

During the two-year test period, station crew members and ground-based engineers will gather performance data on the module, including its structural integrity and leak rate. An assortment of instruments embedded within module also will provide important insights on its response to the space environment. This includes radiation and temperature changes compared with traditional aluminum modules.

BEAM will also be assessed for future habitats for long-duration space missions, said Bill Gerstenmaier, associate administrator for human exploration and operations at NASA.

Watch how the BEAM module will be attached and inflated:

Astronauts periodically will enter the module to gather performance data and perform inspections. Following the test period, the module will be jettisoned from the station, and will burn up on re-entry.

Bigelow Aerospace says the BEAM 330 module can function as an independent space station, or several of the inflatable habitats can be connected together in a modular fashion to create an even larger and more capable orbital space complex.

Bigelow also lists their radiation shielding as equivalent to or better than the other modules on the International Space Station and substantially reduces the dangerous impact of secondary radiation, while their innovative Micrometeorite and Orbital Debris Shield “provides protection superior to that of the traditional ‘aluminum can’ designs, according to the Bigelow Aerospace website.

The BEAM module docked at the International Space Station. Credit: NASA.

Find out how Bigelow Aerospace's BEAM expandable module will enhance the living area of the International Space Station, in this SPACE.com infographic.
Source SPACE.com.

Sounds of the Space Station

Canadian Space Agency astronaut Chris Hadfield uses a camera to photograph the topography of a point on Earth from a window in the Cupola of the International Space Station. Credit: NASA

CSA astronaut Chris Hadfield strums some chords in the cupola (NASA)

You’ve probably seen plenty of photos of astronauts and cosmonauts working aboard the International Space Station, and maybe even some videos of ISS briefings and interviews and tours throughout the different modules (and perhaps even an astronaut-produced song or two.) But have you ever wondered what the average, everyday sounds inside Station are like?

If so, Canadian astronaut and Expedition 34 flight engineer Chris Hadfield has an earful for you.

To share his ISS experience past mere pixels, Hadfield has posted some recordings on Soundcloud taken from various locations around Station, giving an idea of the many ambient noises found inside humanity’s orbiting “place in space.” (But if you think it sounds anything like the bridge of the U.S.S. Enterprise, you may be in for a surprise.)

iss034e010603Here’s just a few of the recordings Hadfield has posted (you’ll have to click each to play in Soundcloud):

Ambient Noise of the Space Station

Station Noises and Sounds

Russian Segment Handrails

Soyuz Orbital Module

And here’s one that really doesn’t sound like anything on Earth: Toilet Starting on Station

So even though life on the ISS might not sound like what you’d first imagine in a spaceship or have a dramatic score to accompany its soaring adventures around the world, it certainly has a unique sound all its own (and sometimes the astronauts do get to add their own original soundtrack too.)

Space Folk

Chris may have founded a new music genre: “Space Folk”

Listen to more sounds of the Station on Chris Hadfield’s Soundcloud page here.

Inset image: Chris Hadfield poses with a Materials Science Laboratory Furnace Launch Support Structure (FLSS) in the Destiny laboratory of the International Space Station. NASA astronaut Tom Marshburn, flight engineer, uses a computer in the background.