This week, scientists at NASA released their global climate analysis for 2012 which revealed that Earth continues to experience warmer temperatures than several decades ago. The past year was the ninth warmest year on record since 1880, continuing what appears to be a long-term global trend of rising temperatures. The ten warmest years in the 132-year record have all occurred since 1998, and the last year that was cooler than average was 1976. The hottest years on record were 2010 and 2005.
The analysis was done by NASA’s Goddard Institute for Space Studies (GISS) which monitors global surface temperatures on an ongoing basis, comparing temperatures around the globe to the average global temperature from the mid-20th century.
In 2012, the average temperature was about 14.6 degrees Celsius (58.3 degrees Fahrenheit). This is .55 degrees C (1.0 degree F) warmer than the mid-20th century baseline, with the global average temperature having risen about 0.8 degrees C (1.4 degrees F) since 1880. The majority of that change has occurred in the past forty years.
Additionally, last week the US National Climatic Data Center (NCDC) released their latest climate report from 2012 and found that it was the warmest year ever recorded in the contiguous United States. The average temperature for the contiguous United States for 2012 was 13 degrees C (55.3 degrees F) which was 3.2°F above the 20th century average.
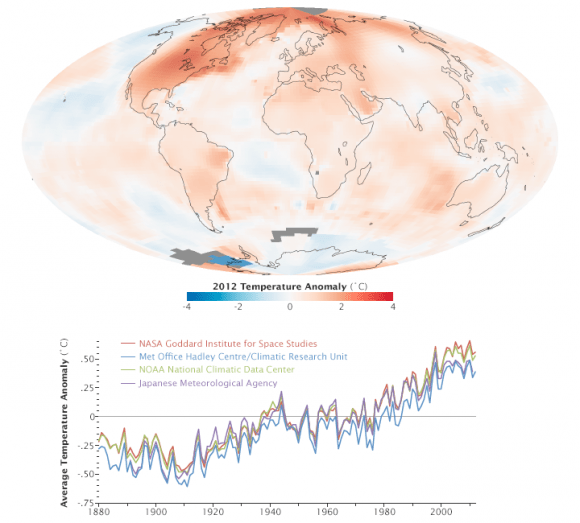
The data was gathered by NASA GISS, the National Oceanic and Atmospheric Administration (NOAA) National Climatic Data Center, the Japanese Meteorological Agency, and the Met Office Hadley Centre in the United Kingdom. All four institutions tally temperature data from stations around the world and make independent judgments about whether the year was warm or cool compared to other years. Though there are minor variations from year to year, all four records show peaks and valleys in sync with each other. All show rapid warming in the past few decades, and all show the last decade as the warmest.
Scientists emphasize that weather patterns cause fluctuations in average temperatures from year to year, but the continued increase in greenhouse gas levels in the atmosphere assures that there will be a long-term rise in global temperatures. Each individual year will not necessarily be warmer than the previous year, but scientists expect each decade to be warmer than the previous decade.
“One more year of numbers isn’t in itself significant,” GISS climatologist Gavin Schmidt said. “What matters is this decade is warmer than the last decade, and that decade was warmer than the decade before. The planet is warming. The reason it’s warming is because we are pumping increasing amounts of carbon dioxide into the atmosphere.”
See an interactive global temperature map from New Scientist.
Carbon dioxide traps heat and largely controls Earth’s climate. It occurs naturally but is also released by the burning of fossil fuels for energy. The level of carbon dioxide in Earth’s atmosphere has been rising consistently for decades, largely driven by increasing man-made emissions. The carbon dioxide level in the atmosphere was about 285 parts per million in 1880, the first year of the GISS temperature record. By 1960, the atmospheric carbon dioxide concentration, measured at NOAA’s Mauna Loa Observatory, was about 315 parts per million. Today, that measurement exceeds 390 parts per million.
The continental U.S. endured its warmest year on record by far, according to NOAA, the official keeper of U.S. weather records. NOAA also announced that global temperatures were 10th warmest on record by their analysis methods.
“The U.S. temperatures in the summer of 2012 are an example of a new trend of outlying seasonal extremes that are warmer than the hottest seasonal temperatures of the mid-20th century,” NASA GISS director James E. Hansen said. “The climate dice are now loaded. Some seasons still will be cooler than the long-term average, but the perceptive person should notice that the frequency of unusually warm extremes is increasing. It is the extremes that have the most impact on people and other life on the planet.”
For more explanation of how the analysis works, read World of Change: Global Temperatures (pdf).
Sources: NASA, NASA’s Earth Observatory


