2012 Orionid Meteor Shower Peaks This Weekend

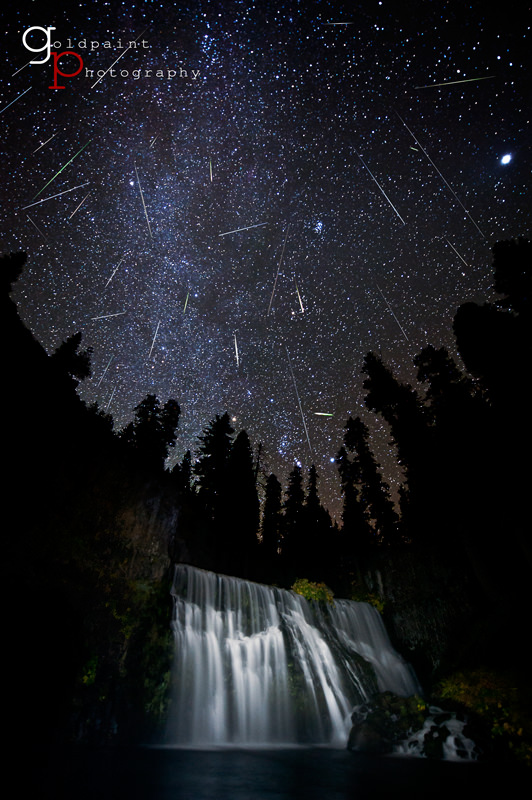
A composite image of every meteor captured in a viewing session for the 2011 Orionid Meteor shower at Middle Falls, near Mount Shasta in California. Credit: Brad Goldpaint/Goldpaint Photography. Used by permission.

The Earth will soon be traveling through the stream of debris left behind by Halley’s Comet, providing the annual sky show called the Orionid Meteor Shower. This usually reliable meteor shower is expected to peak this coming weekend, October 20-21, 2012, and should produce about 25 meteors per hour, according to the McDonald Observatory at The University of Texas in Austin.

How can you see the show?

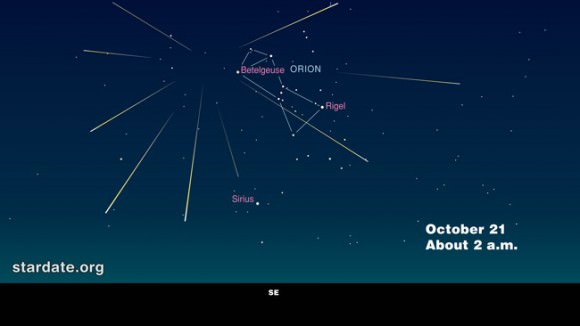
Northern hemisphere sky map of the Orionid meteor shower. Credit: StarDate

The meteors for the Orionid shower meteors appear to fall from above the star Betelgeuse, the bright orange star marking the shoulder of the constellation Orion, so if you live in the northern hemisphere look towards the southeast, and in the southern hemisphere look towards the northeast during the best viewing times. The best viewing times are usually about midnight to 2 am, or in the hours just before dawn in your area. The quarter Moon will have set about midnight, so it won’t be a hindrance.

As always, for the best view get away from city lights. If your backyard is lit by too many streetlights, look to go to state or city parks or other safe, dark sites. Lie on a blanket or reclining chair to get a full-sky view. If you can see all of the stars in the Little Dipper, you have good dark-adapted vision, say the folks at StarDate, a bi-monthly publication put out by the McDonald Observatory.

Note: the lead image is called ‘Nighted Vail’ by Brad Goldpaint. It is a composite consisting of every meteor captured during the night and includes the Milky Way appearing to ‘crash’ into the illuminated falls. The image was Grand Prize Winner of Outdoor Photographer Magazine’s 3rd Annual Great Outdoors Photography Contest and published in their July 2012 issue.

Source: StarDate

New ‘Shiny’ Objects Found by Curiosity Rover Are Likely Indigenous

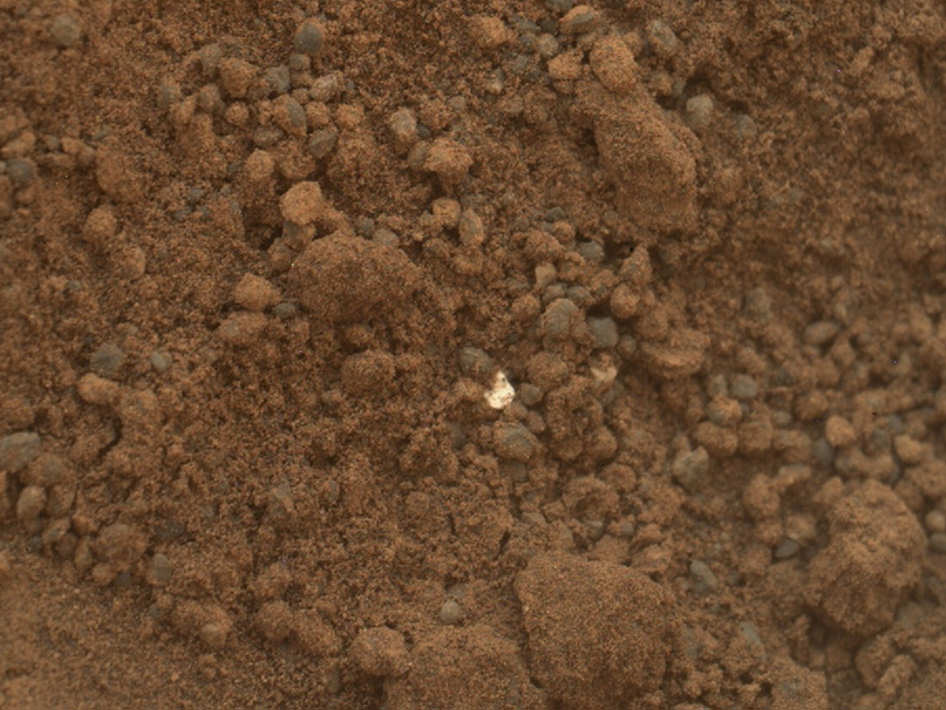
A bright particle found inside a scoop hole created by the Curiosity rover. Credit: NASA/JPL-Caltech.

Last weekend, the Mars Curiosity rover scooped out a few “bites” in the small, sandy dune known as Rocknest and inside the second scoop hole was a small, shiny particle, as we reported earlier. This speck – and others like it in the pit — is different than the previous object that looked like plastic and may have come from the rover itself. After some analysis, the MSL science team thinks the shiny particle is just part of the soil on Mars.

“As the science team thought about it more and more, the bright object is about the same size as the granules that it’s in and it is not uniformly bright,” said John Grotziner, MSL project scientist. “We went back and forth, and the majority of the science team thinks this is indigenous to Mars.”

And so, Grotziner said, these shiny objects likely represent a science opportunity rather than an engineering hazard.

One hypothesis that the specks are natural geologic material that might have a broken-off, flat surface called a cleavage that could be reflecting sunlight, making it appear bright.

The size of the bright fleck is about 1 mm, so it is “pretty representative of other objects there,” Grotzinger said, which range from half a millimeter to 2 millimeters.

Grotzinger said they will use the ChemCam instrument to take a closer look at the shiny specks. “We are going to shoot it with ChemCam, a remote sensing tool that has spectacular spatial resolution,” he said, “and aim it right on that fleck. Then we’ll aim it on another darker grain and try to decide if it is a different class of mineral.”
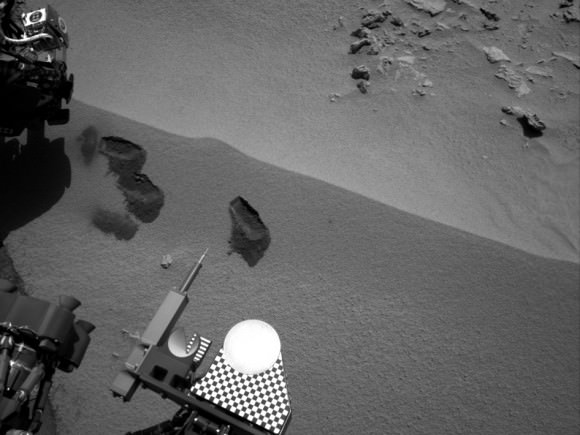
Three ‘bite marks’ left in the Martian ground by the scoop on the robotic arm the Curiosity rover are visible in this image taken by the rover’s right Navigation Camera during the mission’s 69th Martian day, or sol (Oct. 15, 2012). Credit: NASA/JPL-Caltech

One way the team tested if the shiny flecks were something that may have come from the rover was that after pictures were taken of the area, they vibrated the rover for about an hour and then took more images. Nothing had changed in the surrounding area, with no additional flecks visible on the ground.

After the shiny fleck was initially seen, the team dumped out the scoop they had taken over concerns it was another foreign object, perhaps from the rover or from the Entry Descent and Landing of the rover, as was determined for previous, plastic-looking object found on Mars. But now they are planning to look closer at both the dumped-out scoop of soil and the pit to analyze the shiny flecks.

The big news that Grotzinger reported today during a press briefing was that they just received confirmation that the rover successfully placed a small sample of soil inside Chemistry and Mineralogy (CheMin) instrument and soon will be analyzing the sample to determine what minerals it contains.

“Our mobile laboratory eats dirt,” Grotzinger said, “whether we scoop it up or drill a hole in rock, that’s what keeps us going, that’s what we live on.”

They also placed a portion of the third scoop of soil taken onto the observation tray and took an image of it with the Mastcam.
“We see two components in the soil,” Grotzinger said. “One is a thin layer of lighter colored, finer grained material. Then there are some darker grains, which represent the courser fraction that is available.”
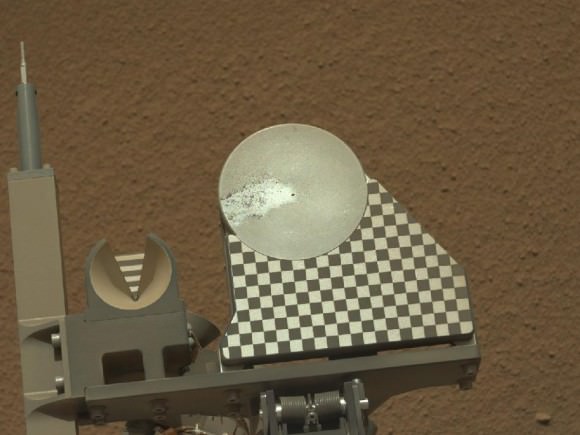
A closeup look at the sample of Martian regolith that was dumped on an observation tray on the rover. The tray is 7.8 centimeters (3 inches) in diameter. Credit: NASA/JPL-Caltech

Grotzinger said he hopes to be able to report within the week of the results of the first analysis of Martian soil from CheMin. Also, the SAM laboratory (Sample Analysis at Mars) is scheduled to take its first sample next week. SAM is a suite of instruments that investigate the past and present ability of Mars to support life.

They were slowed in slightly in getting the first sample inside ChemMin not only by the discovery of the bright flecks, but also by a safing event that took place on the Mars Reconnaissance Orbiter, which relays the data from the rover to Earth. The orbiter is now back to full functionality.

NASA’s latest report about the rover can be read here.

Our Gorgeous, Graceful, Gradient Sun

Here’s a mesmerizing video from the folks over at NASA’s Goddard Space Flight Center’s visualization studio showing the Sun in a whole new light… well, a reprocessed light anyway.

Using what’s called a gradient filter, images of the Sun can be adjusted to highlight the intricate details of its dynamic atmosphere. Magnetic activity that’s invisible to human vision can be brought into view, showing the powerful forces in play within the Sun’s corona and helping researchers better understand how it affects space weather. (Plus they sure are pretty!)

Compiled into a video, these images reveal the hidden beauty — and power — of our home star in action.

Video courtesy NASA/GSFC

Uranus has Bizarre Weather

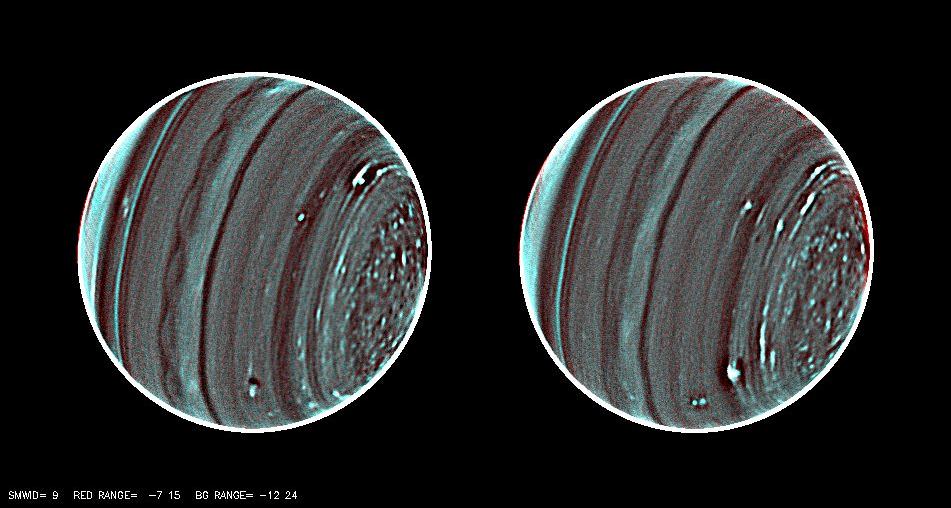
New infrared images of Uranus show details not seen before. Credit: NASA/ESA/L. A. Sromovsky/P. M. Fry/H. B. Hammel/I. de Pater/K. A. Rages

Here’s the scene: a thick, tempestuous atmosphere with winds blowing at a clip of 900 km/h (560 mph); massive storms that would engulf continents here on Earth, and temperatures in the -220 C (-360 degree F) range. Sounds like a cold Hell, but this is the picture emerging of the planet Uranus, revealed in new high-resolution infrared images from the Keck Observatory in Hawaii, exposing in incredible detail the bizarre weather of a planet that was once thought to be rather placid.

“My first reaction to these images was ‘wow’ and then my second reaction was ‘WOW,'” said Heidi Hammel, a co-investigator on the new observations. “These images reveal an astonishing amount of complexity in Uranus’ atmosphere. We knew the planet was active, but until now much of the activity was masked by noise in our data.”

Voyager 2’s view of Uranus. Credit: NASA

With its beautiful blue atmosphere, Uranus can seem rather tranquil at first glance. Even the flyby of Voyager 2 in 1986 revealed a rather “bland” blue ball. But coming into focus now with the new are large weather systems, and even though they are probably much less violent than storms on Earth, the weather on Uranus is just…bizarre.

“Some of these weather systems,” said Larry Sromovsky, from the University of Wisconsin-Madison who led the new study using the Keck II telescope, “stay at fixed latitudes and undergo large variations in activity. Others are seen to drift toward the planet’s equator while undergoing great changes in size and shape. Better measures of the wind fields that surround these massive weather systems are the key to unraveling their mysteries.”

Sromovsky, Hammel and their colleagues are using new infrared techniques to deliver some of the “most richly detailed views of Uranus yet obtained by any instrument on any observatory. No other telescope could come close to producing this result,” Sromovsky said.

What they are seeing are previously undetected, small but widely distributed weather feature, and they hope the movements of these features can help make sense of the planet’s odd pattern of winds.

They observed a scalloped band of clouds just south of Uranus’ equator and a swarm of small convective features in the north polar regions of the planet. Features like this don’t seem to be in the southern polar regions, but are similar to the types of “popcorn” –type clouds seen on Saturn. Uranus’ north pole is not visible from Earth night now, but when it does come into view, the researchers wouldn’t be surprised to see a polar vortex feature similar to what has been seen at Saturn’s south pole.

The driver of these features must be solar energy because there is no other detectable internal energy source.

“But the Sun is 900 times weaker there than on Earth because it is 30 times further from the Sun, so you don’t have the same intensity of solar energy driving the system,” said Sromovsky. “Thus the atmosphere of Uranus must operate as a very efficient machine with very little dissipation. Yet the weather variations we see seem to defy that requirement.”

One possible explanation, is that methane is pushed north by an atmospheric conveyor belt toward the pole where it wells up to form the convective features visible in the new images. The phenomena may be seasonal, the team said, but they are still working on trying to put together a clear seasonal trend in the winds of Uranus.

“Uranus is changing,” he said, “and there is certainly something different going on in the two polar regions.”

The images were released at the American Astronomical Society’s Division for Planetary Sciences meeting taking place this week.

Source: University of Wisconsin-Madison

Integral: Ten Years Tracking Extreme Radiation Across the Universe

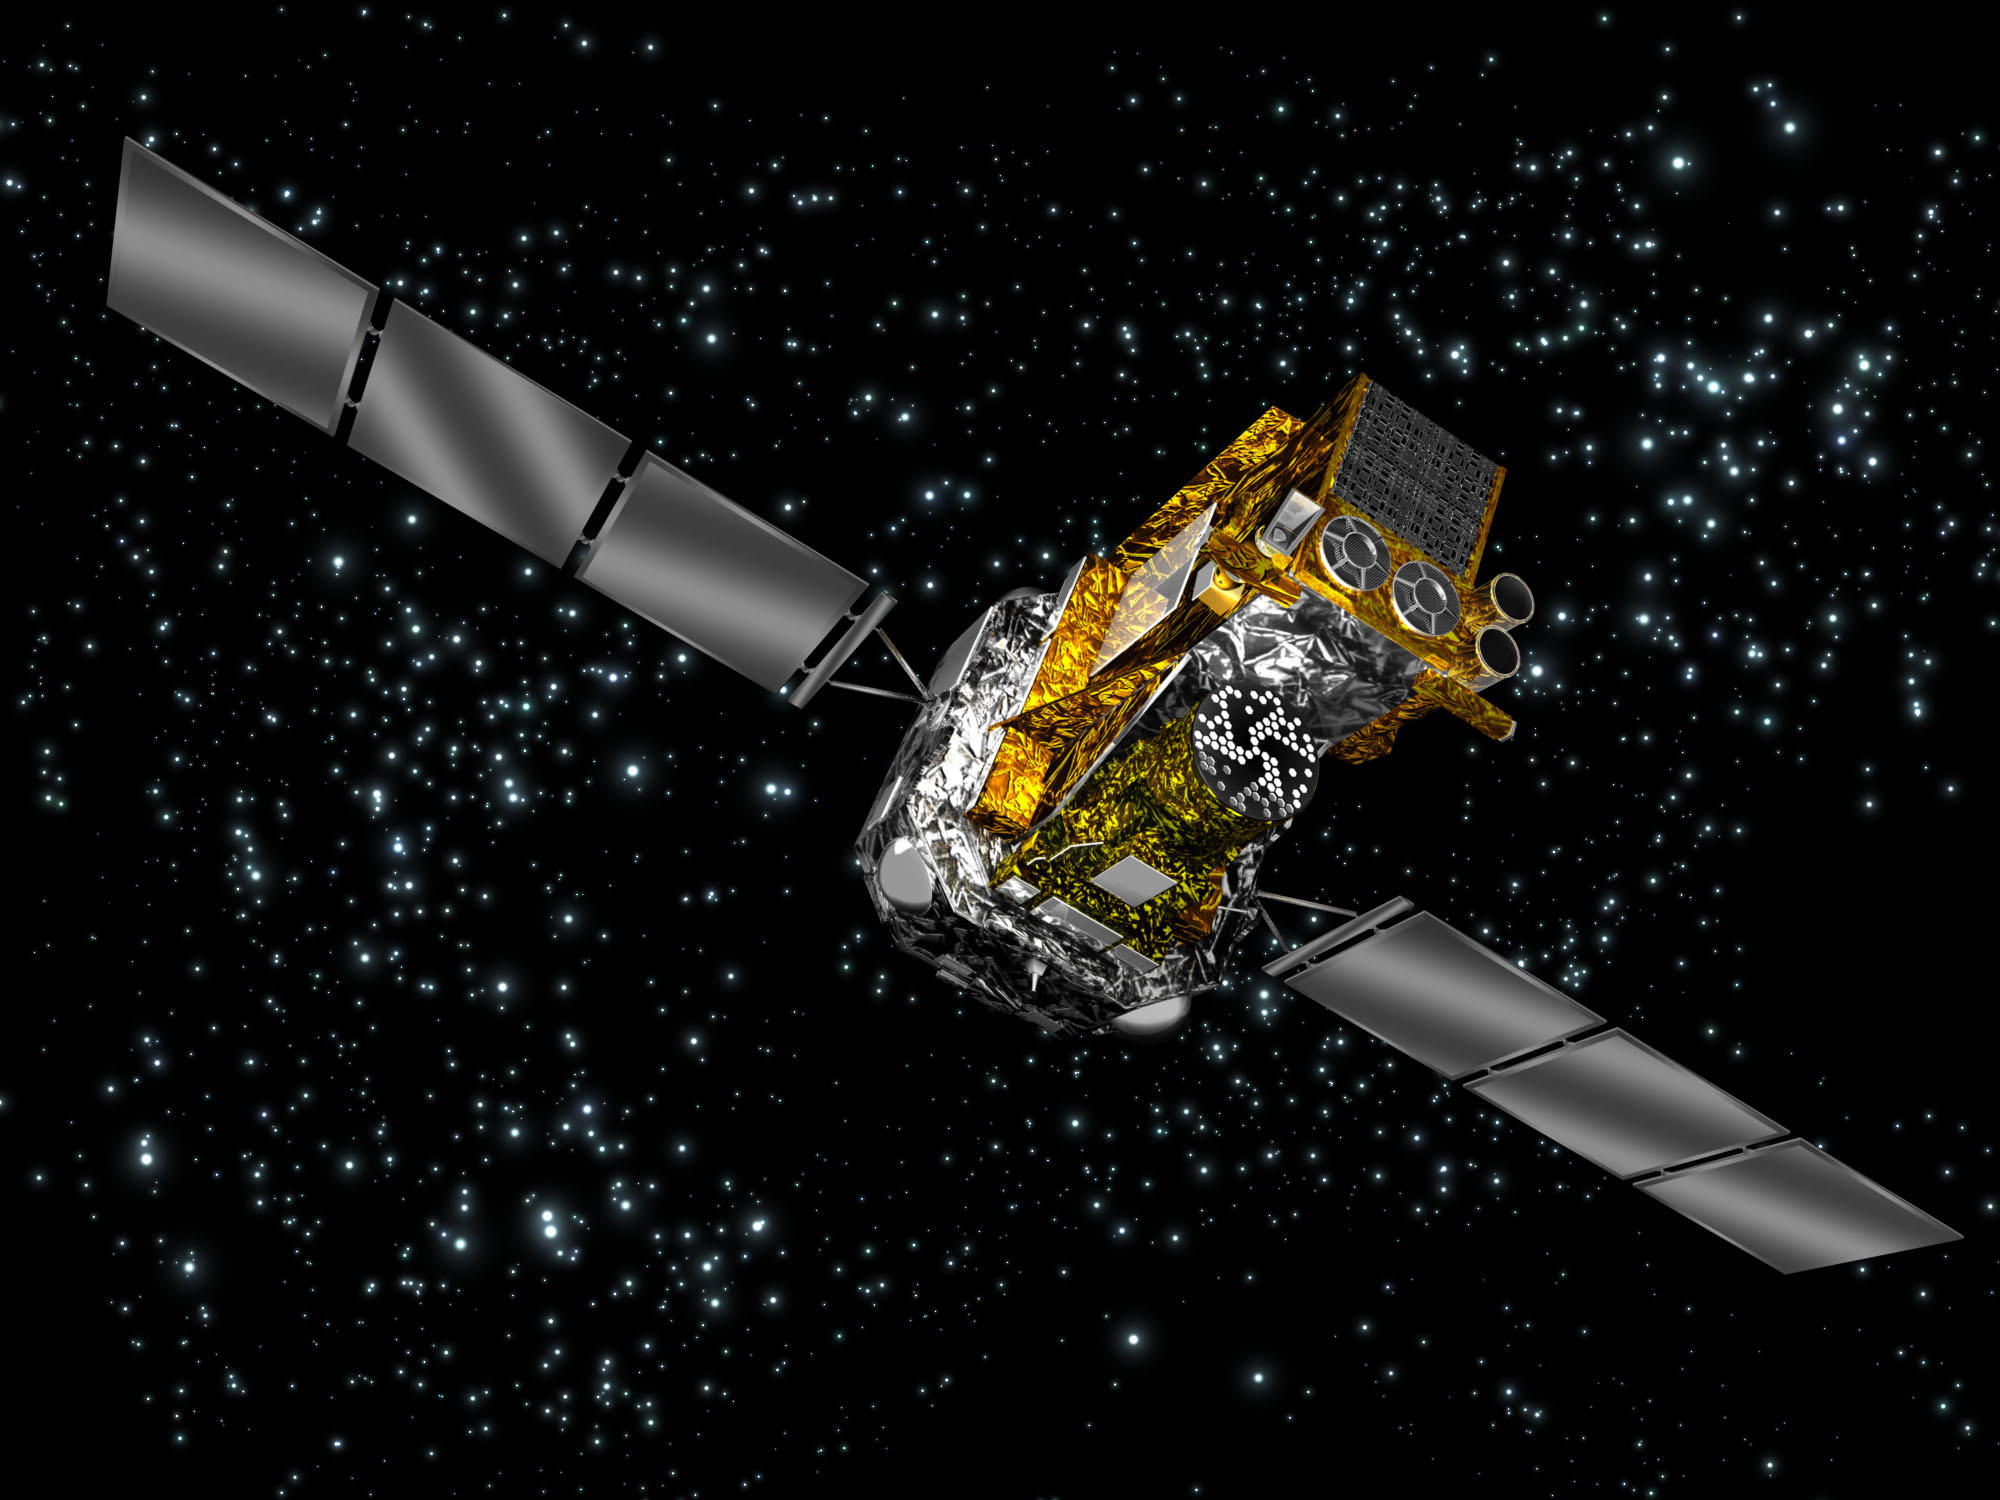
Caption: Artist’s impression of ESA’s orbiting gamma-ray observatory Integral. Image credit: ESA

Integral, ESA’s International Gamma-Ray Astrophysics Laboratory launched ten years ago this week. This is a good time to look back at some of the highlights of the mission’s first decade and forward to its future, to study at the details of the most sensitive, accurate, and advanced gamma-ray observatory ever launched. But the mission has also had some recent exciting research of a supernova remnant.

Integral is a truly international mission with the participation of all member states of ESA and United States, Russia, the Czech Republic, and Poland. It launched from Baikonur, Kazakhstan on October 17th 2002. It was the first space observatory to simultaneously observe objects in gamma rays, X-rays, and visible light. Gamma rays from space can only be detected above Earth’s atmosphere so Integral circles the Earth in a highly elliptical orbit once every three days, spending most of its time at an altitude over 60 000 kilometres – well outside the Earth’s radiation belts, to avoid interference from background radiation effects. It can detect radiation from events far away and from the processes that shape the Universe. Its principal targets are gamma-ray bursts, supernova explosions, and regions in the Universe thought to contain black holes.

5 metres high and more than 4 tonnes in weight Integral has two main parts. The service module is the lower part of the satellite which contains all spacecraft subsystems, required to support the mission: the satellite systems, including solar power generation, power conditioning and control, data handling, telecommunications and thermal, attitude and orbit control. The payload module is mounted on the service module and carries the scientific instruments. It weighs 2 tonnes, making it the heaviest ever placed in orbit by ESA, due to detectors’ large area needed to capture sparse and penetrating gamma rays and to shield the detectors from background radiation in order to make them sensitive. There are two main instruments detecting gamma rays. An imager producing some of the sharpest gamma-ray images and a spectrometer that gauges gamma-ray energies very precisely. Two other instruments, an X-ray monitor and an optical camera, help to identify the gamma-ray sources.

During its extended ten year mission Integral has has charted in extensive detail the central region of our Milky Way, the Galactic Bulge, rich in variable high-energy X-ray and gamma-ray sources. The spacecraft has mapped, for the first time, the entire sky at the specific energy produced by the annihilation of electrons with their positron anti-particles. According to the gamma-ray emission seen by Integral, some 15 million trillion trillion trillion pairs of electrons and positrons are being annihilated every second near the Galactic Centre, that is over six thousand times the luminosity of our Sun.

A black-hole binary, Cygnus X-1, is currently in the process of ripping a companion star to pieces and gorging on its gas. Studying this extremely hot matter just a millisecond before it plunges into the jaws of the black hole, Integral has discovered that some of it might be escaping along structured magnetic field lines. By studying the alignment of the waves of high-energy radiation originating from the Crab Nebula, Integral found that the radiation is strongly aligned with the rotation axis of the pulsar. This implies that a significant fraction of the particles generating the intense radiation must originate from an extremely organised structure very close to the pulsar, perhaps even directly from the powerful jets beaming out from the spinning stellar core.

Just today ESA reported that Integral has made the first direct detection of radioactive titanium associated with supernova remnant 1987A. Supernova 1987A, located in the Large Magellanic Cloud, was close enough to be seen by the naked eye in February 1987, when its light first reached Earth. Supernovae can shine as brightly as entire galaxies for a brief time due to the enormous amount of energy released in the explosion, but after the initial flash has faded, the total luminosity comes from the natural decay of radioactive elements produced in the explosion. The radioactive decay might have been powering the glowing remnant around Supernova 1987A for the last 20 years.

During the peak of the explosion elements from oxygen to calcium were detected, which represent the outer layers of the ejecta. Soon after, signatures of the material from the inner layers could be seen in the radioactive decay of nickel-56 to cobalt-56, and its subsequent decay to iron-56. Now, after more than 1000 hours of observation by Integral, high-energy X-rays from radioactive titanium-44 in supernova remnant 1987A have been detected for the first time. It is estimated that the total mass of titanium-44 produced just after the core collapse of SN1987A’s progenitor star amounted to 0.03% of the mass of our own Sun. This is close to the upper limit of theoretical predictions and nearly twice the amount seen in supernova remnant Cas A, the only other remnant where titanium-44 has been detected. It is thought both Cas A and SN1987A may be exceptional cases

Christoph Winkler, ESA’s Integral Project Scientist says “Future science with Integral might include the characterisation of high-energy radiation from a supernova explosion within our Milky Way, an event that is long overdue.”

Find out more about Integral here
and about Integral’s study of Supernova 1987A here

Mars rover Scooping in Search of Pristine material at Rocknest

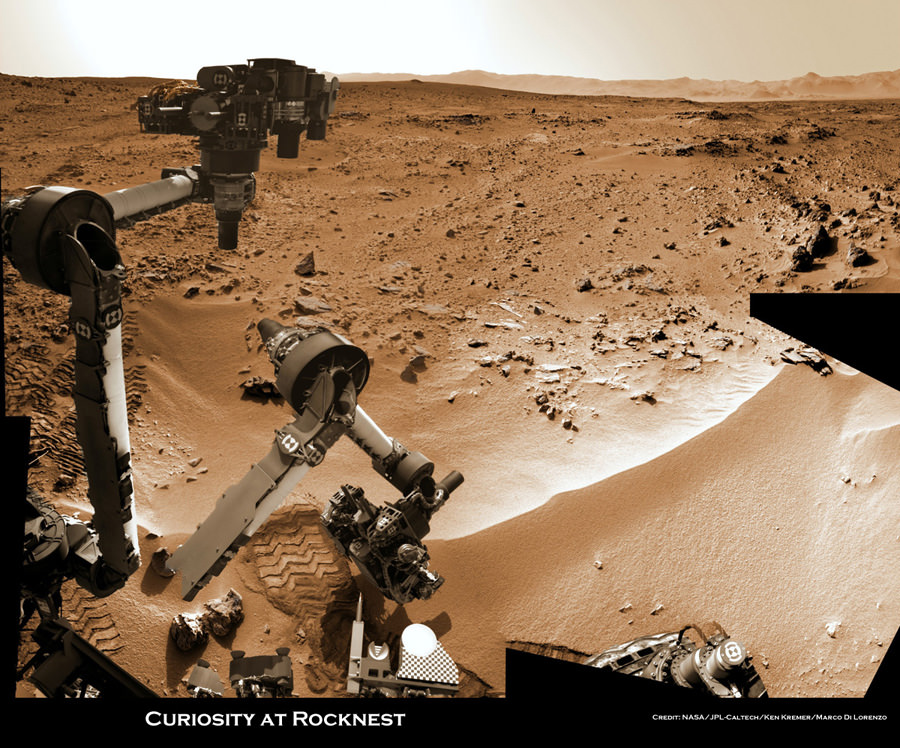
Image caption: Time lapse context view of Curiosity maneuvering her robotic arm. Curiosity conducts a close- up examination of windblown ‘Rocknest’ ripple site and inspects sandy material at “bootlike” wheel scuff mark with the APXS (Alpha Particle X-Ray Spectrometer) and MAHLI (Mars Hand Lens Imager) instruments positioned on the rotatable turret at the arm’s terminus. Colorized mosaic was stitched together from Sol 57 & 58 Navcam raw images shows the arm in action just prior to 1st sample scooping here. Surrounding terrain and eroded rim of Gale Crater rim is visible on the horizon. Credit: NASA/JPL-Caltech/Ken Kremer/Marco Di Lorenzo

NASA’s Curiosity rover is actively searching for uncontaminated Martian soil after finding new flecks of “bright material” of unknown origin in the windblown sands at “Rocknest” ripple.

The team leading the Curiosity Mars Science Lab (MSL) mission decided to dump the second scoopful of dusty material collected last week on Sol 66 (Oct. 12). Instead they will search for pristine Martian sand to pour into the rover’s critical sample-processing mechanisms to use as a decontamination agent for cleansing the interior chambers and walls of Earthly residues.

Image Caption: Bright Particle of Martian Origin in Scoop Hole. This image contributed to an interpretation by NASA’s Mars rover Curiosity science team that some of the bright particles on the ground near the rover are native Martian material. Other light-toned material nearbyhas been assessed as small debris from the spacecraft. Curiosity’s Mars Hand Lens Imager (MAHLI) camera took this image on Sol 66 (Oct. 12, 2012) showing part of the hole or bite left in the ground when Curiosity collected its first scoop of Martian soil five sols earlier. A clod of soil near the top center of the image contains a light-toned particle. The observation that the particle is embedded in the clod led scientists to assess this particle as Martian material, not something from the spacecraft. This assessment prompted the mission to continue scooping in the area, despite observations of a few light-toned particles in the area being scooped. The image shows an area about 2 inches (5 centimeters) across. It is brightened to improve visibility in the shaded area. Credit: NASA/JPL-Caltech/MSSS

The science team is proceeding with appropriate caution – just as they indicated at press briefings – so as not to gum up the sample processing system with material that could give false positive readings for organic compounds or compromise the integrity of the rover’s delicate sample handling and delivery system.

“Concerns that the bright spot is more material shed from the flight system, and that some of this terrestrial material is in the scooped dirt, led the tactical team to decide to dump the scoop and take MAHLI images of the scoop targets first,” wrote MSL scientist Ken Herkenhoff in a rover team update.

The second scoopful of Martian sand from Rocknest was intentionally discarded on Sol 67 (Oct.13) after up close imaging by the MAHLI microscopic imaging camera revealed several specks of bright material that could be debris from the landing system or the rover itself or possibly even native Martian material.

The third test sample will be carefully analyzed by MAHLI, ChemCam and Mastcam and verified to be free of FOD before the team decides to pour the new processed sand into the processing system and eventually into the Sample Analysis at Mars (SAM) and Chemistry and Mineralogy (CheMin) analytical chemistry instruments on the rover deck.

Image Caption: Small Debris on the Ground Beside Curiosity – This image from the Mars Hand Lens Imager (MAHLI) camera on NASA’s Mars rover Curiosity shows a small bright object on the ground beside the rover at the “Rocknest” site about half an inch (1.3 centimeters) long. The rover team has assessed this object as debris from the spacecraft, possibly from the events of landing on Mars. The image was taken on Sol 65 (Oct. 11, 2012). Credit: NASA/JPL-Caltech/MSSS

Progress has been slowed somewhat by communications glitches with a radio transmitter at a Deep Space Network ground station and an unrelated new problem with NASA’s Mars Reconnaissance Orbiter (MRO) which went into “safe mode” on Sol 69. MRO serves as the highest volume communications relay for Curiosity’s images and scientific and engineering data.

Tosol is Sol 71 and Curiosity is now 10 weeks into her two year long mission to investigate whether Mars ever had conditions sufficient to sustain microbial life forms.

Curiosity made a pinpoint landing inside Gale Crater on Aug. 5/6, just a few miles away from her ultimate destination – the sedimentary lower layers of Mount Sharp holding deposits of hydrated minerals.


Video Caption: This 256 frame video clip shows the 1st sample of Martian material being vibrated inside Curiosity’s table spoon sized scoop on Oct. 7, 2012.

Ken Kremer

Endeavour’s 2-Day Drive Through LA in Less Than 3 Minutes

Here’s a fantastic timelapse compilation of space shuttle Endeavour’s big drive through the streets of Los Angeles. Photographer/cinematographer Matthew Givot and his team followed the shuttle during the 2-day ‘endeavor’ — a drive that included photo-ops of the shuttle driving past several well-known L.A. landmarks. There were also some tight squeezes and ‘back-up-and-start-over’ turns and corners. Driving a space shuttle through a metropolis like LA is a little more complicated than initially thought, as the trip took 17 hours longer than originally planned. But it’s obvious from the reactions of the crowds and the look on people’s faces that Endeavour will be well-loved in her new home.

Mission 26 The Big Endeavour from Givot on Vimeo.

Below is another video of the move from NASA:

If you want to see more of the move, Robert Pearlman from collectSPACE.com has a gallery of over 150 images of the drive, and NASA’s Flickr page has a huge collection, too. Here’s a great one from Robert:

Space shuttle Endeavour drives by the iconic Randy’s Donuts in LA. Credit: Robert Pearlman, collectSPACE.com

Isotopic Evidence of the Moon’s Violent Origins

Artist’s impression of an impact of two planet-sized worlds (NASA/JPL-Caltech)

Scientists have uncovered a history of violence hidden within lunar rocks, further evidence that our large, lovely Moon was born of a cataclysmic collision between worlds billions of years ago.

Using samples gathered during several Apollo missions as well as a lunar meteorite that had fallen to Earth (and using Martian meteorites as comparisons) researchers have observed a marked depletion in lunar rocks of lighter isotopes, including those of zinc — a telltale element that can be “a powerful tracer of the volatile histories of planets.”

The research utilized an advanced mass spectroscopy instrument to measure the ratios of specific isotopes present in the lunar samples. The spectrometer’s high level of precision allows for data not possible even five years ago.

Scientists have been looking for this kind of sorting by mass, called isotopic fractionation, since the Apollo missions first brought Moon rocks to Earth in the 1970s, and Frédéric Moynier, PhD, assistant professor of Earth and Planetary Sciences at Washington University in St. Louis — together with PhD student, Randal Paniello, and colleague James Day of the Scripps Institution of Oceanography — are the first to find it.

The team’s findings support a now-widely-accepted hypothesis — called the Giant Impact Theory, first suggested by PSI scientists William K. Hartmann and Donald Davis in 1975 — that the Moon was created from a collision between early Earth and a Mars-sized protoplanet about 4.5 billion years ago. The effects of the impact eventually formed the Moon and changed the evolution of our planet forever — possibly even proving crucial to the development of life on Earth.

(What would a catastrophic event like that have looked like? Probably something like this:)

Read more: What’s the Moon Made Of? Earth, Most Likely.

“This is compelling evidence of extreme volatile depletion of the moon,” said Scripps researcher James Day, a member of the team. “How do you remove all of the volatiles from a planet, or in this case a planetary body? You require some kind of wholesale melting event of the moon to provide the heat necessary to evaporate the zinc.”

In the team’s paper, published in the October 18 issue of Nature, the researchers suggest that the only way for such lunar volatiles to be absent on such a large scale would be evaporation resulting from a massive impact event.

“When a rock is melted and then evaporated, the light isotopes enter the vapor phase faster than the heavy isotopes, so you end up with a vapor enriched in the light isotopes and a solid residue enriched in the heavier isotopes. If you lose the vapor, the residue will be enriched in the heavy isotopes compared to the starting material,” explains Moynier.

The fact that similar isotopic fractionation has been found in lunar samples gathered from many different locations indicates a widespread global event, and not something limited to any specific regional effect.

The next step is finding out why Earth’s crust doesn’t show an absence of similar volatiles, an investigation that may lead to clues to where Earth’s surface water came from.

“Where did all the water on Earth come from?” asked Day. “This is a very important question because if we are looking for life on other planets we have to recognize that similar conditions are probably required. So understanding how planets obtain such conditions is critical for understanding how life ultimately occurs on a planet.”

“The work also has implications for the origin of the Earth,”  adds Moynier, “because the origin of the Moon was a big part of the origin of the Earth.”

Read more on the Washington University news release and at the UC San Diego news center.

Inset image: Cross-polarized transmitted-light image of a lunar rock. Photo by James Day, Scripps/UCSD

Keeping an Earthly Eye on Io’s Insane Volcanic Activity

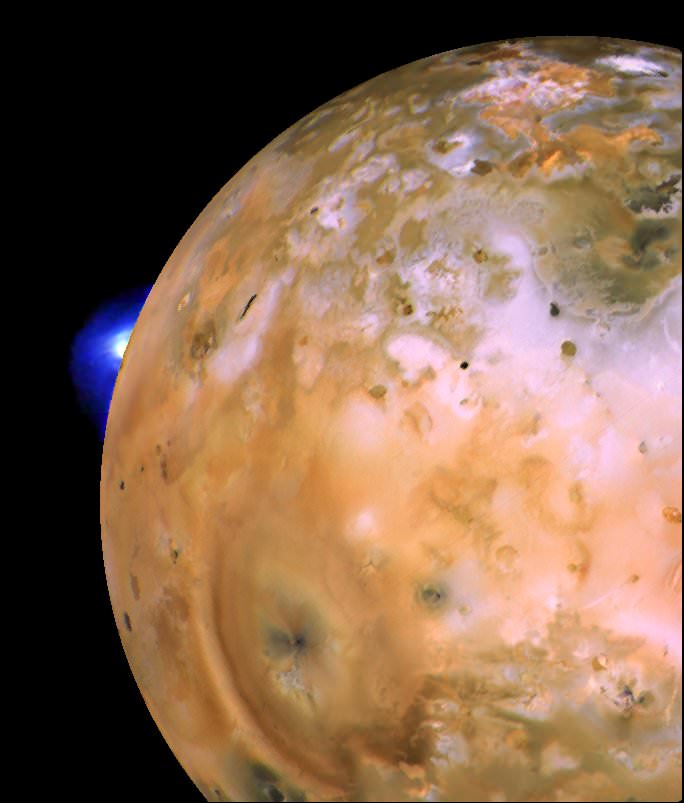
Although space missions Voyager and Galileo observed evidence of volcanic activity on Io, it was a faint blue plume at the edge of Io’s limb in a highly-enhanced image from Voyager that first offered evidence of the moon’s turbulent nature.

You fancy yourself an armchair astronomer? A group of California researchers have stepped it up a notch by monitoring the intense volcanic eruptions on Jupiter’s strangest moon Io from the comfort of their home.

Io, the innermost of the four largest moons around Jupiter, or the Galilean moons, is the most volcanically active object in the Solar System with more than 400 active volcanoes spitting out plumes of sulfur and sulfur dioxide. Scientists think a gravitational tug-of-war with Jupiter is one cause of Io’s intense vulcanism. Researchers point out that most of the processes are not well understood. While Io’s eruptions can’t be seen directly from Earth, a team led by Frank Marchis, a researcher at the Carl Sagan Center of the SETI Institute have come up with an unique combination of Earth-based telescope arrays and archival imagery from the Voyager and Galileo probes, according to a press release. The team announced their findings at the 2012 Division of Planetary Sciences meeting today in Reno, Nevada.

“Since our first observation of Io in 2001 using the W. M. Keck II 10-m telescope from the top of Mauna Kea in Hawaii and its AO (adaptive optics) system, our group became very excited about the technology,” says Marchis. “We also began using AO at the Very Large Telescope in Chile, and at the Gemini North telescope in Hawaii. The technology has improved over the years, and the image quality and usefulness of those complex instruments has made them part of the essential instrument suite for large telescopes.”

A faint blue plume on a grainy and highly enhanced image from Voyager 1 first hinted at Io’s dynamic nature. Voyager’s cameras showed a bizarre terrain of volcanic fields, dark spots and active plumes. Scientists nicknamed it the “Pizza Moon.” NASA’s Galileo probe observed more than 160 active volcanoes in various stages of eruption during its looping tour of the solar system’s largest planet.

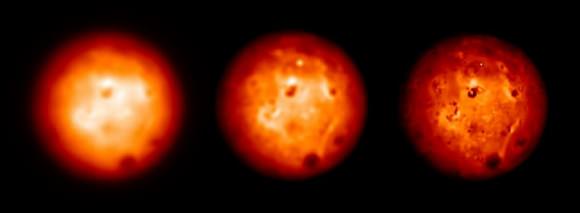
But crystal clear pictures from Galileo ceased in 2003. Observing a Moon-sized object at the incredible distance to Jupiter from Earth is a challenge because of the blurring caused by Earth’s stirring atmosphere. Since 2001, all large 8- to 10-meter telescopes have been equipped with adaptive optics that correct for that blur. Since 2003, Marchis and his team have gathered about 40 cycles of observations of Io in the near-infrared showing details as small as 100 kilometers, or 60 miles, on the surface of the moon.

Observations of several bright & young eruptions detected at short wavelengths (~2.1 microns) on the top and longer wavelengths (~3.2 microns) on the bottom since 2004 using the W. M. Keck 10-meter telescope (May 2004, Aug 2007, Sep 2007, July 2009), the Gemini North 8-meter telescope (Aug 2007), and the ESO VLT-Yepun 8-meter telescope (Feb 2007), all with their adaptive optics systems. The thermal signature of the Tvashtar outburst can be seen near the north pole on images collected in 2007. A new eruption on Pillan Patera was seen in Aug 2007. A young and bright eruption was detected on Loki Patera in July 2009. This is the last bright eruption that was detected in our survey; since then, Io’s volcanic activity has been quiescent. Credit: F. Marchis

“Spacecraft have only been able to capture fleeting glimpses of Io’s volcanoes, Voyager for a few months, Galileo a few years, and New Horizons a few days. Ground-based observations, on the other hand, can continue to monitor Io’s volcanoes over long time-scales. The more telescopes looking at Io, the better time coverage we can obtain.” Said Julie Rathbun from Redlands University, a planetary scientist not directly involved in this study but who has conducted monitoring of Io with NASA’s IRTF 3-meter telescope for more than 15 years. “AO observations from 8-10m class telescopes are a dramatic improvement in spatial resolution over previous ground-based observations. Soon they will not only be our only way to monitor Io’s volcanoes, but the best way. We should be making these observations more often.”

Simulation of observations of Io using the W. M. Keck telescope and its current AO system, a next-generation AO system mounted on the W. M. Keck telescope (KNGAO), and the Thirty Meter Telescope (TMT) equipped with its AO system (NFIRAOS). The spatial resolution on the center of Io provided by these AO systems is respectively 140 km, 110 km and 35 km in the H band (1.6 microns). Two young eruptive centers labeled A & B can be detected only on the TMT observations. The KNGAO instrument detected the brightest eruption labeled A. Credit: F. Marchis

According to the team, observations reveal a series of young and energetic eruptions called outbursts. These events stand out indicating a high eruption temperature. Coincidentally, the team observed the awakening of the volcano Tvashtar while New Horizons slingshot past Jupiter on its way to Pluto. The eruption lasted from April 2006 to September 2007. Older observations from Galileo show a similar eruption pattern in 1999 lasting for 15 months.

“The episodicity of these volcanoes points to a regular recharge of magma storage chambers” said Ashley Davies a volcanologist at the Jet Propulsion Laboratory, California Institute of Technology, and a member of the study. “This will allow us to model the eruption process and understand the how heat is removed from Io’s deep interior by this particular style of volcanic activity.”

The team found four additional eruptions including a previously unobserved active volcano in 2004. The new sporadic blast accounted for about 10 percent of Io’s average thermal output, according to Marchis. The outburst was more energetic than Tvashtar in 2001. While the team continues to study Io, they have noted that since September 2010, the crazily active moon has been mostly quiet. A dozen or so permanent, low temperature eruptions dot the globe but the team has not detected the young, fire fountain style eruptions seen before.

“The next giant leap in the field of planetary astronomy is the arrival of Giant Segmented Mirror Telescopes, such as the Thirty Meter Telescope expected to be available in 2021. It will provide a spatial resolution of 35 km in the near-infrared, equivalent to the spatial resolution of global observations taken by the Galileo spacecraft. When pointed at Io, these telescopes will offer the equivalent of a spacecraft flyby of the satellite,” Marchis said.

Source: SETI

Book Review: Information, Communication and Space Technology

I was worried that the book “Information, Communication and Space Technology” had the potential to be ‘jack of all trades, master of none,’ as it promises to cover all aspects of ICT and space tech, all in 200-ish pages. But I needn’t have worried. Author Mohammad Razani delivers on the ambitious goal of presenting a high level picture on all topics of Information Communication Technology(ICT) and space technology.

Although at times it seems as though there is a distinct split between the ICT and the space tech content, the author presents his information in a manner which most tech-heads and gear-geeks would love. But this book is not for the average fiction-inclined reader. Some previous knowledge is required.


It begins with covering the very large topic of ICT in health, government and education. At times it feels as though this half of the book is there to balance to latter space tech half of the book, like a student presenting the ‘boring bits’ before going crazy about ‘space technologies!!!’. He does skim over some points a little, but this keeps it interesting and exciting because it doesn’t get bogged down in the fine details. This means the book is not too overwhelming, but it remains informative by presenting enough detail.

There is the potential for some of the content to be interpreted as opinion piece…which at times it kind of is. He presents arguments for further resources and investment into ICT in education, particularly in the USA, where he is an educational professional. However, it’s presented objectively and doesn’t read as though he is shouting from the soap box. And there are enough references cited for each point he makes to make each argument objective (if that is not an oxymoron). He presents cases studies, tables and stats for the numerically-minded readers and is a reflection of past ICT and statistics to dictate possible direction of future ICT. Mohammad Razani presents studies on what challenges there are in ICT for health, gov and education, and the possible future solutions through case studies. Not being previously familiar with a lot of the industries issues he covered, I’ve learnt a great deal.

The information presented was very detailed and pleasing for the techno-geek audience. But at times was difficult to understand the information the author uses for comparison. For example, tables on satellites from different agencies presented different measurements and specifications, making it like comparing apples with oranges.

And there seemed to be a couple of product placement mentions — e.g. the software workshop the author attended. Perhaps I am cynical, but it seemed to be like when a doctor presents a certain drug, because he gets kickbacks from the pharmaceutical company.

The space technology section was more well thought-out and exciting. You could tell that Mohammad Razani was more inspired by these topics. He gave a great background on the history and development of the space technology and satellites. The cool parts were definitely the brief scientific explanation of space flight, atmospheric studies and gravity. It kept the pages turning without becoming overwhelming. I felt I learnt a great deal without the aid of any other research or references.

Tip: start your own glossary to refer to. This reader would have benefited from a glossary, instead of having to refer to the index or re-read parts of the book where the definitions and explanations of acronyms and phrases were presented.

The highlights of this book were the scientific explanations of the relevant to content. If a reader was so inclined to do self-research on this topic, it would take them years to find all information presented in this book, without the guidance Mohammad Razani. As a reader, I am left with the hope that ICT could be used to advance all of humanity, rather than promote western culture alone. As a student this has inspired me to pursue this area of technology, as we have only just begun. It gives a great starting point for any interested readers to launch their own research and further reading. I will refer to this book for years to come. The hardcover is also a bonus!

If I had to give this book a rating, it would be 3.5 satellite dishes out of 5.