
We’ve featured wonderful time-lapse videos taken from the Space Station many times and each one is amazing to watch, but here’s something a little different: by taking photos at the rate of one per second and assembling them into a time-lapse, we can get a sense of what it’s like to orbit the planet at 240 miles up, 17,500 mph… in real time. Absolutely amazing!
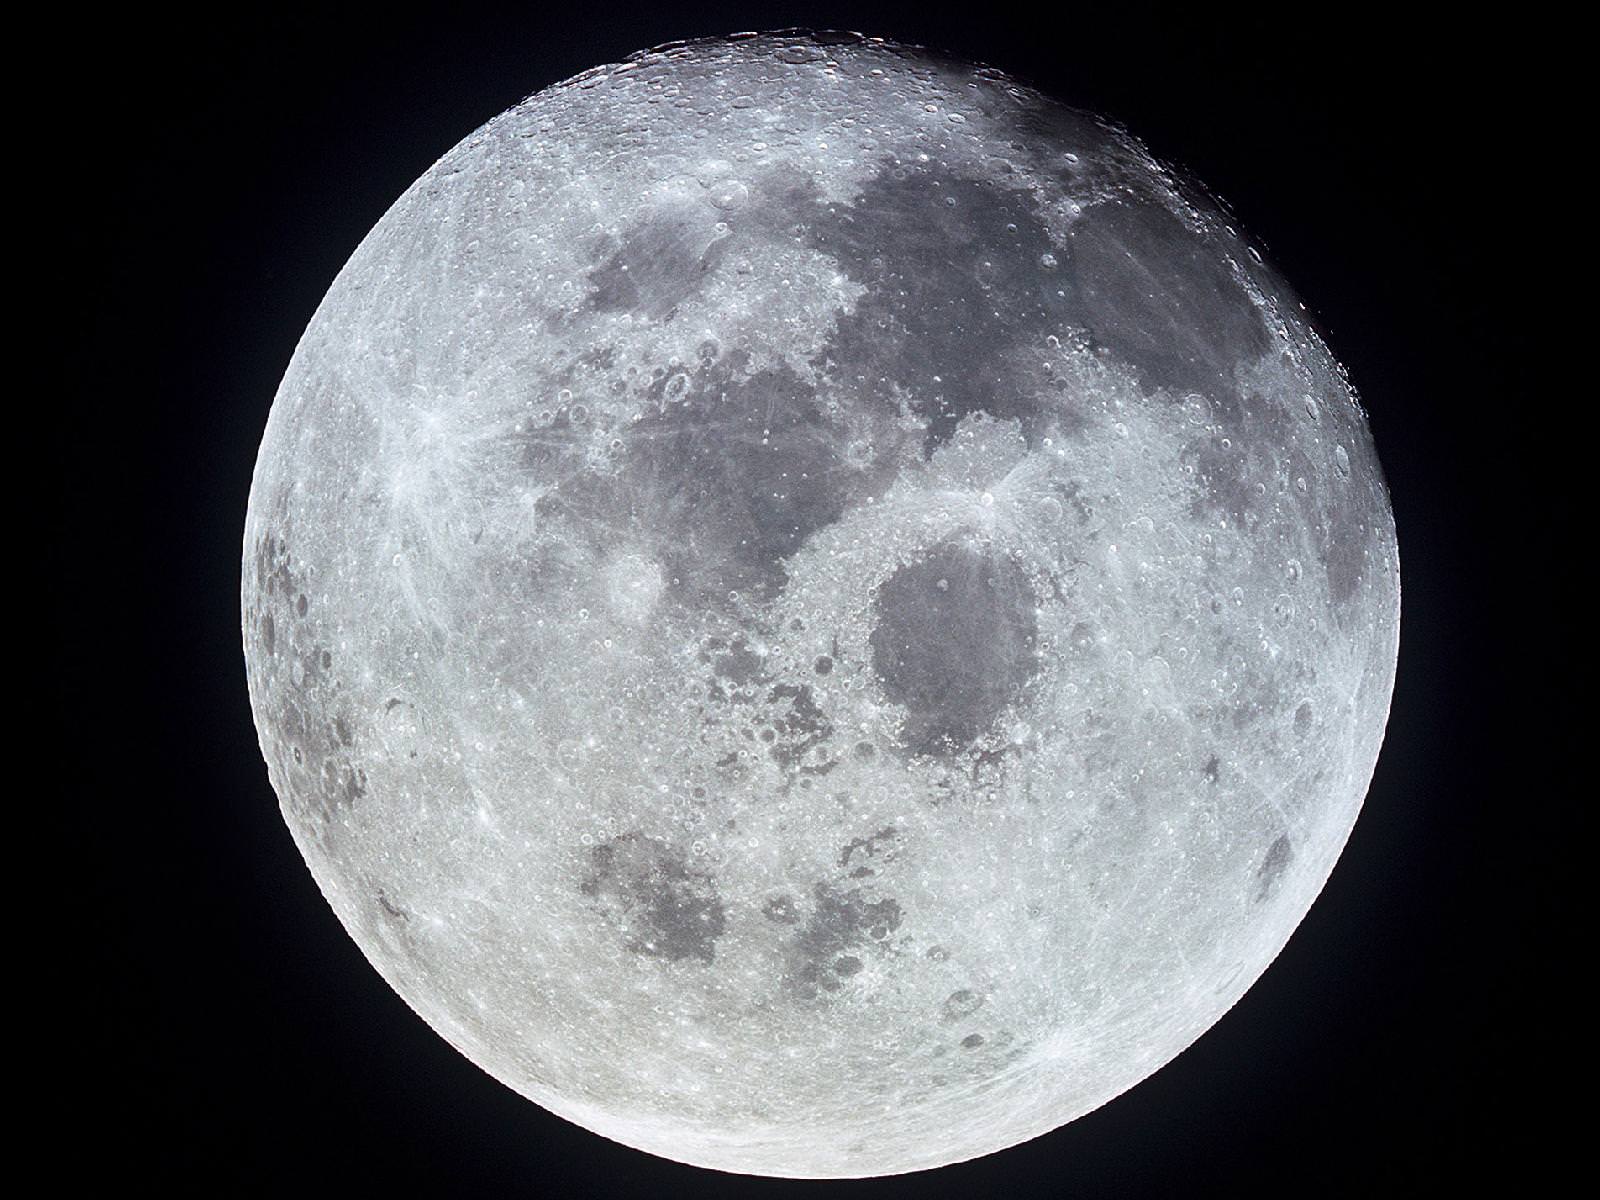
Russia Sets Its Sights on the Moon for 2020
[/caption]
Looks like Republican Presidential hopeful Newt Gingrich might have some competition if he wants to be the first to build a base on the Moon. Last week, the Russian Space Agency Roscosmos announced plans to put a man on the Moon by the end of the decade with a lunar base as its next step.
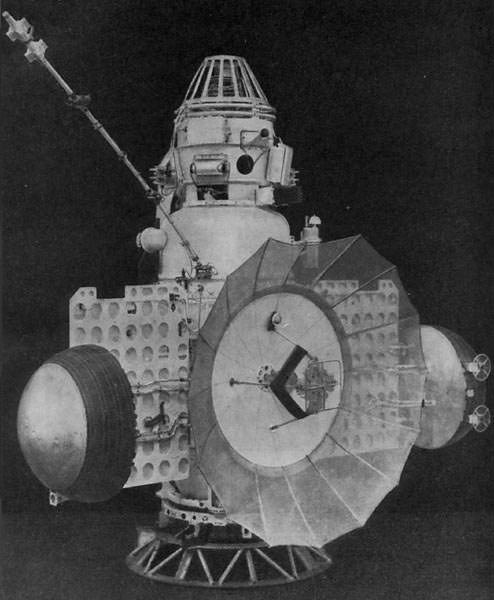
After canceling its lunar Zond program in early 1970s, the former Soviet Union took aim elsewhere in space. In 1998, Russia jumped back in the Moon game with Luna Glob, a series of robotic missions to the Moon that could come together to make a lunar orbiting space station or a base on the surface.
Now, Russia’s sights are set on a manned mission. “Man should return to the Moon,” head of Roscosmos Vladimir Popovkin told the Ekho Moskvy radio station. “And not just like in 1969, to leave a mark. We can do important work there.” He lists solar observation among the science goals.
More recently, another opportunity has arisen for Russia to pursue a lunar program. In 2008, NASA proposed the creation of an International Lunar Network, a set of interconnected manned bases scattered over the surface of the Moon. Popovkin said recently that Russia may coordinate with the European Space Agency and join the ILN.
Russia’s lunar announcement comes on the heels of a bad year for Roscosmos. The agency lost five missions in 2011, including the Phobos-Grunt mission that never reached its target Martian Moon. After months in Earth orbit it fell through the atmosphere earlier this year. This most recent loss might be the spark behind the new push for exploration. “Perhaps, we need a more specific, realistic Moon program, and do any Mars research as a part of a bigger international program,” Anatoliy Davydov, the deputy head of Roscosmos, said in the aftermath of the Phobos-Grunt failure.
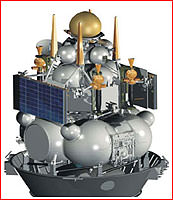
But the loss of Phobos-Grunt could anticipate trouble on the Luna Glob missions and any later attempts to reach the Moon. Luna Glob is technologically similar to the failed Mars mission, which means it shares the same vulnerabilities. There will have to be some major changes before Russia can move forward towards the Moon. “The design decisions used on Phobos-Grunt need to be reconsidered and significantly adjusted. Unfortunately, the same ones are used on the lunar missions. This is likely to push back the dates of any future launches, particularly of the Luna Glob modules” said Lev Zelenkin, who is closely involved with both projects.
Another variable in a Russian lunar program is NASA’s possible withdrawal from the ESA-based ExoMars mission. If NASA does pull out, the ESA hopes Roscosmos will step in. Not having NASA’s power and experience on Mars will certainly change the mission, as well Russia’s involvement. The country’s track record on Mars isn’t stellar, and a decision to tempt that galactic ghoul again with another mission to the red planet would likely supercede any Russian missions to the Moon.

If Russia does turn its attention to manned lunar missions and eventually a lunar base, anyone will be eligible to go. Roscosmos is looking for volunteer cosmonauts through an X-Factor style search it hopes will rekindle public interest in Russian spaceflight. If you have a scientific or medical degree, are fluent in English, and wear shoes no bigger than a UK size 11, you could be the first cosmonaut to leave a boot print on the lunar surface.
Source: RT
Dancing Water Drops In Earth Orbit
An astronaut once told me that fellow space flier Don Pettit could fix anything with a paper clip. Indeed, Pettit has nicknames like Mr. Wizard and Mr. Fixit, and he is well-known for his Saturday Morning Science videos during his first stay on the International Space Station and his “Zero G Coffee Cup” from a space shuttle mission he was on in 2008. Now in his second long-duration stint on the ISS, Pettit has a new video series called “Science off the Sphere” and the first video is above. Pettit uses “knittin” needles (watch the video to hear Pettit’s pronunciation) and water droplets to demonstrate physics in space, and shows what fun astronauts can have with water in zero-G with his ‘dancing’ water droplets.
This new video series is partnership between NASA and the American Physical Society. But there’s more than just videos, as at the end of each video Pettit poses a challenge question. Submit your answers at the Science Off the Sphere website for a chance to have your name read from space and receive a snazzy t-shirt from Earth.
Here’s this week’s Challenge Question:
Continue reading “Dancing Water Drops In Earth Orbit”
New Avalanche in Action on Mars Captured by HiRISE
[/caption]
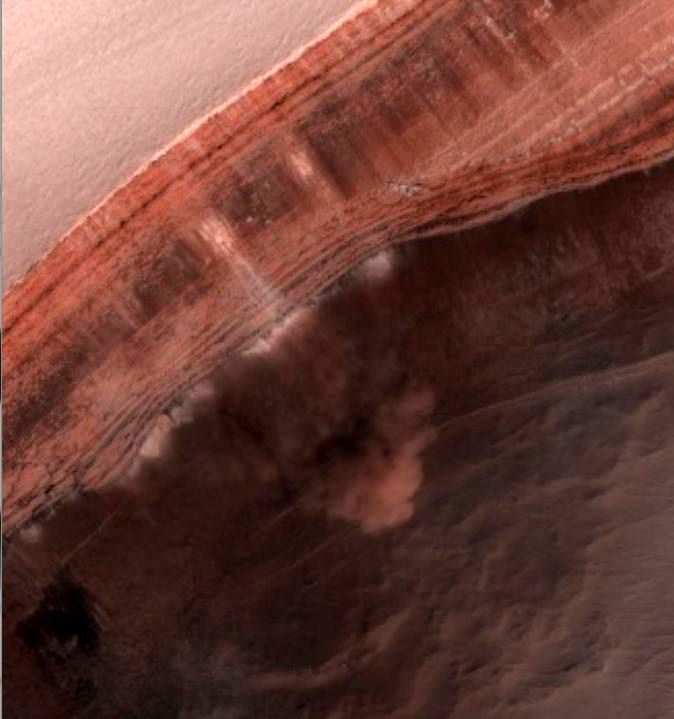
Its avalanche season on Mars! And once again the HiRISE camera on the Mars Reconnaissance Orbiter has captured an avalanche taking place on a steep cliff or scarp in Mars’ north polar region. Back in 2008, the HiRISE team created quite a sensation when it captured an avalanche in action on Mars. The high resolution camera did it again in 2010 when springtime arrived once more. Now, another Mars year later, the team has been monitoring specific areas, looking for evidence of avalanches and they hit pay dirt – literally. This image of an avalanche taking place is from a large image “strip” from HiRISE taken in the extreme northern latitude of Mars, about 85 degrees north.
Dust, fine-grained ice and possibly large blocks of either regolith or rocks has detached from a steep, towering cliff and cascaded below. The HiRISE team say the occurrence of avalanches is spectacularly revealed by the accompanying clouds of fine material that continue to settle out of the air.
The avalanches are a result of carbon-dioxide frost that clings to the scarp in the darkness of winter, and when sunlight hits them in the spring they loosen up and fall.
These events happen mostly in the middle of spring, roughly equivalent to April to early May on Earth. And it seems this is a regular spring process at Mars’ north pole that may be expected every year.
This image is part of the latest PDS release from HiRISE.
Hat tip: Jason Major and Discovery Space
The Milky Way Galactic Disk – Forever Blowing Bubbles
[/caption]
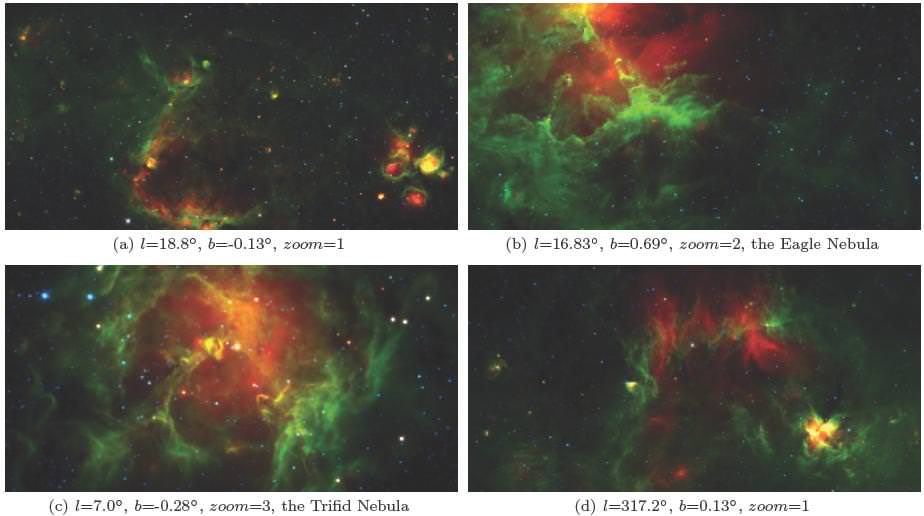
Score another one for citizen science! In a study released just days ago, a new catalog containing over five thousand infrared bubble entries was added through the “Milky Way Project” website. The work was done independently by at least five participants who measured parameters for position, radius, thickness, eccentricity and position angle. Not only did their work focus on these areas, but the non-professionals were responsible for recovering the locations of at least 86% of additional bubble and HII catalogs. Cool stuff? You bet. Almost one third of the Milky Way Project’s studied bubbles are located at the edge of an even larger bubble – or have more lodged inside. This opens the door to further understanding the dynamics of triggered star formation!
Just what is the Milky Way Project? Thanks to the Galaxy Zoo and Zooniverse, scientists have been able to enlist the help of an extensive community of volunteers able to tackle and analyze huge amounts of data – data that contains information which computer algorithms might miss. In this case it’s visually searching through the Galactic plane for whole or broken ring-shaped structures in images done by Spitzer’s Galactic Legacy Infrared Survey Extraordinaire (GLIMPSE) project. Here the bubbles overlap and the structures are so complex that only humans can sort them out for now.

(API) tool set. The Zooniverse API is the core software supporting the activities of all Zooniverse citizen science projects.” says R. J. Simpson (et al). “Built originally for Galaxy Zoo 2, the software is now being used by 11 different projects. The Zooniverse API is designed primarily as a tool for serving up a large collection of `assets’ (for example, images or video) to an interface, and collecting back user-generated interactions with these assets.”
Through the interface, users mark the location of bubbles and other areas of significance such as small bubbles, green knots, dark nebulae, star clusters, galaxies, fuzzy red objects or simply unknowns. During this phase, the citizen scientist can make as many annotations as he or she wants before they submit their findings and receive a new assignment. Each annotated image is then stored in a database as a classification and the user can access their image again in an area of the website known as “My Galaxy”. However, images may only be classified once.

“In order to assist in the data-reduction process, users are given scores according to how experienced they are at drawing bubbles. We treat the first 10 bubbles a user draws as practice drawings and these are not included in the final reduction. Users begin with a score of 0 and are given scores according to the number of precision bubbles they have drawn.” explains the team. “Precision bubbles are those drawn using the full tool set, meaning they have to have adjusted the ellipticity, the thickness and the rotation. This is done to ensure that users’ scores reflect their ability to draw bubbles well. While only precision bubbles are used to score volunteers, all bubbles drawn as included in the data reduction. The scores are used as weights when averaging the bubble drawings to produce the catalogue.”
Now it’s time to combine all that data. As of October of last year, the program has created a database of 520,120 user-drawn bubbles. The information is then sorted out and processed – with many inclusions left for further investigation. However, not all bubbles make the cut. When it comes to this project, only bubbles that have been identified fifty times or more are included into the catalog. What remains is a “clean bubble” – one that has been verified by at least five users and picked out at least 10% of the time by the volunteers when displayed.
“It is not known how many bubbles exist in the Galaxy, hence it is impossible to quantify the completeness of the MWP catalogue. There will be bubbles that are either not visible in the data used on the MWP, or that are not seen as bubbles.” says the team. “Distant bubbles may be obscured by foreground extinction. Faint bubbles may be masked by bright Galactic background emission or confused with brighter nebular structures. Fragmented or highly distorted bubbles present at high inclination angles may not appear as bubbles to the observer.”

And that’s not all… “In addition to the reduced bubble catalogue, a crowd sourced `heat map’ of bubble drawings has also been produced. The MWP `heat maps’ allow the bubble drawings to be explored without them needing to be reduced to elliptical annuli. Rather, the `heat maps’ allow contours of overlapping classifications to be drawn over regions of the Galactic plane reflecting levels of agreement between independent classifiers. In most cases the structures outlined in these maps are photo-dissociation regions traced by 8 um emission, but more fundamentally they are regions that multiple volunteers agree reflect the rims of bubbles.”
Yep. They are bubbles alright. Bubble produced around huge stars when an HII region is hollowed out by thermal overpressure, stellar winds, radiation pressure or a combination of them all. This impacts the surrounding, cold interstellar medium and creates a visible shell – or bubble. These regions serve as perfect observation points “to test theories of sequential, massive star formation triggered by massive star winds and radiation pressure” and to keep us forever fascinated…
And forever studying bubbles.
Original Story Source: The Milky Way Project First Data Release: A Bubblier Galactic Disk. For Further Reading: The Milky Way Project Zooniverse Blog.
Hauntingly Beautiful Aurora Video
Time-lapse photographer Christian Mülhauser braved sub-zero temperatures and frozen camera equipment to capture this stunning aurora footage from Norway during the last week of January 2012.
Powerful solar storms in January made for some impressive auroral displays… thanks to Christian for capturing them on camera!
600 Million Year Drought Makes Life on Surface of Mars Unlikely

[/caption]
Mars is often referred to as a desert world, and for good reason – its surface is barren, dry and cold. While water was abundant in the distant past, it has long since disappeared from the surface, although ice, snow, frost and fog are still common. Other than liquid brines possibly trickling at times, all of Mars’ remaining water is now frozen in permafrost and in the polar ice caps. It has long been thought that the harsh conditions would make current life unlikely at best, and now a new study reaffirms that view.
The results come from continued analysis of the data from the Phoenix lander mission, which landed in the arctic region near the north pole of Mars in 2008. They suggest that Mars has experienced a prolonged drought for at least the past 600 million years.
According to Dr. Tom Pike from Imperial College London, “We found that even though there is an abundance of ice, Mars has been experiencing a super-drought that may well have lasted hundreds of millions of years. We think the Mars we know today contrasts sharply with its earlier history, which had warmer and wetter periods and which may have been more suited to life. Future NASA and ESA missions that are planned for Mars will have to dig deeper to search for evidence of life, which may still be taking refuge underground.”
The team reached their conclusions by studying tiny microscopic particles in the soil samples dug up by Phoenix, which had been photographed by the lander’s atomic-force microscope. 3-D images were produced of particles as small as 100 microns across. They were searching specifically for clay mineral particles, which form in liquid water. The amount found in the soil would be a clue as to how long the soil had been in contact with water. It was determined that less than 0.1 percent of the soil samples contained clay particles, pointing to a long, arid history in this area of Mars.
Since the soil type on Mars appears to be fairly uniform across the planet, the study suggests that these conditions have been widespread on the planet, and not just where Phoenix landed. It’s worth keeping in mind though that soil particles and dust on Mars can be distributed widely by sandstorms and dust devils (and some sandstorms on Mars can be planet-wide in size). The study also implies that Mars’ soil may have only been exposed to liquid water for about 5,000 years, although some other studies would tend to disagree with that assessment.
It should also be noted that more significant clay deposits have been found elsewhere on Mars, including the exact spot where the Opportunity rover is right now; these richer deposits would seem to suggest a different history in different regions. Because of this, and for the other reasons cited above, it may be premature then to extrapolate the Phoenix results to the entire planet, similar soil types notwithstanding. While this study is important, more definitive results might be obtained when physical soil samples can actually be brought back to Earth for analysis, from multiple locations. More sophisticated rovers and landers like the Curiosity rover currently en route to Mars, will also be able to conduct more in-depth analysis in situ.
The Phoenix soil samples were also compared to soil samples from the Moon – the distribution of particle sizes was similar between the two, indicating that they formed in a similar manner. Rocks on Mars are weathered down by wind and meteorites, while on the airless Moon, only meteorite impacts are responsible. On Earth of course, such weathering is caused primarily by water and wind.
As for the life question, any kind of surface dwelling organisms would have to be extremely resilient, much like extremophiles on Earth. It should be kept in mind, however, that these results apply to surface conditions; it is still thought possible that any early life on the planet could have continued to thrive underground, protected from the intense ultraviolet light from the Sun, and where some liquid water could still exist today.
Given Mars’ much wetter early history, the search for evidence of past or present life will continue, but we may have to dig deep to find it.
Asteroid Vesta Floats in Space in High Resolution 3-D
[/caption]
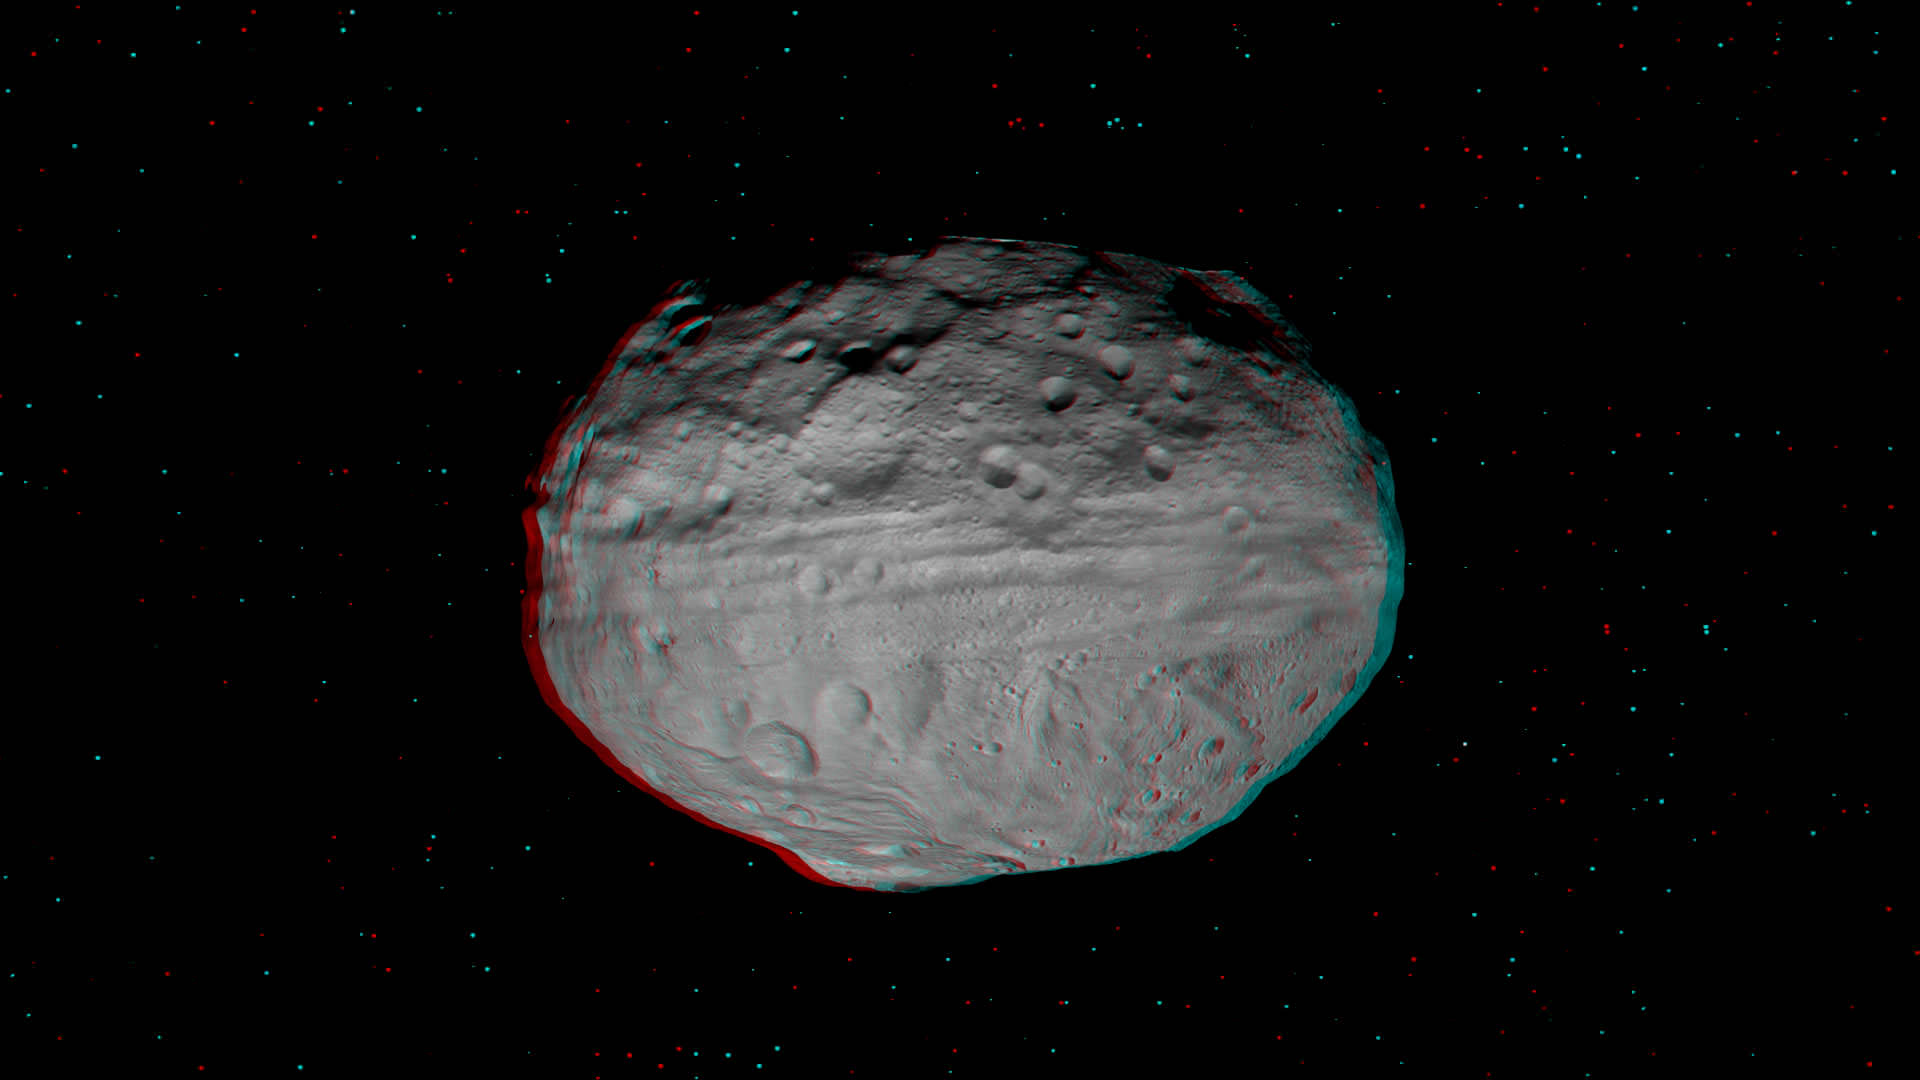
The giant Asteroid Vesta literally floats in space in a new high resolution 3-D image of the battered bodies Eastern Hemisphere taken by NASA’s Dawn Asteroid Orbiter.
Haul out your red-cyan 3-D anaglyph glasses and lets go whirling around Vesta and sledding down mountains to greet the alien Snowman! The sights are fabulous !
The Dawn imaging group based at the German Aerospace Center (DLR), in Berlin, Germany and led by team member Ralf Jaumann has released a trio of new high resolution 3-D images that are the most vivid anaglyphs yet published by the international science team.
The lead anaglyph shows the highly varied topography of the Eastern Hemisphere of Vesta and was taken during the final approach phase as Dawn was about 5,200 kilometers (3,200 miles) away and preparing to achieve orbit in July 2011.
The heavily cratered northern region is at top and is only partially illuminated because of Vesta’s tilted angle to the Sun at that time of year. Younger craters are overlain onto many older and more degraded craters. The equatorial region is dominated by the mysterious troughs which encircle most of Vesta and may have formed as a result of a gargantuan gong, eons ago.
The southern hemisphere exhibits fewer craters than in the northern hemisphere. Look closely at the bottom left and you’ll see the huge central mountain complex of the Rheasilvia impact basin visibly protruding out from Vesta’s south polar region.
This next 3-D image shows a close-up of the South Pole Mountain at the center of the Rheasilvia Impact basin otherwise known as the “Mount Everest of Vesta”.
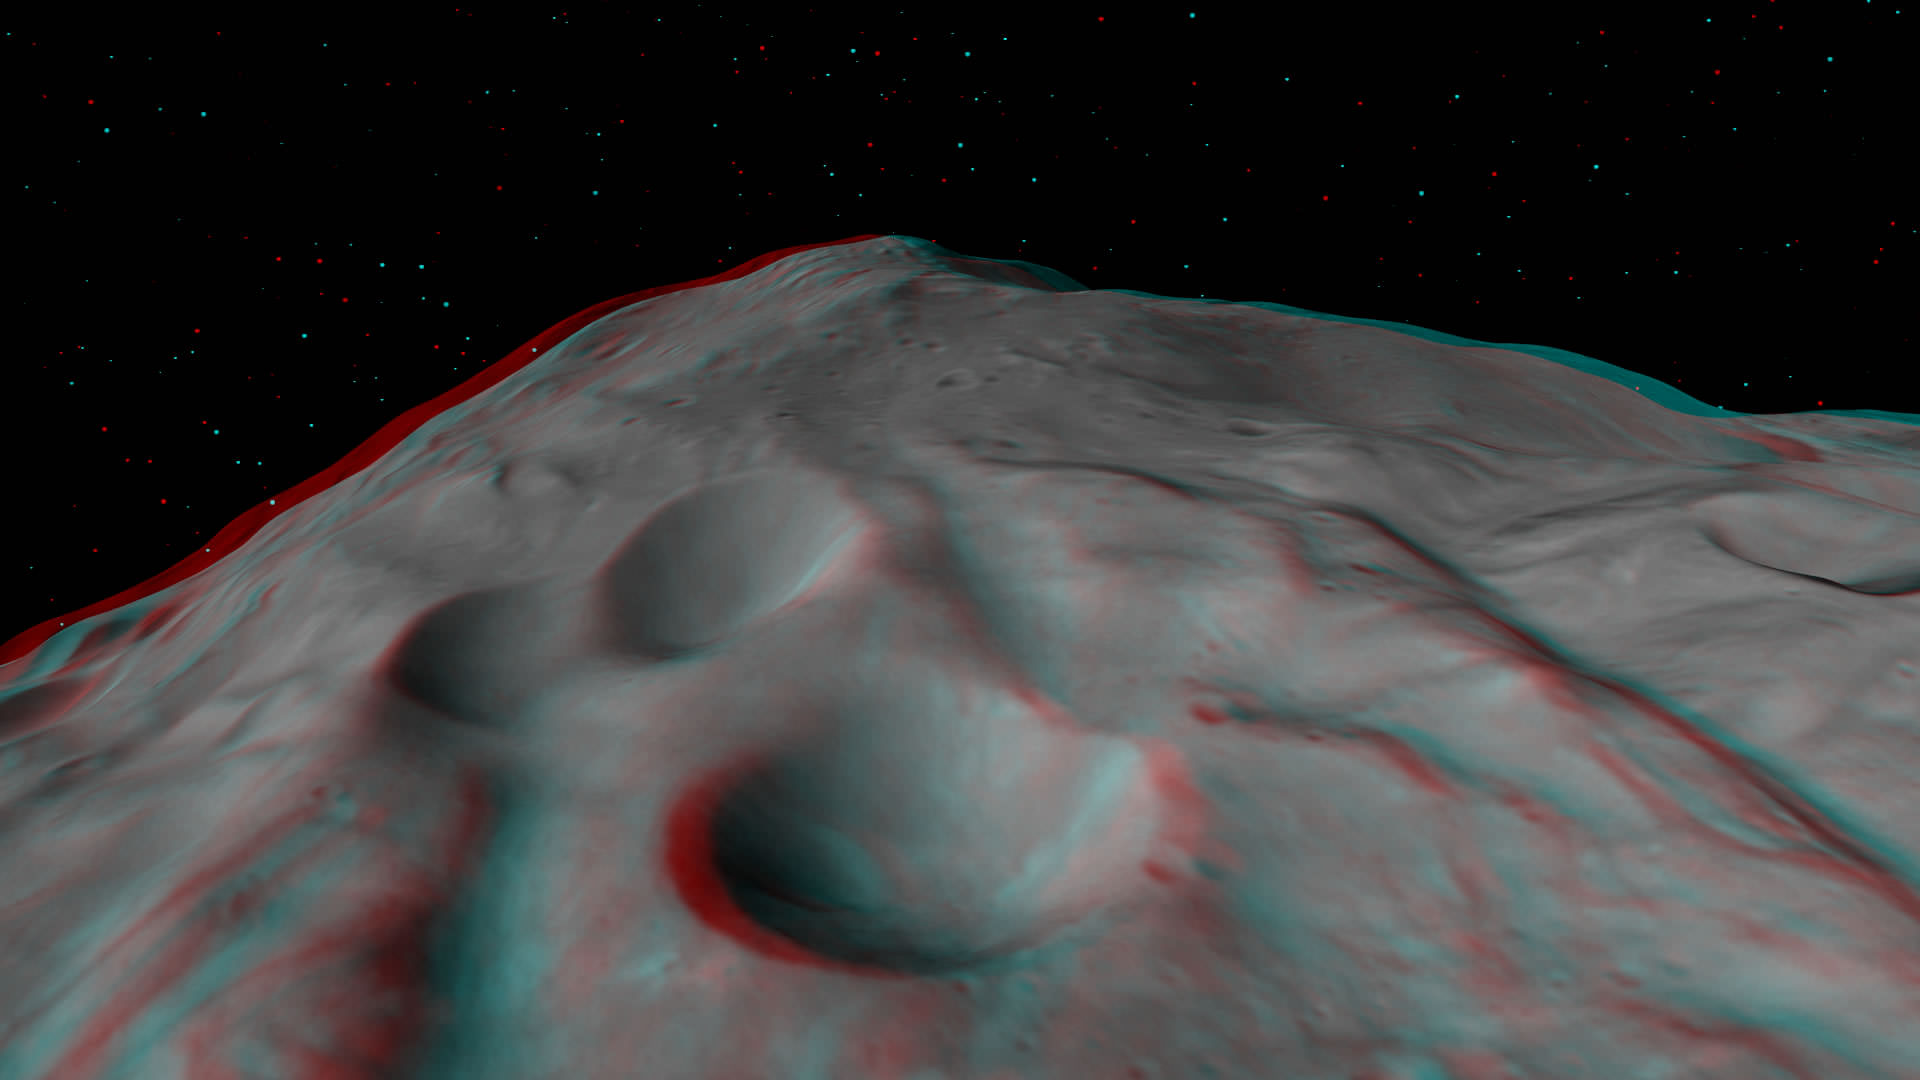
This anaglyph shows the central complex and huge mountain in Vesta’s Rheasilvia impact basin at the South Pole. Does water ice lurk beneath the South Pole ?
Credit: NASA/JPL-Caltech/UCLA/MPS/DLR/IDA.
The central complex is approximately 200 kilometers (120 miles) in diameter and is approximately 20 kilometers (12 miles) tall and is therefore about two and a half times taller than Earth’s Mount Everest!
Be sure to take a long look inside the deep craters and hummocky terrain surrounding “Mount Everest”.
A recent study concludes that, in theory, Vesta’s interior is cold enough for water ice to lurk beneath the North and South poles.
Finally lets gaze at the trio of craters that make up the “Snowman” in the 3-D image snapped in August 2011 as Dawn was orbiting at about 2,700 kilometers (1,700 miles) altitude. The three craters are named Minucia, Marcia and Calpurnia from top to bottom. Their diameters respectively are; 24 kilometers (15 miles), 53 kilometers (33 miles) and 63 kilometers (40 miles).
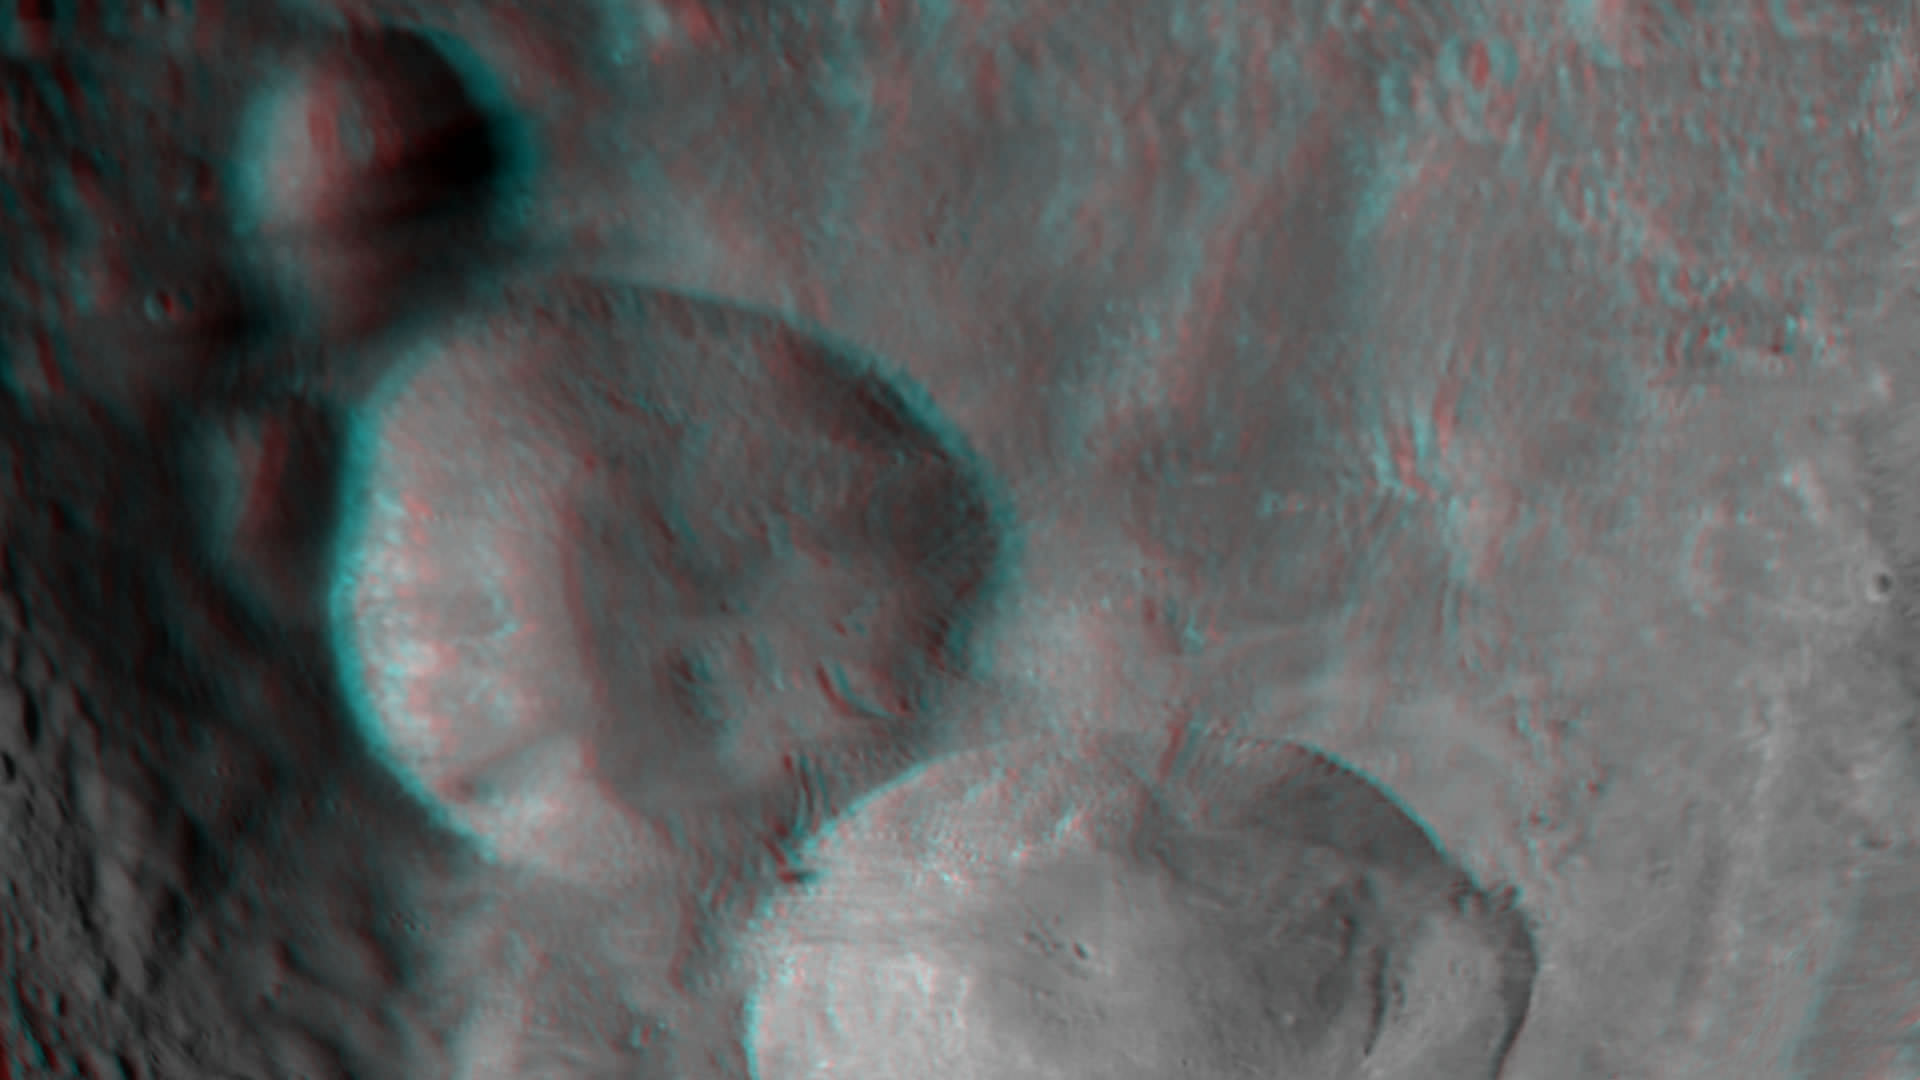
The three craters are named Minucia, Marcia and Calpurnia from top to bottom. They are 24 kilometers (15 miles), 53 kilometers (33 miles) and 63 kilometers (40 miles) in diameter, respectively. Image resolution is about 250 meters (820 feet) per pixel. Credit: NASA/JPL-Caltech/UCLA/MPS/DLR/IDA.
It is likely that Marcia and Calpurnia formed from the impact of a binary asteroid and that Minucia formed in a later impact. The smooth region around the craters is the ejecta blanket.
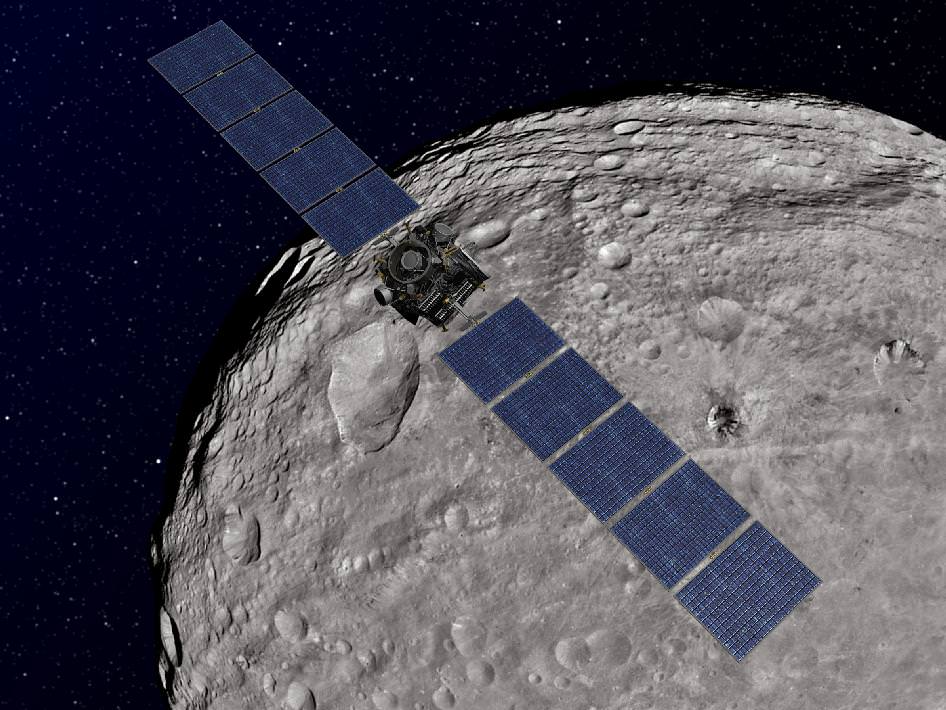
This artist's concept shows NASA's Dawn spacecraft orbiting the giant asteroid Vesta above the Snowman craters. The depiction of Vesta is based on images obtained by Dawn's framing cameras. Dawn is an international collaboration of the US, Germany and Italy. Credit: NASA/JPL-Caltech
Vesta is the second most massive asteroid in the main Asteroid Belt between Mars and Jupiter. It is 330 miles (530 km) in diameter.
Dawn is the first spacecraft from Earth to visit Vesta. It achieved orbit in July 2011 for a year long mission. Dawn will fire up its ion propulsion thrusters in July 2012 to spiral out of orbit and sail to Ceres, the biggest asteroid of them all !
Vesta and Ceres are also considered to be protoplanets.
Super Bowl Cities Seen From Space

[/caption]
If you live in or are from the US, you probably know that today is Super Bowl Sunday. Whatever you happen to be doing, be it tailgating in Indianapolis, getting together with friends and family (and plenty of hot wings and nachos) in your living room or just waiting for all the fuss to be over, remember that, high above, NASA Earth-observing satellites are working hard doing what they do best: observing the Earth. Chances are they’ve imaged your home town many times.
Whichever team you’re rooting for, here’s a little bit of space science fun: the folks over at Goddard Space Flight Center in Greenbelt, MD, have shared some Landsat images of the home cities of this year’s big game.
The image above shows the central and northern RI and southeastern Massachusetts area, with Providence and Pawtucket seen as the densely-built central region and Foxborough, MA, where the Patriots’ home stadium is located, is just to the north of the image. This image was acquired by Landsat 7 in July 2002.
(Being of my home state, I admit I’m partial to that particular shot. I was down there somewhere!)

If you’re a die-hard Giants fan, you may recognize this area… you may even be in it! It’s a Landsat 7 image of the New York metro area acquired on August 8, 2002. Manhattan is in the center, most easily recognizable from space by the green rectangle of Central Park. New Jersey is on the left side, and Brooklyn on the center-right with Long Island stretching away to the east.

If you’re lucky enough to have tickets to the big game, you may be here: it’s a Landsat image of Indianapolis, IN acquired on July 11, 2001. The Colts may not have made it this year but right now the city is definitely “ready for some football!”
Of course, team and town loyalty aside, this gorgeous image from Expedition 30 crew members aboard the ISS shows everyone all in one place on the night of January 29, 2012 – with a nice touch of northern lights thrown in for good measure:

Bright lights, big cities… but a small world, when you think about it. And remember, whichever team comes out on top today, tomorrow we’re all winners. (Until next season, of course!)
You can see these and more images from Goddard Space Flight Center on their Flickr album, and find out more about Landsat and how it benefits people around the world.
And you can follow Super Bowl XLVI news – and watch online – on the official NFL site here.
The Milky Way’s Magnetic Personality
[/caption]
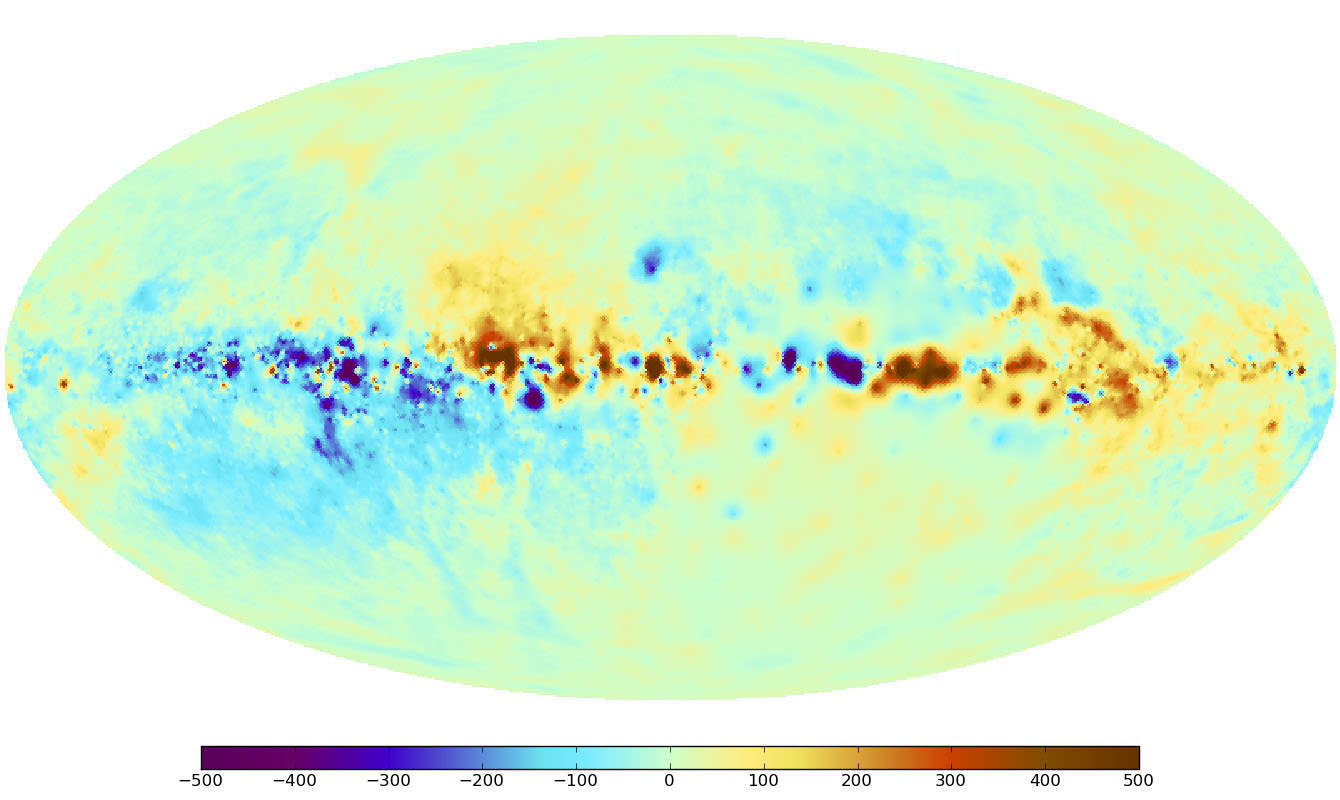
Recently we took a look at a very unusual type of map – the Faraday Sky. Now an international team of scientists, including those at the Naval Research Laboratory, have pooled their information and created one of the most high precision maps to date of the Milky Way’s magnetic fields. Like all galaxies, ours has a magnetic “personality”, but just where these fields come from and how they are created is a genuine mystery. Researchers have always simply assumed they were created by mechanical processes like those which occur in Earth’s interior and the Sun. Now a new study will give scientists an even better understanding about the structure of galactic magnetic fields as seen throughout our galaxy.
The team, led by the Max Planck Institute for Astrophysics (MPA), gathered their information and compiled it with theoretical simulations to create yet another detailed map of the magnetic sky. As NRL’s Dr. Tracy Clarke, a member of the research team explains, “The key to applying these new techniques is that this project brings together over 30 researchers with 26 different projects and more than 41,000 measurements across the sky. The resulting database is equivalent to peppering the entire sky with sources separated by an angular distance of two full moons.” This huge amount of data provides a new “all-sky” look which will enable scientists to measure the magnetic structure of the Milky Way in minute detail.

The concept of the Faraday effect isn’t new. Scientists have been observing and measuring these fields for the last century and a half. Just how is it done? When polarized light passes through a magnetized medium, the plane of the polarization flips… a process known as Faraday rotation. The amount of rotation shows the direction and strength of the field and thereby its properties. Polarized light is also generated from radio sources. By using different frequencies, the Faraday rotation can also be measured in this alternative way. By combining all of these unique measurements, researchers can acquire information about a single path through the Milky Way. To further enhance the “big picture”, information must be gathered from a variety of sources – a need filled by 26 different observing projects that netted a total of 41,330 individual measurements. To give you a clue of the size, that ends up being about one radio source per square degree of sky!

Thanks to an algorithm crafted by the MPA, scientists are able to face these types of difficulties with confidence as they put together the images. The algorithm, called the “extended critical filter,” employs tools from new disciplines known as information field theory – a logical and statistical method applied to fields. So far it has proven to be an effective method of weeding out errors and has even proven itself to be an asset to other scientific fields such as medicine or geography for a range of image and signal-processing applications.
Even though this new map is a great assistant for studying our own galaxy, it will help pave the way for researchers studying extragalactic magnetic fields as well. As the future provides new types of radio telescopes such as LOFAR, eVLA, ASKAP, MeerKAT and the SKA , the map will be a major resource of measurements of the Faraday effect – allowing scientists to update the image and further our understanding of the origin of galactic magnetic fields.
Original Story Source: Naval Research Laboratory News.