‘Oceanus Borealis’ – Mars Express Finds New Evidence for Ancient Ocean on Mars

Topographic map from Mars Global Surveyor showing colour-coded altitudes; the blue areas are the lowest and correspond to the possible ancient ocean in the northern hemisphere. Credit: NASA/JPL

[/caption]

For a long time now, evidence has continued to indicate that Mars was once a water world – near-surface groundwater, lakes, rivers, hot springs and, according to some planetary models, even an ancient ocean in the northern hemisphere. That last one in particular has been a subject of intense debate; some scientists see evidence for it while others do not. Even if it was there, it may have been a warm ocean or it may have been colder, like the polar seas here on Earth. The prospect of an ocean of any kind on early Mars is an exciting one, regarding the question of possible life way back then. The argument has swung both ways over the years, but now another new report has been published which comes down on the “yes” side.

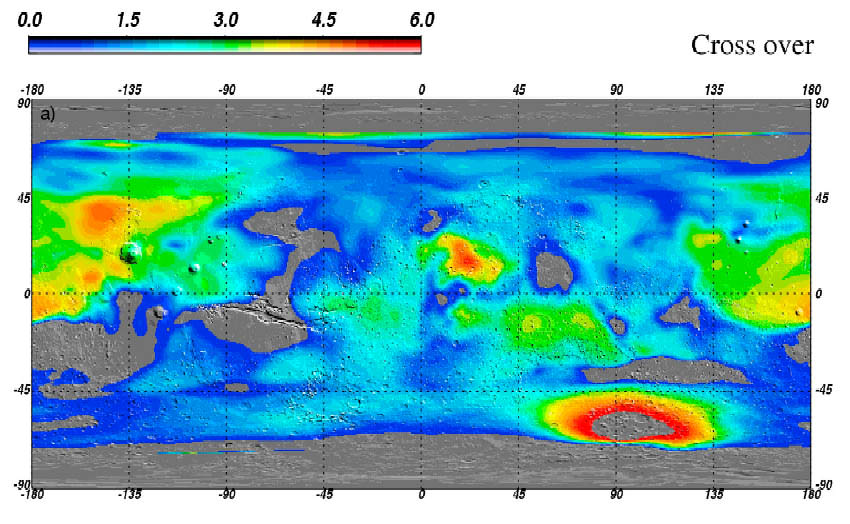
The results come from the Mars Express Orbiter – specifically its ground-penetrating radar (MARSIS) and they have just been published in Geophysical Research Letters by Jérémie Mouginot from the University of California. The findings reinforce the idea of a large ocean which occupied much of the northern hemisphere, also known as Oceanus Borealis.

The radar has mapped the sedimentary deposits within the region, known as the Vastitas Borealis Formation, which are about 100 metres (328 feet) thick and overlie deeper volcanic deposits. Significantly, the mapping of the dielectric constant showed that the sedimentary deposits left over from the putative ocean differ from volcanic rock – they have a value of about 4-5, while volcanic deposits have a value of 9, 10 or even higher. Pure ice has a value of 3.1.

According to the research team, “Although much is still unknown about the evolution and environmental context of a Late Hesperian ocean, our observations provide persuasive evidence of its existence by the measurement of a dielectric constant of the Vastitas Borealis Formation that is sufficiently low that it can only be explained by the widespread deposition of (now desiccated) aqueous sediments or sediments mixed with massive ice.”

The big question has always been, if there was an ocean, where did all the water go? Additional radar mapping from Mars Express has shown that there are massive amounts of water ice buried beneath the surface, notably at the poles as well as within the speculative shorelines of the old ocean and even closer to the equator than was previously thought. It might seem reasonable to conclude then that much of the water from the ocean, and perhaps other seas or lakes as well, is still there, but now frozen solid.

It’s interesting to note also that the Phoenix lander, which landed within the Vastitas Borealis Formation in 2008, found water ice deposits only a few centimetres below the surface.

“As such, the formation represents the best geologic evidence to date for the existence of an ocean in the Late Hesperian, about 3 billion years ago,” the researchers said.

From the abstract:

A number of observations suggest that an extended ocean once covered a significant part of the Martian northern hemisphere. By probing the physical properties of the subsurface to unprecedented depth, the MARSIS/Mars Express provides new geophysical evidences for the former existence of a Late Hesperian ocean. The Vastitas Borealis formation, located inside a putative shoreline of the ancient ocean, has a low dielectric constant compared with that of typical volcanic materials. We show that the measured value is only consistent with low-density sedimentary deposits, massive deposits of ground-ice, or a combination of the two. In contrast, radar observations indicate a distribution of shallow ground ice in equilibrium with the atmosphere in the south polar region. We conclude that the northern plains are filled with remnants of a late Hesperian ocean, fed by water and sediments from the outflow channels about 3 Gy ago.

The full article can be purchased here ($25.00 U.S.).

Asteroid To Make Closest Approach Since 1975

Asteroid 433 Eros, seen by NASA's NEAR spacecraft on Feb. 29, 2000. (NASA/JPL/JHUAPL)

[/caption]

On Tuesday, January 31, asteroid 433 Eros will come closer to Earth than it has in 37 years, traveling across the night sky in the constellations Leo, Sextans and Hydra. At its closest pass of 16.6 million miles (26.7 million km) the relatively bright 21-mile (34-km) -wide asteroid will be visible with even modest backyard telescopes, approaching magnitude 8, possibly even 7. It hasn’t come this close since 1975, and won’t do so again until 2056!

433 Eros is an S-type asteroid, signifying a composition of magnesium silicates and iron. S-types make up about 17 percent of known asteroids and are some of the brightest, with albedos (reflectivity) in the range of 0.10 – 0.22. S-type asteroids are most common in the inner asteroid belt and, as in the case of Eros, can even pass within the orbit of Mars.

Occasionally Eros’ orbit brings it close enough to Earth that it can be spotted with amateur telescopes. 2012 will be one of those times.

Eros was discovered on August 13, 1898, by astronomers Carl Gustav Witt in Berlin and Auguste Charlois in Nice. When Eros’ orbit was calculated it was seen to be an elongated oval that brought it within the orbit of Mars. This allowed for good observations of the bright asteroid, and eventually led to more accurate estimates of the distance from Earth to the Sun.

In February 2000 NASA’s NEAR Shoemaker spacecraft approached Eros, established orbit and made a soft landing on its surface, the first mission ever to do so. While in orbit NEAR took over 160,000 images of Eros’ surface, identifying over 100,000 craters, a million house-sized boulders (give or take a few) and helped researchers conclude that the cashew-shaped Eros is a solid object rather than a “rubble pile” held together by gravity.

View NEAR images of Eros’ surface.

Studying pristine objects like Eros gives insight into the earliest days of our solar system, and also allows scientists to better understand asteroid compositions… which is invaluable information when deciding how best to avoid any potential future impacts.

Orbit of 433 Eros for Jan. 31, 2012

Although Eros will be making a “close” approach to Earth on Jan. 31/Feb. 1, there is no danger of a collision. It will still remain at a very respectable distance of about 16.6 million miles (26.7 million km), or 0.178 AU. This is over 80 times the distance of the much smaller 2005 YU55, which safely passed within a lunar orbit radius on November 8, 2011.

If you do want to try viewing 433 Eros as it passes, you can find a diagram charting its path from Sky and Telescope here. According to the Sydney Observatory’s website “the coordinates on 31 January (from the BAA 2012 Handbook) are 10 hours 33 minutes 19.0 seconds RA and -4° 48’ 23” declination. On 10 February the RA is 10 hours 20 minutes 27.6 seconds and the declination is -14° 38’ 49 seconds.”

Also there’s an updated chart on Heavens Above showing Eros’ current position.

Eros should remain visible up until Feb. 10.

Thanks to Skyscrapers, Inc., for a report on 433 Eros by Glenn Chaple. Skyscrapers, Inc. is an amateur astronomy society in Rhode Island that operates the Seagrave Observatory, whose centerpiece is a beautiful 8 1/4″ Alvan Clark telescope built in 1878. I saw Halley’s Comet through that telescope in 1986 and have been hooked on astronomy ever since.

Earth’s “Missing Energy”

Clouds play a vital role in Earth's energy balance, cooling or warming Earth's surface depending on their type. This painting, "Cumulus Congestus," by JPL's Graeme Stephens, principal investigator of NASA's CloudSat mission, depicts cumulus clouds, which transport energy away from Earth's surface. Image credit: Graeme Stephens

[/caption]

Like many of us, Earth works on a budget – an energy budget. However, this energy isn’t the type that powers our automobiles or electric lights. It’s the energy that empowers our living planet. When it comes to input and output, the Earth is a huge throughput system. The most massive source of incoming energy is solar radiation, with geothermal and tidal energy completing the circle. All of these forms of energy are converted to heat and re-radiated into space. In 2010, scientists at the National Center for Atmospheric Research in Boulder, Colorado publicized a study taken from satellite observations which stated there were certain variances between Earth’s heat and ocean heating. What they found was “missing energy” in our planet’s system. Why did this energy seem to be disappearing? The research group began wondering if perhaps there was a problem with the method of recording energy as absorbed from the Sun and its emission back to space.

This was a question that needed an answer. Enter an international team of atmospheric scientists and oceanographers, led by Norman Loeb of NASA’s Langley Research Center in Hampton, Virginia, and including Graeme Stephens of NASA’s Jet Propulsion Laboratory in Pasadena, California. It was their mission to account for the missing energy. Armed with 10 years of data from NASA Langley’s orbiting Clouds and the Earth’s Radiant Energy System Experiment (CERES) instruments, the team set out to record the radiation balance located at the apex of Earth’s atmosphere and how it changed with time. Supplied with the CERES data, they then combined it with estimates of oceanic heat content as recorded by three separate sensors. Their findings showed that both satellite and physical measurements of the ocean’s energy agreed with one another once observational uncertainties were added to the equation. Their work was summarized in a NASA-led study published January 22 in the journal Nature Geosciences,

“One of the things we wanted to do was a more rigorous analysis of the uncertainties. When we did that, we found the conclusion of missing energy in the system isn’t really supported by the data.” said Loeb. “Our data shows that Earth has been accumulating heat in the ocean at a rate of half a watt per square meter (10.8 square feet), with no sign of a decline. This extra energy will eventually find its way back into the atmosphere and increase temperatures on Earth.”

For the most part, scientists concur that around 90% of extra heat created by the greenhouse gas effect is being stored in Earth’s oceans. If it follows the laws of thermodynamics and is released back into the atmosphere, “a half-watt per square meter accumulation of heat could increase global temperatures by 0.3 or more degrees centigrade or 0.54 degree Fahrenheit”. As Loeb explained, these observations show the need to employ several different measuring systems over time and the findings underline the imperative need to continually update how Earth’s energy flows are recorded.

The newly published work came from the science team at the National Center for Atmospheric Research and other authors of the paper are from the University of Hawaii, the Pacific Marine Environmental Laboratory in Seattle, the University of Reading United Kingdom and the University of Miami. Their study mapped inconsistencies between satellite information on Earth’s heat balance between the years of 2004 and 2009 and included information on the rate of oceanic heating taken from the upper 700 meters of the surface. They said the inconsistencies were evidence of “missing energy.”

Original Story Source: JPL News Release.

NASA’s New Eyes in the Sky

An artist's concept of NuSTAR in space. Image credit: NASA/JPL-Caltech/Orbital

[/caption]

On March 14, NASA will launch the Nuclear Spectroscopic Telescope Array or NuSTAR. This is the first time a telescope will focus on high energy X-rays, effectively opening up the sky for more sensitive study. The telescope will target black holes, supernova explosions, and will study the most extreme active galaxies. NuSTAR’s use of high-energy X-rays have an added bonus: it will be able to capture and compose the most detailed images ever taken in this end of the electromagnetic spectrum. 

NuSTAR’s eyes are two Wolter-I optic units; once in orbit each will ‘look’ at the same patch of sky. The Wolter-I mirror works by reflecting an X-ray twice, once off of an upper mirror shaped like a parabola and again off a lower mirror shaped like a hyperbola. The mirrors are nearly parallel to the direction of the incoming X-ray, reflecting most of the X-ray instead of absorbing it, but the slight angle allows for a very small collection area per surface. To get a full picture, mirrors of varying size are nested together.

Technicians work on NuSTAR this month at the Orbital Science Corporation in Dulles, Virginia. Image credit: NASA/JPL-Caltech/Orbital

Each of NuSTAR’s eyes, each unit, are made of 133 concentric shells of mirrors shaped from flexible glass like that found in laptop computer screens. This is an improvement over past missions like Chandra and XMM-Newton that both used high density materials such as Platinum, Iridium and Gold as mirror coatings. These materials achieve great reflectivity for low energy X-rays but can’t capture high energy X-rays.

Like human eyes, NuSTAR’s optical units are co-aligned to give the telescope a wider field of view and enable the capture of more sensitive images. These images will be made into detailed composites by scientists on the ground.

Also like human eyes, NuSTAR’s optical units need to be distanced from one another since X-ray telescopes require long focal lengths. In other words, the optics must be separated by several meters from the detectors. NuSTAR does this with a 33 foot (10 metre) long mast or boom between units.

Previous X-ray missions have accommodated these long focal lengths by launching fully deployed observatories on large rockets. NuSTAR won’t. It has a unique deployable mast that will extend once the payload is in orbit. This allows for a launch on the small Pegasus rocket. Undeployed, the telescope measures just 2 metres in length and one metre in diameter.

During its two-year primary mission, NuSTAR will map the celestial sky focussing on black holes, supernova remnants, and particle jets traveling near the speed of light. It will also look at the Sun. Observations of microflares could explain the temperature of the Sun’s corona. It will also search the Sun for evidence of a hypothesized dark matter particle to test a theory about dark matter.

NuSTAR's mast. Image credit: NASA/JPL-Caltech/Orbital

“NuSTAR will provide an unprecedented capability to discover and study some of the most exotic objects in the universe, from the corpses of exploded stars in the Milky Way to supermassive black holes residing in the hearts of distant galaxies,” said Lou Kaluzienski, NuSTAR program scientist at NASA Headquarters in Washington.

The telescope shipped from the Orbital Sciences Corporation in Dulles, Virginia to Vandenberg Air Force Base in California on January 27. There, it will be mated to its Pegasus launch vehicle on February 17. It will launch from underneath the L-1011 “Stargazer” aircraft on March 14 after taking off near the equator from Kwajalein Atoll in the Pacific.

Source: NASA

A Pegasus rocket launches from underneath a L-1011 "Stargazer" aircraft, just like NuSTAR will do in March. Image credit: NASA/JPL-Caltech/Orbital

Toronto Teens Launch “Lego Man in Space”

Toronto Teens Launch Lego Main In Space to the Stratosphere - Jan 2012. Stunning space imagery was captured by Canadian teenagers Mathew Ho and Asad Muhammad when they lofted a tiny ‘Lego Man in Space’ astronaut to an altitude of 16 miles (25 kilometers) using on a helium filled weather balloon. Credit: Mathew Ho and Asad Muhammad. Watch the YouTube below

[/caption]
Updated:Jan. 30

Two teens from Toronto,Canada have launched “Lego Man in Space” using a helium filled weather balloon and captured stunning video of the miniature toy figure back dropped by the beautiful curvature of Earth and the desolate blackness of space that’s become a worldwide YouTube sensation – over 2 million hits !

17 year olds Mathew Ho and Asad Muhammad lofted the tiny 2 inch tall Lego figure from a local Toronto soccer field up to a height of about 85,000 feet, or 16 miles (25 kilometers), where the 22 foot (7 m) diameter helium balloon burst in what is technically known as the stratosphere. The homemade styrofoam capsule – equipped with two video cameras and two digital cameras (Canon) – then parachuted back to Earth.

“We launched the project on January 7,” Mathew Ho told Universe Today.

“Altogether, we used 4 cameras, two cameras taking stills, and two taking video – Canon, Sony, GoPro – in the 1 cubic foot capsule,” Ho explained.

“After endless hours of hard work, we managed to capture stunning views of our atmosphere and put a ‘Lego’ man into near space!” said the ambitious teens who are 12th graders at the Agincourt Collegiate Institute.

The pair posted a YouTube video (below) documenting the entire voyage and some camera snapshots on their website on January 25.

Lego Man even snapped cool Moon shots – look closely at the video and photo below.

“Lego Man in Space” – The Video

The duo recounted the details of their sensational space tale of science on a shoestring for Canadian TV and newspapers.

“Upon launch we were very relieved. But we had a lot of anxiety on launch day because there were high winds when we were going up after all the hard work,” said Ho in a studio interview on Canadian TV (CTV).

“We were also scared because now we would have to retrieve it back after it came down,” Asad chimed in.

“We had no idea it would capture photos like that and would be so good,” said Ho. “We were blown away when we saw them back home.”

The toy Lego astronaut is seen standing atop a thin runway protruding precariously from one end of the small, box shaped capsule as though he was walking the plank and about to plunge into the ocean of space. All the while, cameras were aimed directly out towards him recording the entire rollicking journey from liftoff to the stratosphere to landing, with a constantly changing Earth in the background.

Altogether they netted two videos and 1500 photos.

Lego Man in Space shoots the Moon !
Credit: Mathew Ho and Asad Muhammad

Coincidentally, several Lego toys are constantly flying even higher above the Earth at this very moment aboard the International Space Station as part of an educational outreach effort by NASA and Lego. And 3 more Lego figurines are speeding to Jupiter aboard NASA’s Juno orbiter.

Legoman’s spectacular journey lasted some 97 minutes. He’s beaming proudly throughout the video while holding the Canadian National flag – the Red Maple Leaf. The rollercoaster-like scenery may well challenge the stomachs of those with fear of heights.

The tumbling Lego Man in Space capsule upon the violent descent captured the moment before the parachute was activated. Credit: Mathew Ho and Asad Muhammad

Mathew and Asad worked over about four months one day a week on Saturdays to assemble the rig in Mathew’s kitchen and successfully accomplished the feat on a shoestring budget of merely 400 dollars. They used GPS trackers to locate “Lego Man in Space” and recover the intact capsule holding the imagery.

After the balloon burst at 85,000 feet, the parachute assisted descent back to Earth took about 32 minutes. Winds aloft caused the capsule to drift some 76 miles (122 kilometers) away from the launch site before landing at Rice Lake in one piece.

Lego Man in Space capsule after landing 76 miles (122 kilometers) away from the Toronto soccor field launch site. Credit: Mathew Ho and Asad Muhammad

“We were jumping for joy when we saw the capsule and the parachute. We were ecstatic when we found it,” said Ho.

“We have a long history of passionate building and working together,” Ho told CTV.

The project began after they saw that MIT students had sent a camera to the edge of space with a balloon and captured stunning views.

“We were inspired by videos and pictures we had seen online two years ago and we began working on this in the Fall of 2011. In total the project cost about $400 Canadian,” Ho told me.

“We hope to publish more pictures and video to our Facebook page and website soon,” Ho added.

And now we know another truth about Lego’s – Not only can they withstand the destructive forces of kids, but outer space too !

Journal Club – Transit of Venus

Today's Journal Club is about a new addition to the Standard Model of fundamental particles.

[/caption]

According to Wikipedia, a journal club is a group of individuals who meet regularly to critically evaluate recent articles in scientific literature. Being Universe Today if we occasionally stray into critically evaluating each other’s critical evaluations, that’s OK too. And of course, the first rule of Journal Club is… don’t talk about Journal Club.

So, without further ado – today’s journal article under the microscope is about the 2012 transit of Venus.

Today’s article:
Sigismondi Solar diameter with 2012 Venus transit.

The 2012 transit of Venus will proceed for nearly 7 hours over 5 and 6 June (UTC). It’s not likely that we are going to squeeze a huge amount of ground-breaking science out of this event, which was closely monitored by 21st century technology the last time it happened in 2004. But Sigismondi argues that a more exacting observation of this transit should enable us to clean up some of the historical data from previous transits by kind of reverse-engineering some of the inherent inaccuracies that plagued earlier measurements.

The point of such an exercise may become clear by considering a claim made back in 1979 that the Sun was shrinking – based on an analysis of 120 years of Greenwich Observatory solar measurement data. Apparently this finding has since been hijacked to support a young Earth hypothesis – as in if the Sun is shrinking so fast, then how can it possibly be billions or even millions of years old and yada, yada.

Shapiro was able to quickly counter the shrinking data finding in a 1980 publication (in Science), demonstrating that transits of Mercury data, going back to 1736, indicated that the solar diameter had remained constant to within 0.3 arcseconds. This was then followed up by Parkinson et al, also in a 1980 publication (in Nature), demonstrating that changes in the Greenwich solar data correlated closely with changes in instrumentation, atmospheric conditions and in the people taking the measurements (and thanks to Matt Tiscareno for this story).

Anyhow, Sigismondi outlines how the solar diameter can be measured from the transit of Venus’ outline when it contacts each edge of the Sun – and then discusses a method whereby the ‘notorious’ black drop effect can be eliminated. The black drop effect involves the black shape of Venus seemingly to elongate as it approaches the edge of the Sun – which had confounded all measurements taken prior to 2004.

Transits of Venus generally happen in pairs separated by 8 years, with either 105.5 or 121.5 years separating the last of the pair and the first of the next. Apparently Kepler was the first person to predict a transit of Venus in 1631 – but he failed to predict that it would not be visible from Europe. So it fell to Jeremiah Horrocks and William Crabtree to make the first scientific observation of a transit 8 years later in December 1639. The next two were in June 1761 and June 1769, the latter famously observed from Tahiti by Lieutenant James T Cook (OK, kidding about the T) and then there were two more in December 1874 and December 1882.

Then another 121.5 years passed until June 2004 – now to be followed by this year’s June 2012 transit, being the 7th ever scientifically recorded transit. And BTW here’s an original drawing by James Cook of the June 1769 transit, showing the black drop effect.

So… comments? Is it OK to get a little bit excited about ‘just another’ transit of Venus – since it’s only the 7th we have ever recorded data about? Did you know that the plural of ephemeris (the position of something in the sky) is ephemerides? Want to suggest an article for the next edition of Journal Club?

“Bad Boy” Sunspot Unleashes Powerful X-Class Flare

The active region on the Sun that created all the hubbub and aurorae earlier this week put out one last shot before that area of the Sun turns away from Earth’s view. And that shot was a biggie. At 18:37 UT (1:37 pm EST) today (January 27, 2012) sunspot 1402 unleashed an X-class flare, the largest and most powerful category of flares. This flare was measured as an X2, which is at the low end of the highest powered flares, but still, this is the most powerful flare so far this year. It was not directed at Earth, but scientists from the Solar Dynamics Observatory say the energetic protons accelerated by the blast are now surrounding our planet and a S1-class radiation storm is in progress. S1-class is the lowest of 5 (S1 to S5) and has no biological impact, no satellite operations are impacted but some minor impact on HF radio could be experienced.

With all the activity from the Sun, you might need a refresher course in solar flares. Here’s a guide from SDO, and what all the different classifications are:
Continue reading ““Bad Boy” Sunspot Unleashes Powerful X-Class Flare”

Emerging Supermassive Black Holes Choke Star Formation

The LABOCA camera on the ESO-operated 12-metre Atacama Pathfinder Experiment (APEX) telescope reveals distant galaxies undergoing the most intense type of star formation activity known, called a starburst. This image shows these distant galaxies, found in a region of sky known as the Extended Chandra Deep Field South, in the constellation of Fornax (The Furnace). The galaxies seen by LABOCA are shown in red, overlaid on an infrared view of the region as seen by the IRAC camera on the Spitzer Space Telescope. Credit: ESO, APEX (MPIfR/ESO/OSO), A. Weiss et al., NASA Spitzer Science Center

[/caption]

Located on the Chajnantor plateau in the foothills of the Chilean Andes, ESO’s APEX telescope has been busy looking into deep, deep space. Recently a group of astronomers released their findings regarding massive galaxies in connection with extreme times of star formation in the early Universe. What they found was a sharp cut-off point in stellar creation, leaving “massive – but passive – galaxies” filled with mature stars. What could cause such a scenario? Try the materialization of a supermassive black hole…

By integrating data taken with the LABOCA camera on the ESO-operated 12-metre Atacama Pathfinder Experiment (APEX) telescope with measurements made with ESO’s Very Large Telescope, NASA’s Spitzer Space Telescope and other facilities, astronomers were able to observe the relationship of bright, distant galaxies where they form into clusters. They found that the density of the population plays a major role – the tighter the grouping, the more massive the dark matter halo. These findings are the considered the most accurate made so far for this galaxy type.

Located about 10 billion light years away, these submillimetre galaxies were once home to starburst events – a time of intense formation. By obtaining estimations of dark matter halos and combining that information with computer modeling, scientists are able to hypothesize how the halos expanding with time. Eventually these once active galaxies settled down to form giant ellipticals – the most massive type known.

“This is the first time that we’ve been able to show this clear link between the most energetic starbursting galaxies in the early Universe, and the most massive galaxies in the present day,” says team leader Ryan Hickox of Dartmouth College, USA and Durham University, UK.

However, that’s not all the new observations have uncovered. Right now there’s speculation the starburst activity may have only lasted around 100 million years. While this is a very short period of cosmological time, this massive galactic function was once capable of producing double the amount of stars. Why it should end so suddenly is a puzzle that astronomers are eager to understand.

“We know that massive elliptical galaxies stopped producing stars rather suddenly a long time ago, and are now passive. And scientists are wondering what could possibly be powerful enough to shut down an entire galaxy’s starburst,” says team member Julie Wardlow of the University of California at Irvine, USA and Durham University, UK.

Right now the team’s findings are offering up a new solution. Perhaps at one point in cosmic history, starburst galaxies may have clustered together similar to quasars… locating themselves in the same dark matter halos. As one of the most kinetic forces in our Universe, quasars release intense radiation which is reasoned to be fostered by central black holes. This new evidence suggests intense starburst activity also empowers the quasar by supplying copious amounts of material to the black hole. In response, the quasar then releases a surge of energy which could eradicate the galaxy’s leftover gases. Without this elemental fuel, stars can no longer form and the galaxy growth comes to a halt.

“In short, the galaxies’ glory days of intense star formation also doom them by feeding the giant black hole at their centre, which then rapidly blows away or destroys the star-forming clouds,” explains team member David Alexander from Durham University, UK.

Original Story Source: European Southern Observatory News. For Further Reading: Research Paper Link.

Large Amounts of Water Ice Found Underground on Mars

Global map of Water ice on Mars
New estimates of water ice on Mars suggest there may be large reservoirs of underground ice at non-polar latitudes. The map here shows "water-equivalent hydrogen". Oranges and reds on the map (values greater than 4.5 weight % water-equivalent hydrogen at the surface) point out areas where the amount of deeply buried water ice is greater than what can fit in the pore spaces of the surface rocks. Image credit: Feldman et al., 2011

[/caption]

Many models predict that water ice shouldn’t be stable on Mars today, anywhere beyond the poles, no matter how deep you bury it. And yet, a recently published study shows that large regions outside the polar areas may, in fact, contain a relative abundance of water. This is exciting, not only because water has implications for the possibility of life on Mars, but also because it can provide a valuable resource to future explorers, both as a fuel and for life support. And if this water is near the equator, that makes it much easier to get to.

Over the past 7 years, lots of spacecraft observations have given us evidence for the presence of water on Mars, either at the surface or not far below. Radar data have shown that large amounts of water ice are stored at the poles (Lots of Pure Water Ice at Mars North Pole). And pictures of gullies have hinted at reserves of water beneath the surface (NASA Says Liquid Water Made Martian Gullies). Now, a team of scientists, led by Dr. William Feldman of the Planetary Science Institute in Tucson, Arizona, have taken a new look at some of that data.

Dr. Feldman and his team used data from the Mars Odyssey Neutron Spectrometer (MONS) to estimate the amount of water ice that is present outside of the polar regions of Mars, where water ice is not expected to be found. The MONS is an instrument that counts Martian neutrons from orbit. These “neutron counts” are sensitive to the presence of hydrogen and how deep it is below the surface. Using models that take the characteristics of the Martian surface and the relationship of hydrogen to water into account, the MONS data can be used to predict the amount and depth of water and water ice in the surface. Doing just that, Dr. Feldman’s team produced a nearly global map of potential underground ice deposits.

Global map of Water ice on Mars
New estimates of water ice on Mars suggest there may be large reservoirs of underground ice at non-polar latitudes. The map here shows "water-equivalent hydrogen". Oranges and reds on the map (values greater than 4.5 weight % water-equivalent hydrogen at the surface) point out areas where the amount of deeply buried water ice is greater than what can fit in the pore spaces of the surface rocks.
Image credit: Feldman et al., 2011.

This map shows the “weight percent of water-equivalent hydrogen”, or how much of the rock’s weight comes from hydrogen that is bound up in water molecules. Since hydrogen atoms are much lighter than the other atoms that make up a rock, a small weight percent of hydrogen equals a much larger volume of water ice. In fact, Dr. Feldman’s team estimate that values of 4.5 weight % hydrogen or greater (oranges and reds on the map), mean the volume of water ice at depth is larger than what can fit into pore spaces (the spaces between the grains that make up a rock). This means that you no longer have ice in a rock; now you have rocks in ice!

Four regions containing such bulk ice stand out in the map: Promethei Terra in the lower right of the map, Arabia Terra in the upper centre, Arcadia Planitia in the upper left, and Elysium Planetia spanning from the centre right, across the Martian “date line” (180 degrees longitude), to the centre left of the map. The ice deposits here are “buried less than about 1 m below the surface,” writes Dr. Feldman. He does admit that their findings may also indicate the presence of large quantities of minerals that contain water molecules in their chemical make-up. However, their results are supported by other evidence. In the Elysium Planetia region, evidence of glacial features has been seen in high resolution stereo data from ESA’s Mars Express orbiter ( Mars Express Reveals Possible Martian Glaciers). And in the Arcadia Planitia region, buried water ice has been identified in CRISM data, where an almost pure ice layer was excavated from less than 1 meter below the surface by four recent impact events.

Ice ejecta around Martian crater
Almost pure water ice is seen in the ejecta surrounding this impact crater (8 meters in diameter), which formed in 2008. The only reason we can see ice at the surface here is because this crater is so young. As time passes, the ice will all sublimate away.
Image Credit: High Resolution Imaging Science Experiment camera, NASA/JPL-Caltech/University of Arizona.

So, if ice is unstable at today’s conditions on Mars, how can Dr. Feldman and his team account for the presence of that much ice so close to the surface? Well, the bulk ice could have been deposited some 10-20 million years ago, at a time when ice was stable at the surface. If that happened, then the ice sheet could have been preserved under a layer of cemented dust and sediment. This duricrust would have partially shielded the ice from contemporary surface temperatures and atmospheric conditions, slowing the sublimation of the ice just enough so that some of it was left for us to detect today.

Source Link: Feldman et al., 2011, JGR 116, E11009