NASA Provides Live All-Sky Video Feed for Quadrantid Meteor Shower

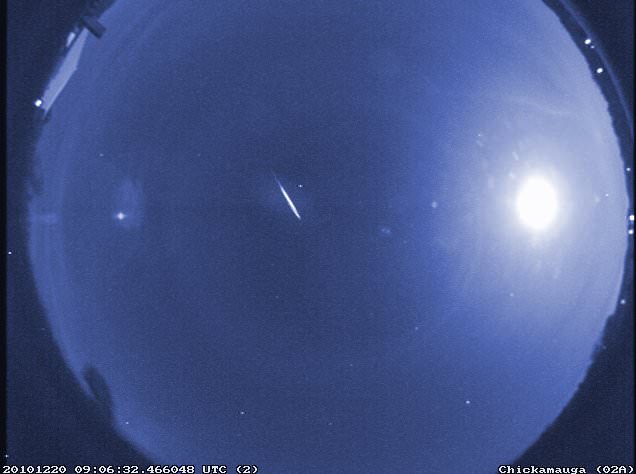
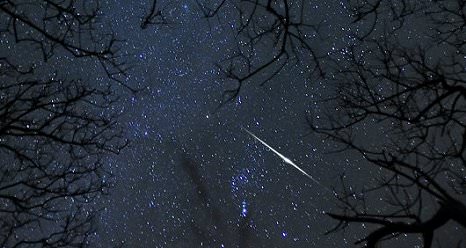
False-color image of a rare early Quadrantid, captured by a NASA meteor camera in 2010. (NASA/MEO/B. Cooke)

[/caption]

If you are hoping to see some meteors from the Quadrantid meteor shower but are being foiled by cloudy weather or if it’s just too cold outside to get up off your couch, NASA has come to the rescue. The Marshall Space Flight Center has set up a live all-sky camera feed of the skies over Huntsville, Alabama in the US. You can find the Ustream page with the feed here. Reports from Marshall say the weather looks very clear for tonight (Jan. 3) in Huntsville. Tonight is really your best shot to see this meteor shower this year.

If you plan to be a little more actively involved in watching this shower, join in on Meteorwatch, where you can share the experience via Twitter.


Of course, you will have to wait until it is dark in Huntsville to watch the video feed; during the daytime, the feed will just show a dark gray box. The camera is light-activated and will turn on at dusk each evening.

This shower will peak in the early morning hours of Jan. 4. The Quadrantids have a maximum rate of about 100 per hour, varying between 60-200. The waxing gibbous Moon will set around 3 a.m. local time, leaving about two hours of excellent meteor observing before dawn.

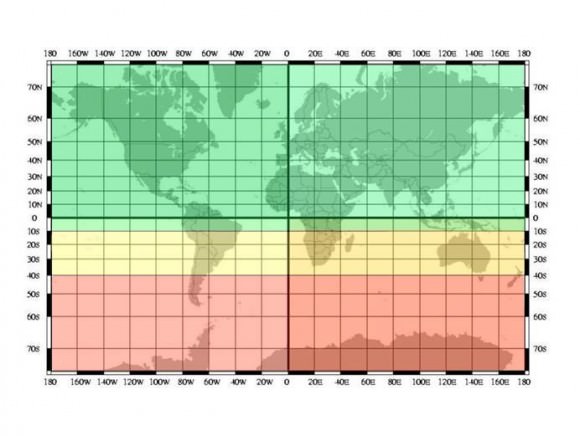
Here’s a map of who should be able to see the Quadrantid meteors:

A map of worldwide Quadrantid visibility. Credit: NASA

Red areas will see no Quads, yellow just a few, and green should see a decent shower if they are in dark sky conditions.

Marshall Space Flight Center suggests that to view tonight’s Quadrantids, you should have an area with dark skies well away from city or street lights. Dress warmly and go out just after Moonset around 3 a.m. local time. Lie flat on your back on a blanket, lawn chair, or sleeping bag and look up, taking in as much of the sky as possible. After about 30 minutes in the dark, your eyes will adapt and you will begin to see meteors. Be patient — the show will last until dawn, so you have plenty of time to catch a meteor.

For more info see the our preview article on the Quadrantid meteor shower, or Marshall Space Flight Center’s Quadrantid info page.

Dusty Plasma From Enceladus Might Affect Saturn’s Magnetosphere

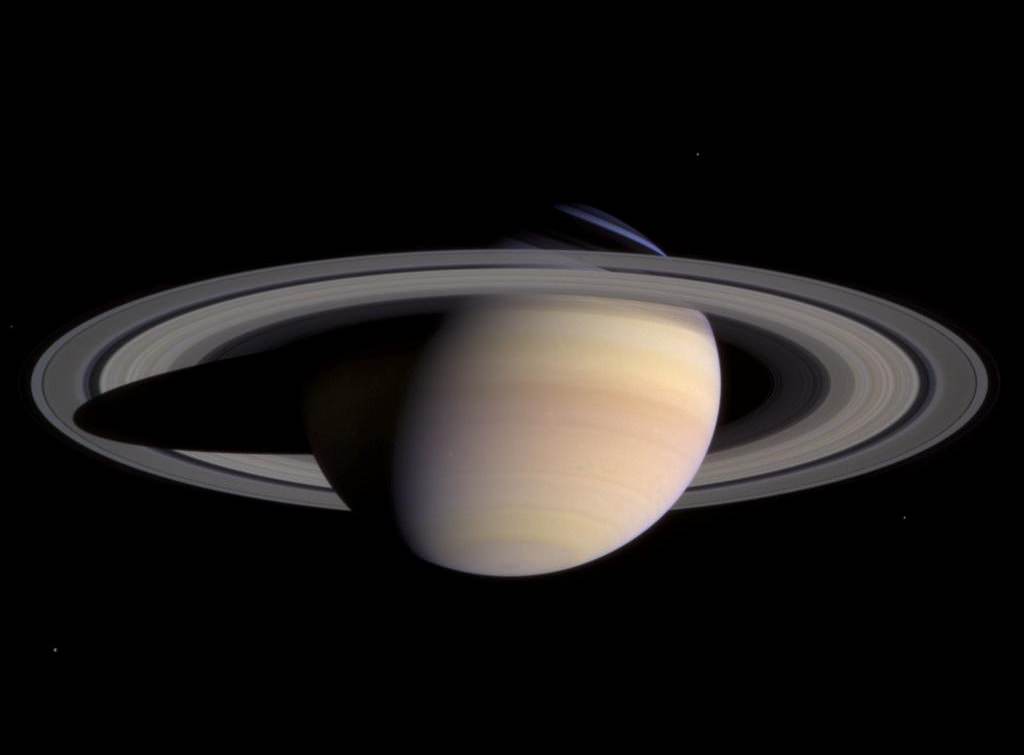
Saturn. NASA/JPL/Caltech

[/caption]

Discovered by the Cassini mission, Saturn Kilometric Radiation (SKR) has been something of an enigma to astronomers. According to the radio and plasma wave instruments, variations occur in sync with the planet’s rotation. However, there are periodic “bursts” of radiation which are in line with Saturn’s magnetosphere. What makes this odd? The rate isn’t quite the same.

Thanks to investigations of Enceladus by Cassini in 2008, new information about the plasma environment surrounding Saturn’s satellite could show a marked impact on the magnetosphere. This image and video show a changing pattern of radio waves from Saturn known as Saturn Kilometric Radiation, as detected by NASA’s Cassini spacecraft. The colors indicate the emitted power of the radio waves, with red as the strongest.

How is it being affected? Thanks to Enceladus’ “spraying” nature, the huge plume of water vapor and ice from its southern pole provides a hefty source of plasma to feed Saturn’s magnetosphere and E-Ring. These negatively charged particles are again impacting the motion of the localized plasma.

“These signatures result from half or more of the electrons being attached to dust grains and by the interaction between the surrounding cold plasma and the predominantly negatively charged submicrometer-sized dust grains.” says M. W. Morooka (et al). “The dust and plasma properties estimated from the observations clearly show that the dust-plasma interaction is collective.”

According to the AGU Journal, this dust-plasma interaction impacts the dynamics of Saturn’s magnetosphere, possibly influencing the rate of SKR emissions.

Original Story Source: American Geophysical Union.

A Balanced Budget on Titan

Titan and Dione seen on December 10, 2011 by the Cassini spacecraft. (NASA/JPL/SSI/J. Major)

[/caption]

It’s been said many times that the most Earthlike world in our solar system is not a planet at all, but rather Saturn’s moon Titan. At first it may not seem obvious why; being only a bit larger than the planet Mercury and coated in a thick opaque atmosphere containing methane and hydrocarbons, Titan sure doesn’t look like our home planet. But once it’s realized that this is the only moon known to even have a substantial atmosphere, and that atmosphere creates a hydrologic cycle on its surface that mimics Earth’s – complete with weather, rain, and gully-carving streams that feed liquid methane into enormous lakes – the similarities become more evident. Which, of course, is precisely why Titan continues to hold such fascination for scientists.

Now, researchers have identified yet another similarity between Saturn’s hazy moon and our own planet: Titan’s energy budget is in equilibrium, making it much more like Earth than the gas giant it orbits.

A team of researchers led by Liming Li of the Department of Earth and Atmospheric Sciences at the University of Houston in Texas has completed the first-ever investigation of the energy balance of Titan, using data acquired by telescopes and the Cassini spacecraft from 2004 to 2010.

Energy balance (or “budget”) refers to the radiation a planet or moon receives from the Sun versus what it puts out. Saturn, Jupiter and Neptune emit more energy than they receive, which indicates an internal energy source. Earth radiates about the same amount as it receives, so it is said to be in equilibrium… similar to what is now shown to be the case for Titan.

Blue hazes hover high above thicker orange clouds over Titan's south pole (NASA/JPL/SSI)

The energy absorption and reflection rates of a planet’s – or moon’s! – atmosphere are important clues to the state of its climate and weather. Different balances of energy or changes in those balances can indicate climate change – global cooling or global warming, for instance.

Of course, this doesn’t mean Titan is a balmy world. At nearly 300 degrees below zero (F) it has an environment that even the most extreme Earth-based life would find inhospitable. Although Titan’s atmosphere is ten times thicker than Earth’s its composition is very different, permitting easy passage of infrared radiation (a.k.a. “heat”) and thus exhibits an “anti-greenhouse” effect, unlike Earth or, on the opposite end of the scale, Venus.

Still, some stable process is in place on Saturn’s moon that allows for distribution of solar energy across its surface, within its atmosphere and back out into space. With results due in from Cassini from a flyby on Jan. 2, perhaps there will soon be even more clues as to what that may be.

Read more about Earth’s changing energy budget here.

The team’s report was published in the AGU’s Geophysical Research Letters on December 15, 2011. Li, L., et al. (2011), The global energy balance of Titan, Geophys. Res. Lett., 38, L23201, doi:10.1029/2011GL050053.

Two new Moons join the Moon – GRAIL Twins Achieve New Year’s Orbits

[/caption]

Take a good close look at the Moon today and consider this; Two new Moon’s just reached orbit.

NASA is ringing in the New Year with a double dose of champagne toasts celebrating the back to back triumphal insertions of a pair of tiny probes into tandem lunar orbits this weekend that seek to unravel the hidden mysteries lurking deep inside the Moon and figure out how the inner solar system formed eons ago.

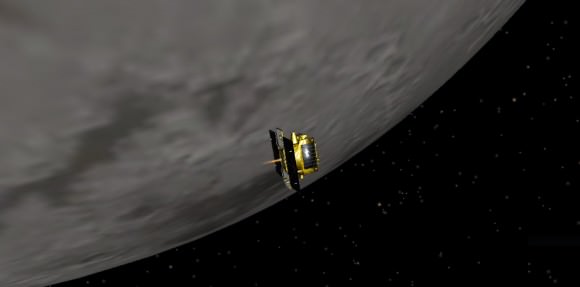
Following closely on the heels of her twin sister, NASA’s GRAIL-B spacecraft ignited her main braking rockets precisely as planned on New Year’s Day (Jan.1) to go into a formation flying orbit around the Moon, chasing behind GRAIL-A which arrived on New Year’s Eve (Dec. 31).

“Now we have them both in orbit. What a great feeling!!!!” NASA manager Jim Green told Universe Today just minutes after the thruster firing was done. Green is NASA’s Director of Planetary Science and witnessed the events inside Mission Control at the Jet Propulsion Laboratory (JPL) in Pasadena, Ca.

“It’s the best New Year’s ever!!” Green gushed with glee.

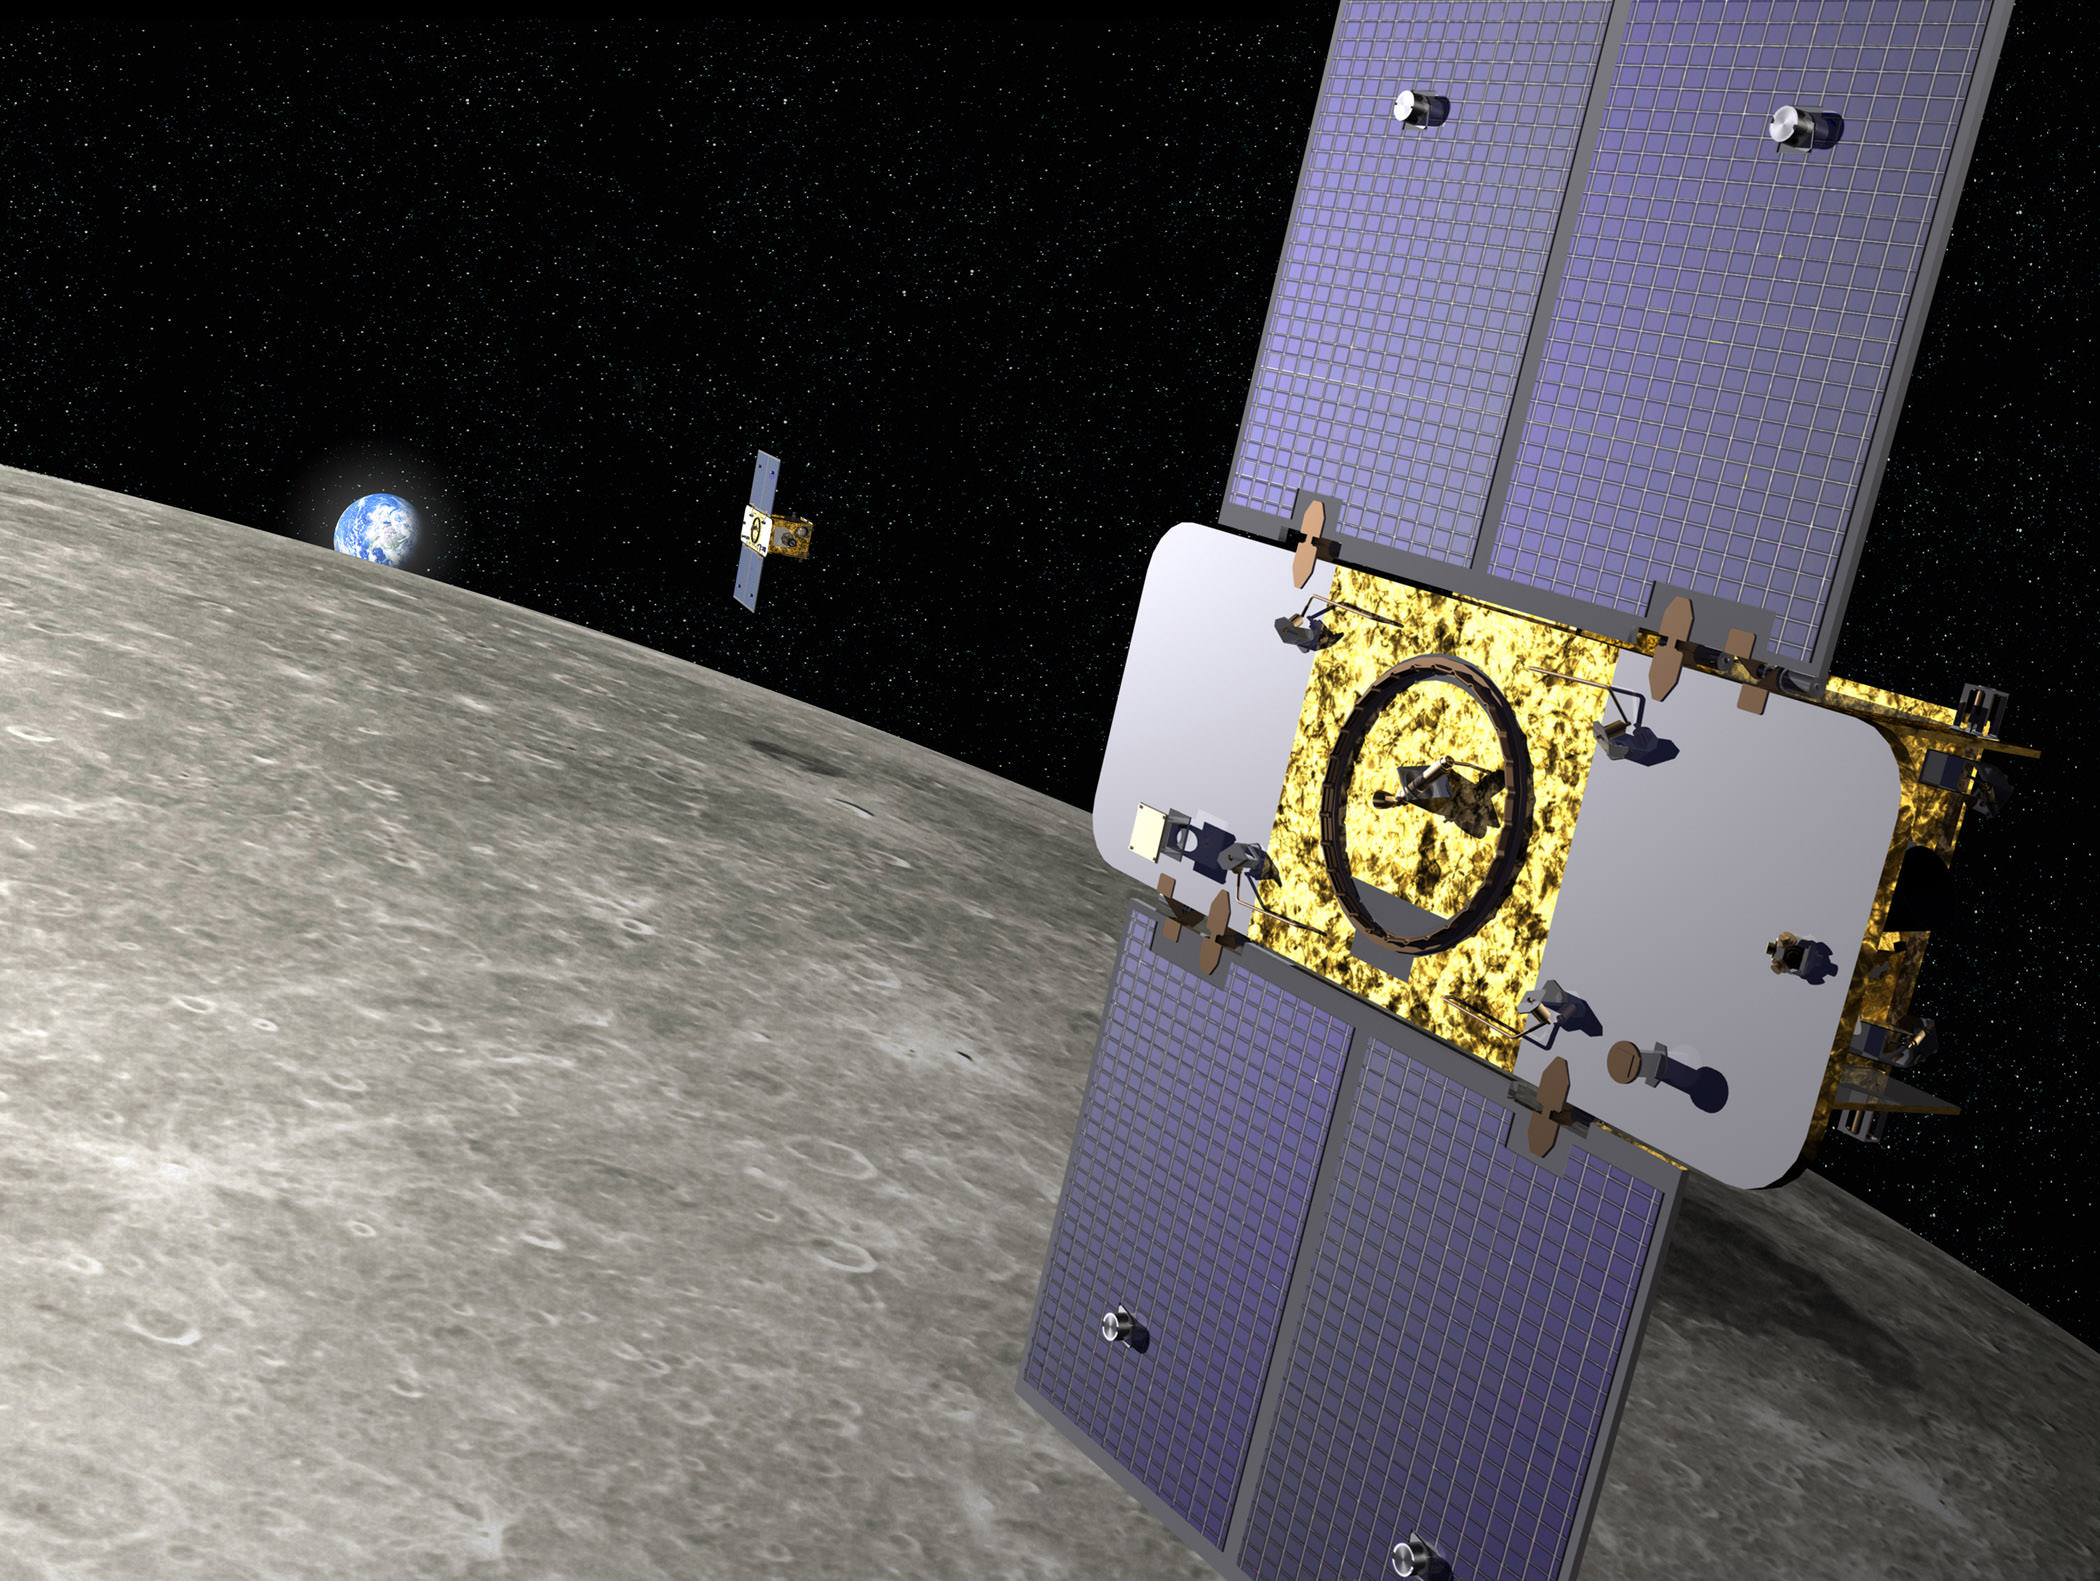
GRAIL-B spacecraft entered Lunar Orbit on New Year’s Day 2012. Artist concept of GRAIL-B performing its lunar orbit insertion burn. Credit: NASA/JPL-Caltech

The new lunar arrivals of GRAIL-A and GRAIL-B capped a perfect year for NASA’s Planetary Science research in 2011.

“2011 began the Year of the Solar System – which is a Mars year (~670 Earth days long)… and includes Grail B insertion, Dawn leaving Vesta this summer … And the landing of MSL! ,” Green said.

NASA’s GRAIL-A & GRAIL-B are orbiting the Moon in this image taken on Jan. 2, 2012 after Lunar Orbit Insertions on New Year’s Weekend. Click to enlarge.
Credit: Ken Kremer

“Cheers in JPL mission control as everything is looking good for GRAIL-B. It’s going to be a great 2012!!” JPL tweeted shortly after confirming the burn successfully placed GRAIL-B into the desired elliptical orbit.

After years of hard work, GRAIL principal investigator Maria Zuber of MIT told Universe Today that she was very “relieved”, soon after hearing the good news at JPL Mission Control.

“Since GRAIL was originally selected I’ve believed this day would come,” Zuber told me shortly after the GRAIL-B engine firing was declared a success on New Year’s Day.

“But it’s difficult to convey just how relieved I am right now. Time for the Science Team to start their engines !”

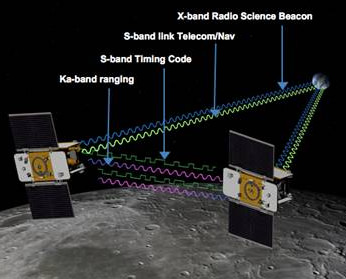
Artist's concept depicts how the science instrument on the mirror image twin GRAIL spacecraft will send signals to each other to map the Moon's gravity and then transmit the data to Earth. Credit: NASA

At 2:43 p.m. PST (5:43 p.m. EST) on New Year’s Day, the main thruster aboard GRAIL-B automatically commenced firing to slow down the spacecraft’s approach speed by about 430 MPH (691 kph) and allow it to be captured into orbit by the Moon’s gravity. The preprogrammed maneuver lasted about 39 minutes and was nearly identical to the GRAIL-A firing 25 hours earlier.

The hydrazine fueled main thrusters placed the dynamic spacecraft duo into near-polar, highly elliptical orbits.

Over the next two months, engineers will trim the orbits of both spacecraft to a near-polar, near-circular formation flying orientation. Their altitudes will be lowered to about 34 miles (55 kilometers) and the orbital periods trimmed from their initial 11.5 hour duration to about two hours.

The science phase begins in March 2012. For 82 days, the mirror image GRAIL-A and GRAIL-B probes will be flying in tandem with an average separation of about 200 kilometers as the Moon rotates beneath.

“GRAIL is a Journey to the Center of the Moon,” Zuber explained at a media briefing. “It will use exceedingly precise measurements of gravity to reveal what the inside of the Moon is like.”


As one satellite follows the other, in the same orbit, they will perform high precision range-rate measurements to precisely measure the changing distance between each other to within 1 micron, the width of a red blood cell, using a Ka-band instrument.

When the first satellite goes over a higher mass concentration, or higher gravity, it will speed up slightly. And that will increase the distance. Then as the second satellite goes over, that distance will close again.

The data returned will be translated into gravitational field maps of the Moon that will help unravel information about the makeup of the Moon’s mysterious core and interior composition. GRAIL will gather three complete gravity maps over the three month mission.

“There have been many missions that have gone to the Moon, orbited the Moon, landed on the Moon, brought back samples of the Moon,” said Zuber. “But the missing piece of the puzzle in trying to understand the Moon is what the deep interior is like.”

“Is there a core? How did the core form? How did the interior convect? What are the impact basins on the near-side flooded with magma and give us this Man-in-the-Moon shape whereas the back side of the Moon doesn’t have any of this? These are all mysteries that despite the fact we’ve studied the Moon before, we don’t understand how that has happened. GRAIL is a mission that is going to tell us that.”

“We think the answer is locked in the interior,” Zuber elaborated.

How will the twins be oriented in orbit to gather the data ?

“The probes will be pointed at one another to make the highly precise measurements,” said GRAIL co-investigator Sami Asmar of JPL to Universe Today. “The concept has heritage from the US/German GRACE earth orbiting satellites which mapped Earth’s gravity field. GRACE required the use of GPS satellites for exactly knowing the position, but there is no GPS at the Moon. So GRAIL was altered to compensate for no GPS at the Moon.”

GRAIL will map the gravity field by 100 to 1000 times better than ever before.

“We will learn more about the interior of the Moon with GRAIL than all previous lunar missions combined,” says Ed Weiler, the recently retired NASA Associate Administrator of the Science Mission Directorate in Washington, DC.

The GRAIL twins blasted off from Florida mounted side by side atop a Delta II booster on September 10, 2011 and took a circuitous 3.5 month low energy path to the Moon to minimize the overall costs.

So when you next look at the sky tonight and in the coming weeks just imagine those mirror image GRAIL twins circling about seeeking to determine how we all came to be !

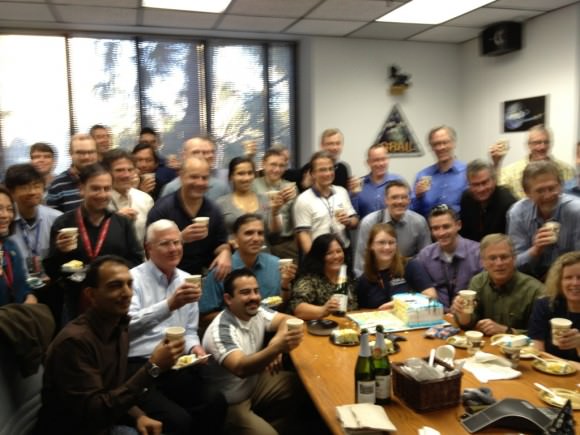
GRAIL Project manager David Lehman cuts the cake for team members at JPL to celebrate 2 for 2 at the Moon. Credit: NASA/Jim Green
GRAIL team at JPL toasts success as twin spacecraft both went into orbit around the Moon on New Year’s weekend.

Read continuing features about GRAIL by Ken Kremer here:
First GRAIL Twin Enters Lunar Orbit – NASA’s New Year’s Gift to Science
2011: Top Stories from the Best Year Ever for NASA Planetary Science!
NASA’s Unprecedented Science Twins are GO to Orbit our Moon on New Year’s Eve
Student Alert: GRAIL Naming Contest – Essay Deadline November 11
GRAIL Lunar Blastoff Gallery
GRAIL Twins Awesome Launch Videos – A Journey to the Center of the Moon
NASA launches Twin Lunar Probes to Unravel Moons Core
GRAIL Unveiled for Lunar Science Trek — Launch Reset to Sept. 10
Last Delta II Rocket to Launch Extraordinary Journey to the Center of the Moon on Sept. 8
NASAs Lunar Mapping Duo Encapsulated and Ready for Sept. 8 Liftoff
GRAIL Lunar Twins Mated to Delta Rocket at Launch Pad
GRAIL Twins ready for NASA Science Expedition to the Moon: Photo Gallery

New Year – New Calendar… But Johns Hopkins Scholars Say We Need A Permanent Edition

Hanke-Henry Permanent Calendar - Credit: Richard Conn Henry/Johns Hopkins University

[/caption]

It’s another new year and time to remember to write new dates again. While it might take a few weeks to remember to do it right first time, Johns Hopkins Scholars say our traditional calendar needs a major overhaul. By utilizing computer programs and mathematical formulas, Richard Conn Henry, an astrophysicist in the Krieger School of Arts and Sciences, and Steve H. Hanke, an applied economist in the Whiting School of Engineering, have devised a new calendar where each year is identical to the year before it… and the year after.

Dubbed the Hanke-Henry Permanent Calendar, there would be no problem remembering dates. For example, if your birthday was Thursday, May 10, it would remain Thursday, May 10 throughout eternity. Can you fathom holidays always being on the same day of the week? Or a weekend date always remaining the same? All the same… Always.

“Our plan offers a stable calendar that is absolutely identical from year to year and which allows the permanent, rational planning of annual activities, from school to work holidays,” says Henry, who is also director of the Maryland Space Grant Consortium. “Think about how much time and effort are expended each year in redesigning the calendar of every single organization in the world and it becomes obvious that our calendar would make life much simpler and would have noteworthy benefits.”

Of course, it would seem rational to have certain dated functions, such as work holidays, religious holidays and even birthdays fall on the same date each year. However, according to Hanke, an expert in international economics, the monetary benefits would be the real motivation behind such a change… ones that should motivate the consumer.

“Our calendar would simplify financial calculations and eliminate what we call the ‘rip off’ factor,” explains Hanke. “Determining how much interest accrues on mortgages, bonds, forward rate agreements, swaps and others, day counts are required. Our current calendar is full of anomalies that have led to the establishment of a wide range of conventions that attempt to simplify interest calculations. Our proposed permanent calendar has a predictable 91-day quarterly pattern of two months of 30 days and a third month of 31 days, which does away with the need for artificial day count conventions.”

But is the Hanke-Henry Permanent Calendar a true progression over various forms of permanent calendars that have been proposed before? “Attempts at reform have failed in the past because all of the major ones have involved breaking the seven-day cycle of the week, which is not acceptable to many people because it violates the Fourth Commandment about keeping the Sabbath Day,” Henry explains. “Our version never breaks that cycle.”

Sure, the current Gregorian calendar has been working for 430 years now. What’s the point in change? It, too, was an alteration to a calendar put forth in 46 BC by Julius Caesar to stay in sync with the changing seasons. The real problem is we humans just have to deal with a celestial calendar in which a true year is 365.2422 days long. The new calendar simply proposes we add an extra week every so often to make up for the fragmented days. But personally, I can’t see where this is any different than the concept we are already working under! If we’re adding an extra week every five or six years at the end of December, is that really any different than the few months that sport an extra day…. or leap year for that matter?

Yeah. Well, they don’t want to stop there, either. They are also in favor of doing away with world time zones by fully adopting GMT. “One time throughout the world, one date throughout the world,” they write, in a January 2012 Global Asia article about their proposals. “Business meetings, sports schedules and school calendars would be identical every year. Today’s cacophony of time zones, daylight savings times and calendar fluctuations, year after year, would be over. The economy – that’s all of us – would receive a permanent ‘harmonization’ dividend.”

Is it really harmony or just another way of putting us in neat, little boxes? Maybe we humans like our confusion. Maybe if it’s not broke, we don’t need to fix it. For those of us who practice astronomy, we already use both GMT and (in some circumstances) a Julian calendar as well. Do we really need to standardize everything? We’ve tried with money and we’ve tried with measurements. What’s next? We should all be born the same sex with exactly the same features so we can standardize the human population, too? Think of all the money that could be saved from the fashion industry alone! Then we’d need to have exactly the same tastes. That would make it ever so much easier to standardize food. No need to be wasting perfectly good dishes because one liked it and one didn’t. Maybe we all need the same sense of humor, that way we could just tell standard jokes. Perhaps we could all find exactly the same set of tones agreeable, so one song would do us all. Of course, it’s just my opinion, but…

Move over, Mr. Roboto.

Original Story Source: John Hopkins University Press Release. For further opinions and reading: Wired Science.

Guest Post: The Cosmic Energy Inventory

The Cosmic Energy Inventory chart by Markus Pössel. Click for larger version.

[/caption]

Now that the old year has drawn to a close, it’s traditional to take stock. And why not think big and take stock of everything there is?

Let’s base our inventory on energy. And as Einstein taught us that energy and mass are equivalent, that means automatically taking stock of all the mass that’s in the universe, as well – including all the different forms of matter we might be interested in.

Of course, since the universe might well be infinite in size, we can’t simply add up all the energy. What we’ll do instead is look at fractions: How much of the energy in the universe is in the form of planets? How much is in the form of stars? How much is plasma, or dark matter, or dark energy?


The chart above is a fairly detailed inventory of our universe. The numbers I’ve used are from the article The Cosmic Energy Inventory by Masataka Fukugita and Jim Peebles, published in 2004 in the Astrophysical Journal (vol. 616, p. 643ff.). The chart style is borrowed from Randall Munroe’s Radiation Dose Chart over at xkcd.

These fractions will have changed a lot over time, of course. Around 13.7 billion years ago, in the Big Bang phase, there would have been no stars at all. And the number of, say, neutron stars or stellar black holes will have grown continuously as more and more massive stars have ended their lives, producing these kinds of stellar remnants. For this chart, following Fukugita and Peebles, we’ll look at the present era. What is the current distribution of energy in the universe? Unsurprisingly, the values given in that article come with different uncertainties – after all, the authors are extrapolating to a pretty grand scale! The details can be found in Fukugita & Peebles’ article; for us, their most important conclusion is that the observational data and their theoretical bases are now indeed firm enough for an approximate, but differentiated and consistent picture of the cosmic inventory to emerge.

Let’s start with what’s closest to our own home. How much of the energy (equivalently, mass) is in the form of planets? As it turns out: not a lot. Based on extrapolations from what data we have about exoplanets (that is, planets orbiting stars other than the sun), just one part-per-million (1 ppm) of all energy is in the form of planets; in scientific notation: 10-6. Let’s take “1 ppm” as the basic unit for our first chart, and represent it by a small light-green square. (Fractions of 1 ppm will be represented by partially filled such squares.) Here is the first box (of three), listing planets and other contributions of about the same order of magnitude:

So what else is in that box? Other forms of condensed matter, mainly cosmic dust, account for 2.5 ppm, according to rough extrapolations based on observations within our home galaxy, the Milky Way. Among other things, this is the raw material for future planets!

For the next contribution, a jump in scale. To the best of our knowledge, pretty much every galaxy contains a supermassive black hole (SMBH) in its central region. Masses for these SMBHs vary between a hundred thousand times the mass of our Sun and several billion solar masses. Matter falling into such a black hole (and getting caught up, intermittently, in super-hot accretion disks swirling around the SMBHs) is responsible for some of the brightest phenomena in the universe: active galaxies, including ultra high-powered quasars. The contribution of matter caught up in SMBHs to our energy inventory is rather modest, though: about 4 ppm; possibly a bit more.

Who else is playing in the same league? The sum total of all electromagnetic radiation produced by stars and by active galaxies (to name the two most important sources) over the course of the last billions of years, to name one: 2 ppm. Also, neutrinos produced during supernova explosions (at the end of the life of massive stars), or in the formation of white dwarfs (remnants of lower-mass stars like our Sun), or simply as part of the ordinary fusion processes that power ordinary stars: 3.2 ppm all in all.

Then, there’s binding energy: If two components are bound together, you will need to invest energy in order to separate them. That’s why binding energy is negative – it’s an energy deficit you will need to overcome to pry the system’s components apart. Nuclear binding energy, from stars fusing together light elements to form heavier ones, accounts for -6.3 ppm in the present universe – and the total gravitational binding energy accumulated as stars, galaxies, galaxy clusters, other gravitationally bound objects and the large-scale structure of the universe have formed over the past 14 or so billion years, for an even larger -13.4 ppm. All in all, the negative contributions from binding energy more than cancel out all the positive contributions by planets, radiation, neutrinos etc. we’ve listed so far.

Which brings us to the next level. In order to visualize larger contributions, we need a change scale. In box 2, one square will represent a fraction of 1/20,000 or 0.00005. Put differently: Fifty of the little squares in the first box correspond to a single square in the second box:

So here, without further ado, is box 2 (including, in the upper right corner, a scale model of the first box):

Now we are in the realm of stars and related objects. By measuring the luminosity of galaxies, and using standard relations between the masses and luminosity of stars (“mass-to-light-ratio”), you can get a first estimate for the total mass (equivalently: energy) contained in stars. You’ll also need to use the empirical relation (“initial mass function”) for how this mass is distributed, though: How many massive stars should there be? How many lower-mass stars? Since different stars have different lifetimes (live massively, die young), this gives estimates for how many stars out there are still in the prime of life (“main sequence stars”) and how many have already died, leaving white dwarfs (from low-mass stars), neutron stars (from more massive stars) or stellar black holes (from even more massive stars) behind. The mass distribution also provides you with an estimate of how much mass there is in substellar objects such as brown dwarfs – objects which never had sufficient mass to make it to stardom in the first place.

Let’s start small with the neutron stars at 0.00005 (1 square, at our current scale) and the stellar black holes (0.00007). Interestingly, those are outweighed by brown dwarfs which, individually, have much less mass, but of which there are, apparently, really a lot (0.00014; this is typical of stellar mass distribution – lots of low-mass stars, much fewer massive ones.) Next come white dwarfs as the remnants of lower-mass stars like our Sun (0.00036). And then, much more than all the remnants or substellar objects combined, ordinary, main sequence stars like our Sun and its higher-mass and (mostly) lower-mass brethren (0.00205).

Interestingly enough, in this box, stars and related objects contribute about as much mass (or energy) as more undifferentiated types of matter: molecular gas (mostly hydrogen molecules, at 0.00016), hydrogen and helium atoms (HI and HeI, 0.00062) and, most notably, the plasma that fills the void between galaxies in large clusters (0.0018) add up to a whopping 0.00258. Stars, brown dwarfs and remnants add up to 0.00267.

Further contributions with about the same order of magnitude are survivors from our universe’s most distant past: The cosmic background radiation (CMB), remnant of the extremely hot radiation interacting with equally hot plasma in the big bang phase, contributes 0.00005; the lesser-known cosmic neutrino background, another remnant of that early equilibrium, contributes a remarkable 0.0013. The binding energy from the first primordial fusion events (formation of light elements within those famous “first three minutes”) gives another contribution in this range: -0.00008.

While, in the previous box, the matter we love, know and need was not dominant, it at least made a dent. This changes when we move on to box 3. In this box, one square corresponds to 0.005. In other words: 100 squares from box 2 add up to a single square in box 3:

Box 3 is the last box of our chart. Again, a scale model of box 2 is added for comparison: All that’s in box 2 corresponds to one-square-and-a-bit in box 3.
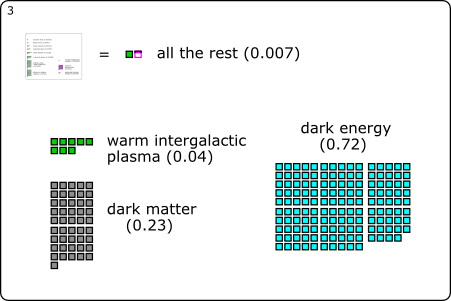
The first new contribution: warm intergalactic plasma. Its presence is deduced from the overall amount of ordinary matter (which follows from measurements of the cosmic background radiation, combined with data from surveys and measurements of the abundances of light elements) as compared with the ordinary matter that has actually been detected (as plasma, stars, e.g.). From models of large-scale structure formation, it follows that this missing matter should come in the shape (non-shape?) of a diffuse plasma, which isn’t dense (or hot) enough to allow for direct detection. This cosmic filler substance amounts to 0.04, or 85% of ordinary matter, showing just how much of a fringe phenomena those astronomical objects we usually hear and read about really are.

The final two (dominant) contributions come as no surprise for anyone keeping up with basic cosmology: dark matter at 23% is, according to simulations, the backbone of cosmic large-scale structure, with ordinary matter no more than icing on the cake. Last but not least, there’s dark energy with its contribution of 72%, responsible both for the cosmos’ accelerated expansion and for the 2011 physics Nobel Prize.

Minority inhabitants of a part-per-million type of object made of non-standard cosmic matter – that’s us. But at the same time, we are a species, that, its cosmic fringe position notwithstanding, has made remarkable strides in unravelling the big picture – including the cosmic inventory represented in this chart.

__________________________________________

Here is the full chart for you to download: the PNG version (1200×900 px, 233 kB) or the lovingly hand-crafted SVG version (29 kB).

The chart “The Cosmic Energy Inventory” is licensed under Creative Commons BY-NC-SA 3.0. In short: You’re free to use it non-commercially; you must add the proper credit line “Markus Pössel [www.haus-der-astronomie.de]”; if you adapt the work, the result must be available under this or a similar license.

Technical notes: As is common in astrophysics, Fukugita and Peebles give densities as fractions of the so-called critical density; in the usual cosmological models, that density, evaluated at any given time (in this case: the present), is critical for determining the geometry of the universe. Using very precise measurements of the cosmic background radiation, we know that the average density of the universe is indistinguishable from the critical density. For simplicity’s sake, I’m skipping this detour in the main text and quoting all of F & P’s numbers as “fractions of the universe’s total energy (density)”.

For the supermassive black hole contributions, I’ve neglected the fraction ?n in F & P’s article; that’s why I’m quoting a lower limit only. The real number could theoretically be twice the quoted value; it’s apparently more likely to be close to the value given here, though. For my gravitational binding energy, I’ve added F & P’s primeval gravitational binding energy (no. 4 in their list) and their binding energy from dissipative gravitational settling (no. 5).

The fact that the content of box 3 adds up not quite to 1, but to 0.997, is an artefact of rounding not quite consistently when going from box 2 to box 3. I wanted to keep the sum of all that’s in box 2 at the precision level of that box.
AVIATR: An Airplane Mission for Titan

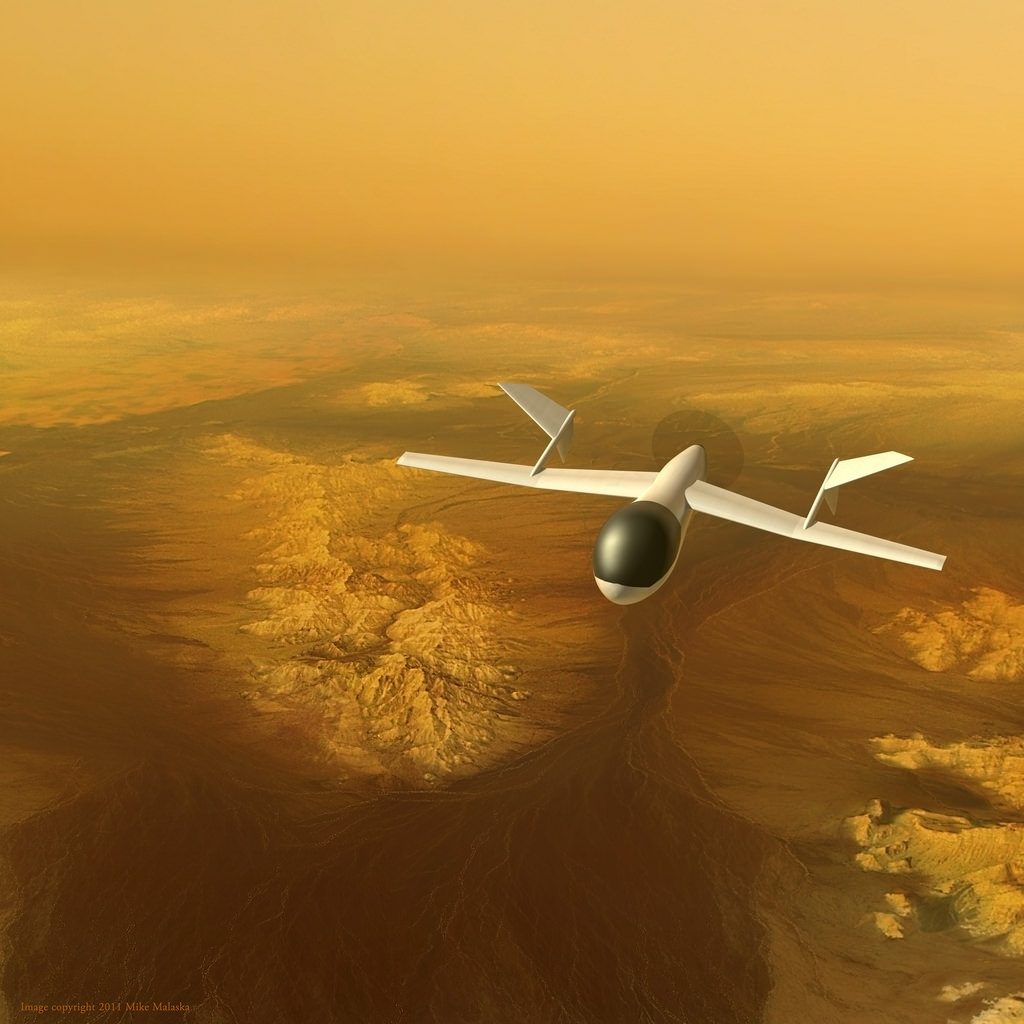
An artist's conception of AVIATR, an airplane mission to Saturn's largest moon Titan. Credit: Mike Malaska 2011

[/caption]

It has been said that the atmosphere on Titan is so dense that a person could strap a pair of wings on their back and soar through its skies.

It’s a pretty fascinating thought. And Titan – Saturn’s largest moon – is a pretty fascinating place. After all, it’s the only other body in our solar system (besides Earth, of course) that has that type of atmosphere and evidence of liquid on its surface.

“As far as its scientific interest, Titan is the most interesting target in the Solar System,” Dr. Jason W. Barnes of the University of Idaho told Universe Today.

That’s why Barnes and a team of 30 scientists and engineers created an unmanned mission concept to explore Titan called AVIATR (Aerial Vehicle for In-situ and Airborne Titan Reconnaissance). The plan, which primarily consists of a 120 kg plane soaring through the natural satellite’s atmosphere, was published online late last month.

The goal of the plane concept – which according to Barnes can serve as a standalone mission or as part of a larger Titan-focused exploration program – is to study the moon’s geography (its mountains, dunes, lakes and seas), as well as its atmosphere (the wind, haze, clouds and rain. Did you know that Titan is the only other place is our solar system where it rains?)

AVIATR is composed of three vehicles: one for space travel, one for entry and descent into Titan, and a plane to fly through the atmosphere. AVIATR, estimated to cost $715 million, would not prevent other missions from occurring on Titan, Barnes said. Instead, it would supplement the science being done by other projects.

“The science that AVIATR could do complements the science that can be accomplished from both orbiting and landed platforms,” the article stated.

Unfortunately, it seems like the plane concept won’t be happening anytime soon.

That’s because Titan didn’t make the National Research Council’s “Decadal Survey” – a prioritization of future planetary missions. (Read more about the survey in this Universe Today post.)

“Titan was deferred to another decade,” Barnes said.

But, he hopes to continue to build support for AVIATR so that it can get onto the next decadal survey in 2020. “We certainly had a lot of interest from people. We are breaking the paradigm that a balloon was the right way to go to Titan,” Barnes said.

So, why send an unmanned plane to study Titan’s atmosphere?

“Titan is the best place to fly an airplane in the whole solar system. We can go when and where we want,” Barnes said, adding that when compared to Earth, there’s four times more air and seven times less gravity on Titan. “A balloon is stuck in the wind.”

According to the article:

“A balloon entrained in primarily zonal winds near the equator would have no mechanism by which to travel to the polar regions to observe lakes and shoreline processes. Even if it were possible to get there, it is not clear that it would be desirable to send a balloon to the poles where Titan’s most violent meteorological activity takes place. AVIATR is both able to fly to the poles and is sufficiently robust to survive there.”

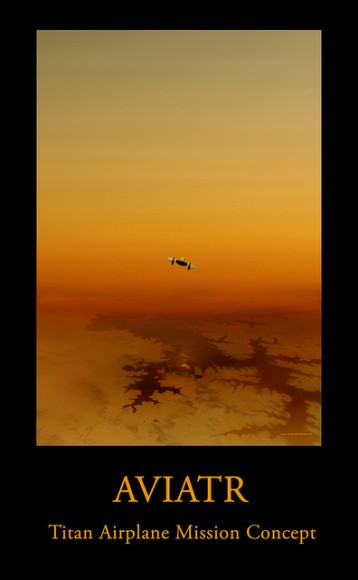
Mission poster for AVIATR. Credit: Mike Malaska

There’s also this issue: A shortage of plutonium-238.

“The radioactive decay of plutonium-238 provides the heat that powers RTGs, which can power spacecraft where there is insufficient sunlight for solar panels to operate. NASA is presently investing in a new type of RTG, called the ASRG,” the article stated. “A traditional hot-air balloon will not work on Titan with an ASRG owing to its lower heat production. In contrast, the AVIATR mission is specifically enabled by the use of ASRGs. The power density (in Watts per kilogram) and longevity of the ASRG allow an electrically-powered aircraft to fly on Titan.”

A plane could also find potential landing spots for future exploration. And, “since we are flying, we fly west the whole time so we can stay on the day side of Titan,” Barnes said.

That daylight would also help AVIATR collect photographic data during its travels and, according to Barnes, when it’s time to downlink that information, the plane would conserve energy by gliding through the air.

“And in doing so, we can also sample of bunch of altitude ranges,” Barnes said. “We are sampling the whole time.”

The plan seems interesting enough, but it’ll be quite a while before any data from the prospective mission would be coming back to Earth. If the plan is accepted (the earliest being 2020), the project would still have to be built, then once completed it would take 7 1/2 years to reach Titan. Once there, the mission would take about a nominal Earth year to study.

“I now realize that it’s a career-long project,” Barnes said to Universe Today. “The plan at this point is to keep this in the forefront of people’s minds and take whatever new ideas that people suggest and try to improve its prospect for selection.

To view the complete proposal, published in Experimental Astronomy, go here.

The 2012 Quadrantid Meteor Shower

Meteor Credit: Shooting Star Wallpapers

[/caption]
The first of the 2012 meteor showers – The Quadrantids – peaks on the night of the 3rd and 4th of January.

The Quadrantid meteor shower is one of the major annual meteor showers and often performs well under ideal observing conditions.

The Quadrantids can be quite impressive with a Zenithal Hourly Rate (ZHR) of up to 120 meteors per hour at their peak (under perfect conditions) and can sometimes produce rates of 60 to 200 meteors per hour. The peak is quite narrow lasting only a few hours, with activity either side of the peak sometimes being weak, but well worth observing.

Due to a waxing gibbous Moon, the best time to look is after midnight and through the early hours, plenty of time for us to see the peak build up to 07:20 UT on the 4th, but the Quadrantids are active from December 28th through January 12th so we should have plenty of chances to spot some shooting stars.

The radiant of the Quadrantids (where the meteors radiate from) is in the constellation of Boötes, however many people are misled in thinking they need to look at the radiant to see the meteors – this is not true. Meteors will come from the radiant, but will appear anywhere in the whole sky at random. You can trace the meteors (shooting stars) path back to the radiant to confirm if it is a meteor from the meteor shower.

You don’t need a telescope or binoculars to watch meteor showers, just your eyes. To enjoy a meteor shower and spot as many meteors as possible, you need to try and place yourself away from bright lights and make yourself comfortable. Meteor showers are best observed if you use a reclining garden chair or something similar so you can keep your gaze on the sky as long as possible. This will give you the best results.

For more information on how to observe and enjoy the Quadrantid meteor shower, visit meteorwatch.org

Quadrantid Meteor Credit: nasa.gov

Carnival of Space #230

This week’s Carnival of Space is hosted by our very own Steve Nerlich at his very own website, Cheap Astronomy.

Click here to read the Carnival of Space #230 and this week’s spacey goodness. The uber-creative Mr. Nerlich has also created a podcast version of the podcast, which you can download and listen to here.

And if you’re interested in looking back, here’s an archive to all the past Carnivals of Space. If you’ve got a space-related blog, you should really join the carnival. Just email an entry to [email protected], and the next host will link to it. It will help get awareness out there about your writing, help you meet others in the space community – and community is what blogging is all about. And if you really want to help out, sign up to be a host. Send and email to the above address.