In The Dragonfish’s Mouth – The Next Generation Of “SuperStars”

A high-resolution infrared image of Dragonfish association, showing the shell of hot gas. Credit:NASA/JPL-Caltech/GLIMPSE Team/Mubdi Rahman

[/caption]

At the University of Toronto, a trio of astronomers have been fishing – fishing for a copious catch of young, supermassive stars. What they caught was unprecedented… Hundreds of thousands of stars with several hundreds of these being the most massive kind. They hauled in blue stars dozens of times heavier than the Sun, with light so intense it ate its way through the gas that created it. All that’s left is the hollow egg-shell… A shell that measures a hundred light years across.

Their work will be published in the December 20 issue of the Astrophysical Journal Letters, but the team isn’t stopping there. The next catch is waiting. “By studying these supermassive stars and the shell surrounding them, we hope to learn more about how energy is transmitted in such extreme environments,” says Mubdi Rahman, a PhD candidate in the Department of Astronomy & Astrophysics at the University of Toronto. Rahman led the team, along with supervisors, Professors Dae-Sik Moon and Christopher Matzner.

Is the discovery of a huge factory for massive stars new? No. Astronomers have picked them up in other galaxies, but the distance didn’t allow for a clear picture – even when combined with data from other telescopes. “This time, the massive stars are right here in our galaxy, and we can even count them individually,” Rahman says.

However, studying this bright stellar cache isn’t going to be an easy task. Since they are located some 30,000 light years away, the measurements will be extremely labor intensive due to intervening gas and dust. Their light is absorbed, which makes the most luminous of them seem to be smaller and closer. To make matters worse, the fainter stars don’t show up at all. “All this dust made it difficult for us to figure out what type of stars they are,” Rahman says. “These stars are incredibly bright, yet, they’re very hard to see.”

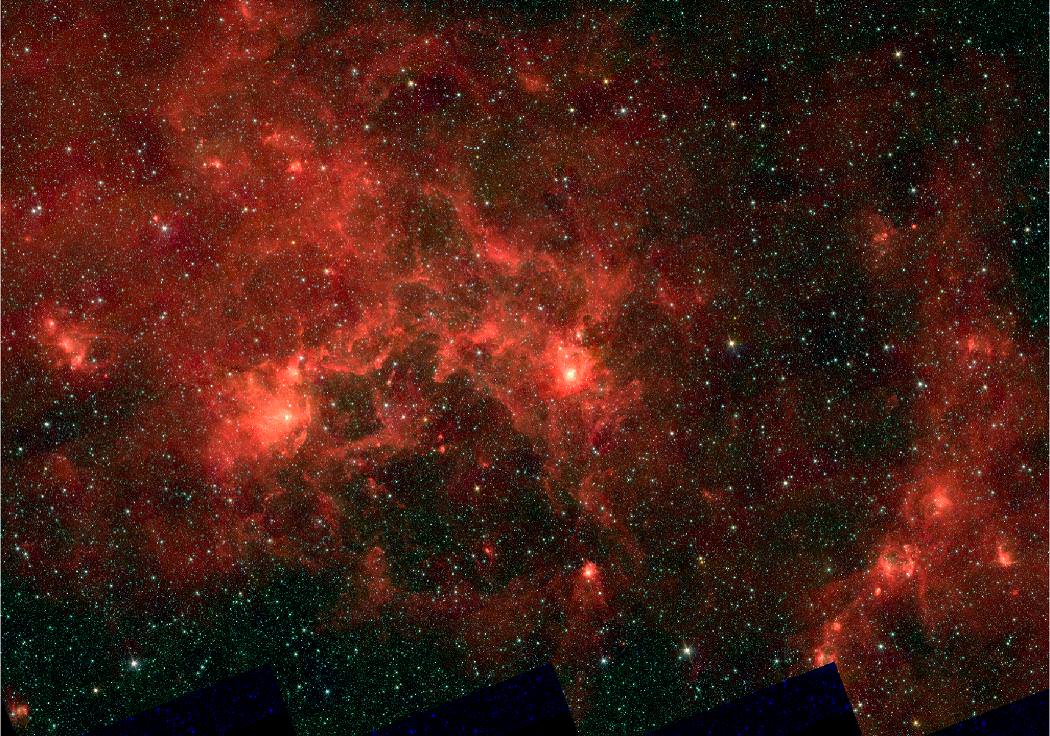
By employing the New Technology Telescope at the European Southern Observatory in Chile, the researchers gathered as much light as possible from a small collection of stars. From this point, they calculated the amount of light each star emitted across the spectrum to determine how many were massive. At least twelve were of the highest order, with a few measuring out to be around a hundred times more massive than the Sun. Before researching the area with a ground-based telescope, Rahman used the WMAP satellite to study the microwave band. There he encountered the glow of the heated gas shell. Then it was Spitzer time… and the imaging began in infra-red.

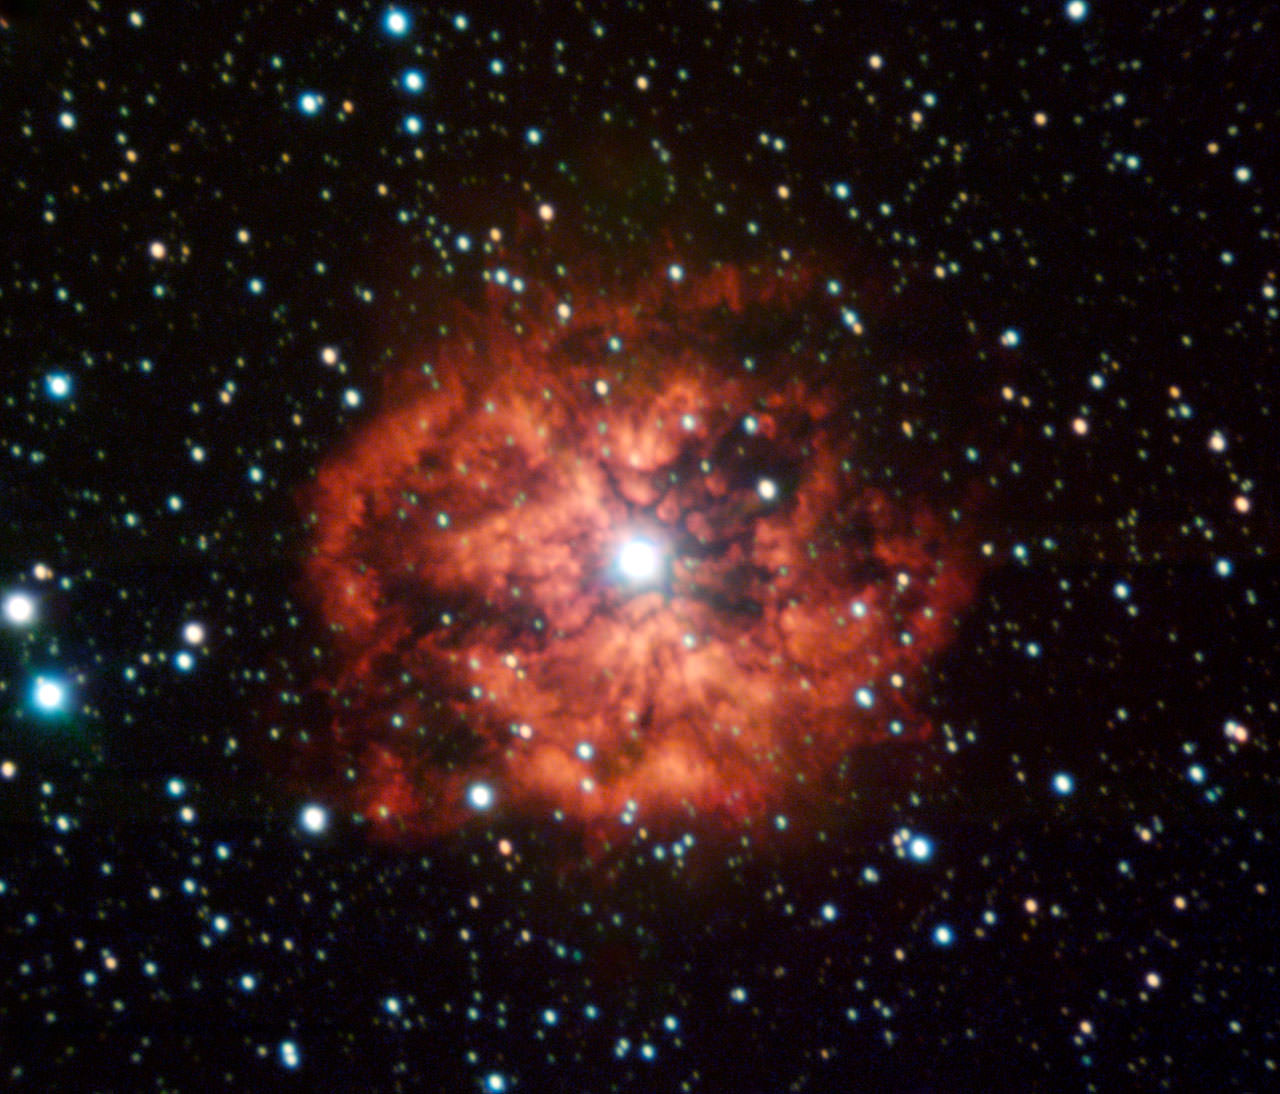
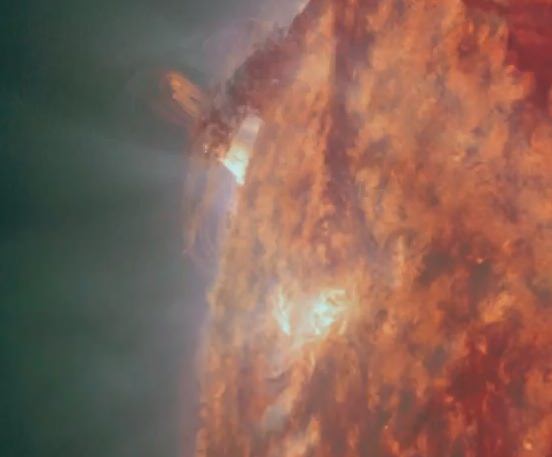
Once the photos came back the picture was clear… Rahman noticed the stellar egg-shell had a striking resemblance to Peter Shearer’s illustration “The Dragonfish”. And indeed it does look like a mythical creature! With just a bit of imagination you can see a tooth-filled mouth, eyes and even a fin. The interior of the mouth is where the gas has been expelled by the stellar light and propelled forward to form the shell. Not a sight you’d want to encounter on a dark night… Or maybe you would!

“We were able to see the effect of the stars on their surroundings before seeing the stars directly,” Rahman says. This strange heat signature would almost be like watching a face lit by a fire without being able to see the fueling source. Just as red coals are cooler than blue flame, gas behaves the same way in color – with much of it in the infra-red end of the spectrum and only visible to the correct instrumentation. At the other end of the equation are the giant stars which emit in ultra-violet and remain invisible in this type of image. “But we had to make sure what was at the heart of the shell,” Rahman says.

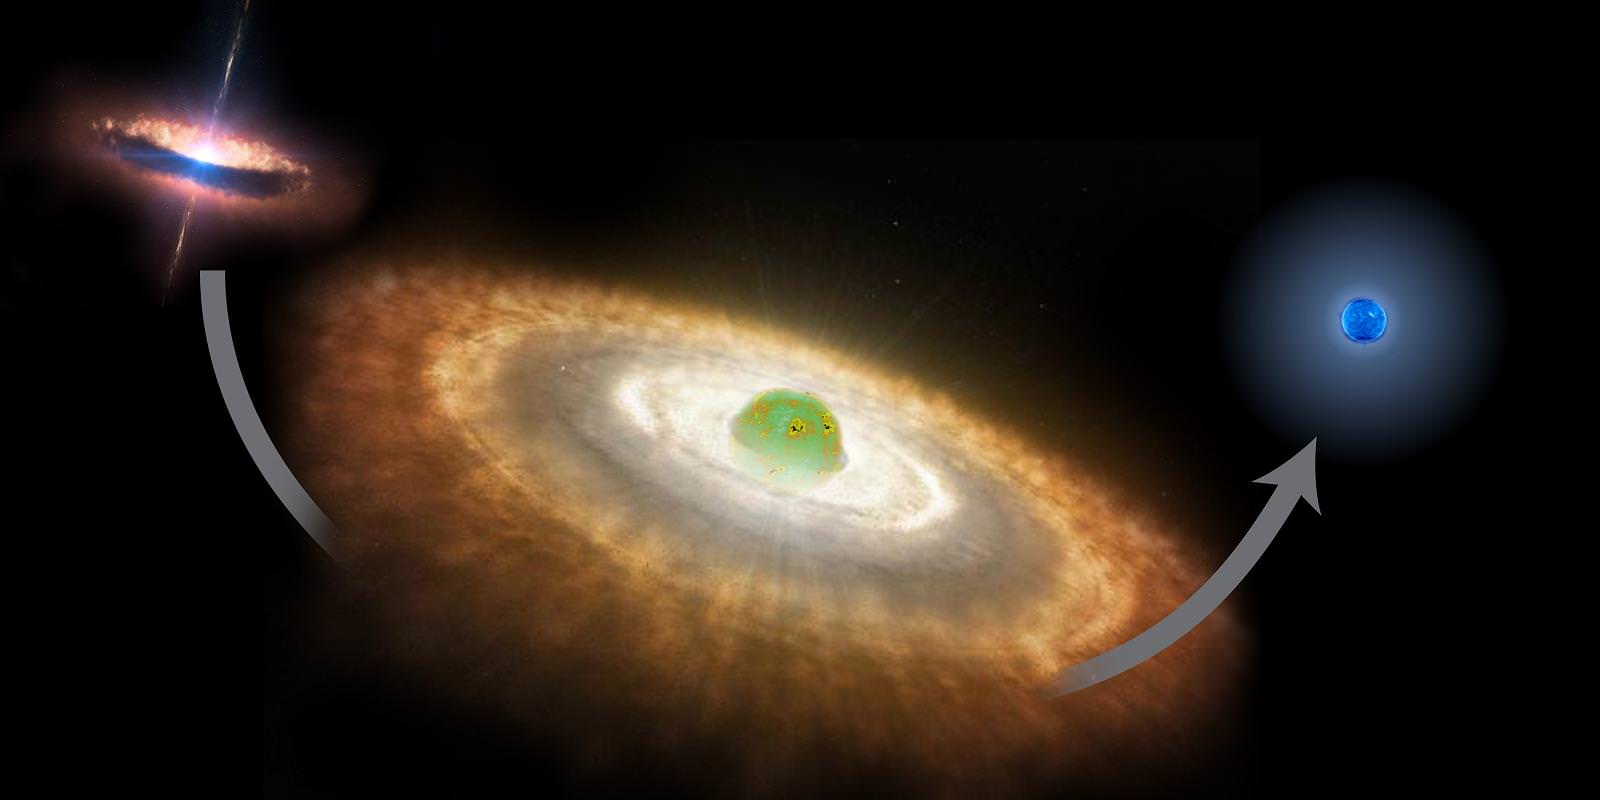
With the positive identification of several massive stars, the team knew they would expire quickly in astronomical terms. “Still, if you thought the inside of the shell was empty, think again,” explains Rahman. For every few hundred superstars, thousands of ordinary stars like the Sun also exist in this region. When the massive ones go supernova, they’ll release metals and heavy atoms which – in turn – may create solar nebulae around the less dramatic stars. This means they could eventually form solar systems of their own

“There may be newer stars already forming in the eyes of the Dragonfish,” Rahman says. Because some areas of the shell appear brighter, researchers surmise the gases contained there are possibly compressing enough to ignite new stars – with enough to go around for many more. However, when there’s no mass or gravity to hold them captive, it would seem they want to fly the nest. “We’ve found a rebel in the group, a runaway star escaping from the group at high speed,” Rahman says. “We think the group is no longer tied together by gravity: however, how the association will fly apart is something we still don’t understand well.”

Original Story Source: In The Dragonfish’s Mouth: The Next Generation Of Superstars To Stir Up Our Galaxy.

Astronomy Without A Telescope – How Big Is Big?

The compaison chart showing lots of large stars - but note that they are all red giants.

[/caption]

You may have seen one of these astronomical scale picture sequences, where you go from the Earth to Jupiter to the Sun, then the Sun to Sirius – and all the way up to the biggest star we know of VY Canis Majoris. However, most of the stars at the big end of the scale are at a late point in their stellar lifecycle – having evolved off the main sequence to become red supergiants.

The Sun will go red giant in 5 billion years or so – achieving a new radius of about one Astronomical Unit – equivalent to the average radius of the Earth’s orbit (and hence debate continues around whether or not the Earth will be consumed). In any case, the Sun will then roughly match the size of Arcturus, which although voluminously big, only has a mass of roughly 1.1 solar masses. So, comparing star sizes without considering the different stages of their stellar evolution might not be giving you the full picture.

Another way of considering the ‘bigness’ of stars is to consider their mass, in which case the most reliably confirmed extremely massive star is NGC 3603-A1a – at 116 solar masses, compared with VY Canis Majoris’ middling 30-40 solar masses.

The most massive star of all may be R136a1, which has an estimated mass of over 265 solar masses – although the exact figure is the subject of ongoing debate, since its mass can only be inferred indirectly. Even so, its mass is almost certainly over the ‘theoretical’ stellar mass limit of 150 solar masses. This theoretical limit is based on mathematically modelling the Eddington limit, the point at which a star’s luminosity is so high that its outwards radiation pressure exceeds its self-gravity. In other words, beyond the Eddington limit, a star will cease to accumulate more mass and will begin to blow off large amounts of its existing mass as stellar wind.

It’s speculated that very big O type stars might shed up to 50% of their mass in the early stages of their lifecycle. So for example, although R136a1 is speculated to have a currently observed mass of 265 solar masses, it may have had as much as 320 solar masses when it first began its life as a main sequence star.

So, it may be more correct to consider that the theoretical mass limit of 150 solar masses represents a point in a massive star’s evolution where a certain balancing of forces is achieved. But this is not to say that there couldn’t be stars more massive than 150 solar masses – it’s just that they will be always declining in mass towards 150 solar masses.

The Wolf-Rayet star WR 124 and its wind nebulae (actually denoted M1-67). The mass of WR 124 is estimated at a moderate 20 solar masses, although this is after it has already lost much of its initial mass to create the wind nebula around it. Credit: ESO.

Having unloaded a substantial proportion of their initial mass such massive stars might continue as sub-Eddington blue giants if they still have hydrogen to burn, become red supergiants if they don’t – or become supernovae.

Vink et al model the processes in the early stages of very massive O type stars to demonstrate that there is a shift from optically thin stellar winds, to optically thick stellar winds at which point these massive stars can be classified as Wolf-Rayet stars. The optical thickness results from blown off gas accumulating around the star as a wind nebulae – a common feature of Wolf-Rayet stars.

Lower mass stars evolve to red supergiant stage through different physical processes – and since the expanded outer shell of a red giant does not immediately achieve escape velocity, it is still considered part of the star’s photosphere. There’s a point beyond which you shouldn’t expect bigger red supergiants, since more massive progenitor stars will follow a different evolutionary path.

Those more massive stars spend much of their lifecycle blowing off mass via more energetic processes and the really big ones become hypernovae or even pair-instability supernovae before they get anywhere near red supergiant phase.

So, once again it appears that maybe size isn’t everything.

Further reading: Vink et al Wind Models for Very Massive Stars in the Local Universe.

Skywatchers Share Lunar Eclipse Photos, Videos

Indian Peaks in Colorado with the eclipsing Moon setting overhead. Credit: Patrick Cullis
A big eclipsed Moon over Indian Peaks in Colorado. Credit: Patrick Cullis

It was the final lunar eclipse of the year, and the last total lunar eclipse event for the western portion of the Americas until 2014, so skywatchers took advantage of clear skies, and many have shared their images and videos with Universe Today. Enjoy the views! For many of the images you can click on them and see larger versions on our Flickr group.

Above is a view in Colorado, taken by Patrick Cullis, showing the Indian Peaks with the eclipsing Moon setting overhead, taken during the lunar eclipse in the early morning hours of December 10, 2011. The Indian Peaks are a series of peaks on the continental divide near Boulder, Colorado. “The Moon set behind the continental divide right before totality, but it was still an awesome sight,” Cullis said.

Below is a video a to-die-for view of the eclipse over the Pacific Ocean.

Continue reading “Skywatchers Share Lunar Eclipse Photos, Videos”

Massive Stars Start Life Big… Really BIG!

Artist’s impression illustrating the formation process of massive stars. At the end of the formation process, the surrounding accretion disk disappears, revealing the surface of the young star. At this phase the young massive star is much larger than when it has reached a table equilibrium, i.e., when arriving on the so-called main sequence. Copyright: Lucas Ellerbroek/Lex Kaper University of Amsterdam

[/caption]

It might be hard to believe, but massive stars are larger in their infant stage than they are when fully formed. Thanks to a team of astronomers at the University of Amsterdam, observations have shown that during the initial stages of creation, super-massive stars are super-sized. This research now confirms the theory that massive stars contract until they reach the age of equilibrium.

In the past, one of the difficulties in proving this theory has been the near impossibility of getting a clear spectrum of a massive star during formation due to obscuring dust and gases. Now, using the powerful spectrograph X-shooter on ESO’s Very Large Telescope in Chile, researchers have been able to obtain data on a young star cataloged as B275 in the “Omega Nebula” (M17). Built by an international team, the X-shooter has a special wavelength coverage: from 300 nm (UV) to 2500 nm (infrared) and is the most powerful tool of its kind. Its “one shot” image has now provided us with the first solid spectral evidence of a star on its way to main sequence. Seven times more massive than the Sun, B275 has shown itself to be three times the size of a normal main-sequence star. These results help to confirm present modeling.

When young, massive stars begin to coalesce, they are shrouded in a rotating gas disk where the mass-accretion process starts. In this state, strong jets are also produced in a very complicated mechanism which isn’t well understood. These actions were reported earlier by the same research group. When accretion is complete, the disk evaporates and the stellar surface then becomes visible. As of now, B275 is displaying these traits and its core temperature has reached the point where hydrogen fusion has commenced. Now the star will continue to contract until the energy production at its center matches the radiation at the surface and equilibrium is achieved. To make the situation even more curious, the X-shooter spectrum has shown B275 to have a measurably lower surface temperature for a star of its type – a very luminous one. This wide margin of difference can be equated to its large radius – and that’s what the results show. The intense spectral lines associated with B275 are consistent with a giant star.

Lead author Bram Ochsendorf, was the man to analyze the spectrum of this curious star as part of his Master’s research program at the University of Amsterdam. He has also began his PhD project in Leiden. Says Ochsendorf, “The large wavelength coverage of X shooter provides the opportunity to determine many stellar properties at once, like the surface temperature, size, and the presence of a disk.”

The spectrum of B275 was obtained during the X-shooter science verification process by co-authors Rolf Chini and Vera Hoffmeister from the Ruhr-Universitaet in Bochum, Germany. “This is a beautiful confirmation of new theoretical models describing the formation process of massive stars, obtained thanks to the extreme sensitivity of X-shooter”, remarks Ochsendorf’s supervisor Prof. Lex Kaper.

Original Story Source: First firm spectral classification of an early-B pre-main-sequence star: B275 in M17.

International Measure The Moon Night – December 10, 2011

Are you planning on watching the lunar eclipse on Saturday, December 10? Would you like to try your hand at doing something new and unusual, like measuring the Moon? Then join the The Classroom Astronomer (TCA) magazine effort by using time-honored techniques – with a modern twist! Step inside and we’ll tell you where to get the information on how it’s done…

During the total lunar eclipse, viewers will be participating by observing the Moon’s location in the sky and its path through Earth’s shadow. These methods, known as the “Shadow Transit Method” and the “Lunar Parallax Method” are techniques that have been used throughout astronomical history.

“The Shadow technique can be done anyplace where the Moon can be watched through the beginning partial, total and end partial phases of the eclipse. It can be recorded by drawing or photography.” says MTM. “The Parallax technique has to be done with two observers sufficiently far apart (we estimate at least 2000 miles (3200 kilometers). It must be recorded with photography and the photographs have to be taken at the exact same time, with a field of view wide enough (4-8 degrees) such that the neighboring stars can be recorded at the same time on both photographs. A comparison of photographs through overlay procedures will show the shift of the stars (or Moon) as seen from one side of Earth to the other. The larger the shift, the closer the Moon.”

The Classroom Astronomer has created a website – MeasureTheMoon.org to help generate interest – for everyone from general observers to classrooms. Think of what a great activity this would make for your public outreach event!

When it comes to the Shadow Transit Method, the website has a downloadable template with lunar illustrations for hand plots of the shadow over the Moon’s face and a timeline sheet for putting those drawings and cut-out of the template into the proper position. A table to calculate the Moon’s distance and size from the resulting plot is also online. More information on the MeasureTheMoon.org website includes a map that shows where on Earth you need to be to use both methods. When the total lunar eclipse has ended, the website will open a venue where you can upload your photos, along with your Moon distance and diameter observations.

Have fun!!

Information provided by Measure The Moon.

Twisting and Eclipsing on the Sun

A filament partially blocks SDO's view of erupting plasma on Dec. 9. (NASA/SDO)


A video posted today by the team at NASA’s Solar Dynamics Observatory shows two recent events on the Sun: a twisting prominence and the “eclipse” of a plasma eruption by the structure of a darker, cooler filament. Most impressive!

From the SDO team:

Over the past 24 hours we have seen some beautiful solar events. None of them have a direct impact on Earth, but they are astonishing to watch. It just shows how an active star our Sun really is… far from boring! 

On December 8, 2011 a twisting prominence eruption occurred on the lower eastern limb. The view through the AIA 304 angstrom filter shows us this beautiful eruption. 

A filament partially blocks SDO's view of erupting plasma on Dec. 9. (NASA/SDO)
In the early hours of December 9, 2011 SDO observed a little bit of a different eclipse. An erupting cloud of plasma was eclipsed by a dark magnetic filament. The eruption is still on the far side of the Sun, behind the eastern limb and is slowly moving forward and over the limb sometime next week. 

In front you can observe the filament of relatively cool dark material floating across the Sun’s surface in the foreground. That filament partially blocks the view of the hot plasma eruption behind it. 

Excellent footage of our constantly-active Sun! It’s easy to forget too that these events and structures are many, many times larger than our entire planet… the sheer power of a star is quite an impressive thing to see. Thanks to SDO we get an unblinking front-row seat to all the action!

See more from SDO on the mission site here.

Thanks to Camilla Corona SDO, the team’s mascot, official spokesbird and all-around “hot chick”!

Mars Orbiters Will Attempt to Take Pictures of the Curiosity Rover as It Lands

Mars Reconnaissance Orbiter's High Resolution Imaging Science Experiment (HiRISE) camera captured this image of Phoenix hanging from its parachute as it descended to the Martian surface. Credit: NASA/JPL/University of Arizona.

[/caption]

Remember this amazing image from 2008? The HiRISE (High Resolution Imaging Science Experiment) camera on the Mars Reconnaissance Orbiter captured the Phoenix lander descending on a parachute to land on Mars’ north polar region. MRO will attempt a repeat performance in August of 2012 when the Mars Science Laboratory rover “Curiosity” will be landing in Gale Crater on Mars. Capturing this event would be epic, especially with MSL’s unique “skycrane” landing system.

“Yes, MRO is planning to image the descent of MSL with both HiRISE and CTX (Context Camera),” Alfred McEwen, HiRISE principal investigator told Universe Today. “For Phoenix we got a bit lucky with HiRISE in terms of the geometry, giving us a high probability of success. It may not work out so well for MSL. What I’d really like is to capture the rover hanging from the skycrane, but the timing may be difficult.”

Again, the word here is epic.

So, how challenging is it for a spacecraft orbiting Mars to try and track another spacecraft coming in?

“If we were not to do anything, the Mars’ orbiting spacecraft may be on the other side of the planet,” said MSL navigation team chief Tomas Martin-Mur, during an interview with UT. “So as soon as we launch, we tell the other spacecraft where we are going to be by the time of entry so they can change their orbits over time, so they will be flying overhead as MSL approaches the planet.”

The orbiters – which also includes NASA’s Mars Odyssey and ESA’s Mars Express – will have to do special maneuvers to be aligned in just the right place – nearby to MSL’s point of entry into Mars’ atmosphere — and they may even have to change the plane of their orbit.

This artist's concept shows the sky crane maneuver during the descent of NASA's Curiosity rover to the Martian surface. Credit: NASA/JPL-Caltech.

“The other thing that we’ll need them to do is to point their UHF antennas towards MSL,” Martin-Mur said. “Normally their antennas will be pointed to take pictures, but they will have to go to a special attitude to point to MSL. This will enable them to try — like they did with Phoenix — to take a picture of the spacecraft as it is coming down to the planet. We are hoping to see the parachute deployed and maybe more.”

“That was a great picture for Phoenix, and we will attempt to repeat that,” Martin-Mur added.

While Odyssey and Mars Express’ cameras may not have the resolving power to capture such an image, MRO’s powerful HiRISE camera does. However it has a narrower field of view, so as much skill and planning as this requires, the team will need a little luck, too. But there’s also the CTX.

“CTX has a much larger field of view and will likely capture it,” McEwen said, “but at 20X lower resolution than HiRISE, which should still be good enough to detect the parachute.”

Here’s a preview of what MSL will be going through during the perilous entry descent and landing:

Learn more about the navigation for MSL, currently traveling on its way to Mars, in our previous interview with Tomas Martin-Mur.

Mapping The Milky Way’s Magnetic Fields – The Faraday Sky

Fig. 3: In this map of the sky, a correction for the effect of the galactic disk has been made in order to emphasize weaker magnetic field structures. The magnetic field directions above and below the disk seem to be diametrically opposed, as indicated by the positive (red) and negative (blue) values. An analogous change of direction takes place accross the vertical center line, which runs through the center of the Milky Way.

[/caption]

Kudos to the scientists at the Max Planck Institut and an international team of radio astronomers for an incredibly detailed new map of our galaxy’s magnetic fields! This unique all-sky map has surpassed its predecessors and is giving us insight into the magnetic field structure of the Milky Way beyond anything so far seen. What’s so special about this one? It’s showing us a quality known as Faraday depth – a concept which works along a specific line of sight. To construct the map, data was melded from 41,000 measurements collected from a new image reconstruction technique. We can now see not only the major structure of galactic fields, but less obvious features like turbulence in galactic gas.

So, exactly what does a new map of this kind mean? All galaxies possess magnetic fields, but their source is a mystery. As of now, we can only guess they occur due to dynamo processes… where mechanical energy is transformed into magnetic energy. This type of creation is perfectly normal and happens here on Earth, the Sun, and even on a smaller scale like a hand-crank powered radio – or a Faraday flashlight! By showing us where magnetic field structures occur in the Milky Way, we can get a better understanding of galactic dynamos.

Fig. 1: The sky map of the Faraday effect caused by the magnetic fields of the Milky Way. Red and blue colors indicate regions of the sky where the magnetic field points toward and away from the observer, respectively. The band of the Milky Way (the plane of the galactic disk) extends horizontally in this panoramic view. The center of the Milky Way lies in the middle of the image. The North celestial pole is at the top left and the South Pole is at the bottom right.
For the last century and a half, we’ve known about Faraday rotation and scientists use it to measure cosmic magnetic fields. This action happens when polarized light goes through a magnetized medium and the plane of polarization revolves. The amount of turn is dependent on the strength and direction of the magnetic field. By observation of the rotation we can further understand the properties of the intervening magnetic fields. Radio astronomers gather and examine the polarized light from distant radio sources passing through our galaxy on its way to us. The Faraday effect can then be judged by measuring the source polarization at various frequencies. However, these measurements can only tell us about the one path through the Milky Way. To see things as a whole, one needs to know how many sources are scattered over the visible sky. This is where the international group of radio astronomers played an important role. They proved data from 26 different projects which gave a grand total of 41,300 pinpoint sources – at an average of about one radio source per square degree of sky.

Although that sounds like a wealth of information, it’s still not really enough. There are huge areas, particularly in the southern sky, where only a few measurements exist. Because of this lack of data, we have to interpolate between existing data points and that creates its own problems. First, the accuracy varies and more precise measurements should help. Also, astronomers are not exactly sure of how reliable a single measurement can be – they just have to take their best guess based on what information they have. Still, other problems exist. There are measurement uncertainties due to the complex nature of the process. A small error can increase by tenfold and this could convolute the map if not corrected. To help fix these problems, scientists at MPA developed a new algorithm for image capture, named the “extended critical filter”. In its creation, the team utilizes tools provided by the new discipline known as information field theory – a powerful tool that blends logical and statistical methods to applied fields and stacks it up against inaccurate information. This new work is exciting because it can also be applied to other imaging and signal-processing venues in alternate scientific fields.

Fig. 2: The uncertainty in the Faraday map. Note that the range of values is significantly smaller than in the Faraday map (Fig. 1). In the area of the celestial south pole, the measurement uncertainties are particularly high because of the low density of data points.
“In addition to the detailed Faraday depth map (Fig. 1), the algorithm provides a map of the uncertainties (Fig. 2). Especially in the galactic disk and in the less well-observed region around the south celestial pole (bottom right quadrant), the uncertainties are significantly larger.” says the team. “To better emphasize the structures in the galactic magnetic field, in Figure 3 (above) the effect of the galactic disk has been removed so that weaker features above and below the galactic disk are more visible. This reveals not only the conspicuous horizontal band of the gas disk of our Milky Way in the middle of the picture, but also that the magnetic field directions seem to be opposite above and below the disk. An analogous change of direction also takes place between the left and right sides of the image, from one side of the center of the Milky Way to the other.”

The good news is the galactic dynamo theory seems to be spot on. It has predicted symmetrical structures and the new map reflects it. In this projection, the magnetic fields are lined up parallel to the plane of the galactic disc in a spiral. This direction is opposite above and below the disc and the observed symmetries in the Faraday map arise from our location within the galactic disc. Here we see both large and small structures tied in with the turbulent, dynamic Milky Way gas structures. This new map algorithm has a great side-line, too… it characterizes the size distribution of these structures. Larger ones are more definitive than smaller ones, which is normal for turbulent systems. This spectrum can then be stacked against computer models of dynamics – allowing for intricate testing of the galactic dynamo models.

This incredible new map is more than just another pretty face in astronomy. By providing information of extragalactic magnetic fields, we’re enabling radio telescope projects such as LOFAR, eVLA, ASKAP, Meerkat and the SKA to rise to new heights. With this will come even more updates to the Faraday Sky and reveal the mystery of the origin of galactic magnetic fields.

Original Story Source: Max Planck Institut for Astrophysics News Release. For Further Reading: An improved map of the galactic Faraday sky”. Download the map HERE.

Could Solar Storms ‘Sandblast’ the Moon?

Coronal Mass Ejection as viewed by the Solar Dynamics Observatory on June 7, 2011. A similar type of outburst triggered aurorae during a strong geomagnetic storm in February 1872. Image Credit: NASA/SDO

[/caption]According to a new set of NASA computer simulations, solar storms and Coronal Mass Ejections (CMEs) can erode the lunar surface. Researchers speculate that not only can these phenomena erode the lunar surface, but could also be a cause of atmospheric loss for planets without a global magnetic field, such as Mars.

A team led by Rosemary Killen at NASA’s Goddard Space Flight Center, has written papers exploring different aspects of these phenomena and will appear in an issue of the Journal of Geophysical Research Planets. The team’s research was also presented earlier this week during the fall meeting of the American Geophysical Union.

What are CME’s? Corona Mass Ejections are intense outbursts of the Sun’s usually normal solar wind which consists of electrically charged particles (plasma). CME’s blow outward from the surface of the Sun at speeds in excess of 1.6 million kilometers per hour into space and can contain over a billion tons of plasma in a cloud larger than Earth.

Our Moon has the faintest traces of an atmosphere, which is technically referred to as an exosphere. The lack of any significant atmosphere, combined with the lack of a magnetic field, makes the lunar surface vulnerable to the effects of CME’s.

William Farrell, DREAM (Dynamic Response of the Environment at the Moon) team lead at NASA Goddard, remarked, “We found that when this massive cloud of plasma strikes the Moon, it acts like a sandblaster and easily removes volatile material from the surface. The model predicts 100 to 200 tons of lunar material – the equivalent of 10 dump truck loads – could be stripped off the lunar surface during the typical 2-day passage of a CME.”

While CME’s have been extensively studied, Farrell’s research is the first of its kind that attempts to predict the effects of a CME on the Moon. “Connecting various models together to mimic conditions during solar storms is a major goal of the DREAM project” added Farrell.

When intense heat or radiation is applied to a gas, the electrons can be removed, turning the atoms into ions. This process is referred to as “ionization”, and creates the fourth form of matter, known as plasma. Our Sun’s intense heat and radiation excites gaseous emissions, thus creating a solar wind plasma of charged particles. When plasma ions eject atoms from a surface, the process is called “sputtering”.

The lead author of the research paper Rosemary Killen described this phenomenon: “Sputtering is among the top five processes that create the Moon’s exosphere under normal solar conditions, but our model predicts that during a CME, it becomes the dominant method by far, with up to 50 times the yield of the other methods.”

Images from computer simulations of the lunar calcium exosphere during a CME (left) and the slow solar wind (right). Red and yellow indicate a relatively high abundance of calcium atoms while blue, purple, and black indicate a low abundance. The CME produces a much denser exosphere than the slow solar wind. Image Credit: NASA / Johns Hopkins University

In an effort to better test the team’s predictions, studies will be performed using NASA’s Lunar Atmosphere And Dust Environment Explorer (LADEE). Scheduled to launch in 2013 and orbit the Moon, the team is confident that the strong sputtering effect will send atoms from the lunar surface to LADEE’s orbital altitude (20 to 50 km).

Farrell also added, “This huge CME sputtering effect will make LADEE almost like a surface mineralogy explorer, not because LADEE is on the surface, but because during solar storms surface atoms are blasted up to LADEE.”

Affecting more than just our Moon, solar storms also affect Earth’s magnetic field and are the root cause of the Northern and Southern lights (aurorae). The effect solar storms have on Mars is a bit more significant, due in part to the Red Planet’s lack of a planet-wide magnetic field. It is widely theorized that this lack of a magnetic field allows the solar wind and CME’s to erode the martian atmosphere. In late 2013, NASA will launch the Mars Atmosphere and Volatile Evolution (MAVEN) mission. The goal of MAVEN is to orbit Mars and help researchers better understand how solar activity, including CMEs, affects the atmosphere of the red planet.

Learn more about the DREAM team at: http://ssed.gsfc.nasa.gov/dream/
If you’d like to know more about NASA’s Lunar efforts, visit: http://lunarscience.nasa.gov/

Source: NASA Solar System News

Lunar Eclipse – Saturday, December 10, 2011

Aligning his camera on the same star for nine successive exposures, Sky & Telescope contributing photographer Akira Fujii captured this record of the Moon’s progress dead center through the Earth’s shadow in July 2000. Credit: Sky & Telescope / Akira Fujii

[/caption]

Are you ready for some good, old-fashioned observing fun? Although you might not want to get up early, it’s going to be worth your time. This Saturday, December 10, 2011, marks the last total lunar eclipse event for the western portion of the Americas until 2014. While a solar eclipse event has a very small footprint where it is visible, a lunar eclipse has a wide and wonderful path that encompasses a huge amount of viewers. “We’re all looking at this together,” says Sky & Telescope senior editor Alan MacRobert.

How much of the dawn lunar eclipse will be visible for you? For your location, this map tells what stage the eclipse will have progressed to by the time the Moon sets below your west-northwestern horizon. Credit: Sky & Telescope
If you live in the eastern portion of the Americas, sorry… You’ll miss out on this one. In the Central time zone, the Moon will be setting while it is partially eclipsed. However, beginning in a line that takes in Arizona and the Dakotas you’ll be treated to the beginning of the lunar eclipse, totality, and it will set as it is beginning to come out of eclipse. If you live in the western portion of the US or Canada? Lucky you! You’ll get to enjoy the Moon as it goes through the initial states of eclipse, see totality and even might catch the phases as it slips out of Earth’s shadow again – just as the Sun begins to rise. For Skywatchers in Hawaii, Australia, and East Asia, you’ll have it better. Seen from there, the whole eclipse happens high in a dark sky from start to finish. For Europe and Africa, the eclipsed Moon will be lower in the east during or after twilight on the evening of the 10th.

When exactly does the event begin? The lunar eclipse will be total from 6:05 to 6:57 a.m. Pacific Standard Time. The partial stage of the eclipse begins more than an hour earlier, at 4:45 a.m. PST. Be sure to watch the southern lunar edge, too. Because the Moon will be skimming by the southern edge of the Earth’s shadow, it will remain slightly brighter and add to the dimensional effect you’ll see. Enjoy the coppery colors from the refracted sunlight! The Moon won’t be black – but it will most certainly be a very photogenic experience.

“That red light on the Moon during a lunar eclipse comes from all the sunrises and sunsets around the Earth at the time,” explains Sky & Telescope editor in chief Robert Naeye. “If you were an astronaut standing on the Moon and looking up, the whole picture would be clear. The Sun would be covered up by a dark Earth that was ringed all around with a thin, brilliant band of sunset- and sunrise-colored light — bright enough to dimly illuminate the lunar landscape around you.”

May clear skies be yours!

Original News Source: Sky and Telescope News Release. Image Credits: Sky and Telescope.