And if you’re interested in looking back, here’s an archive to all the past Carnivals of Space. If you’ve got a space-related blog, you should really join the carnival. Just email an entry to [email protected], and the next host will link to it. It will help get awareness out there about your writing, help you meet others in the space community – and community is what blogging is all about. And if you really want to help out, sign up to be a host. Send and email to the above address.
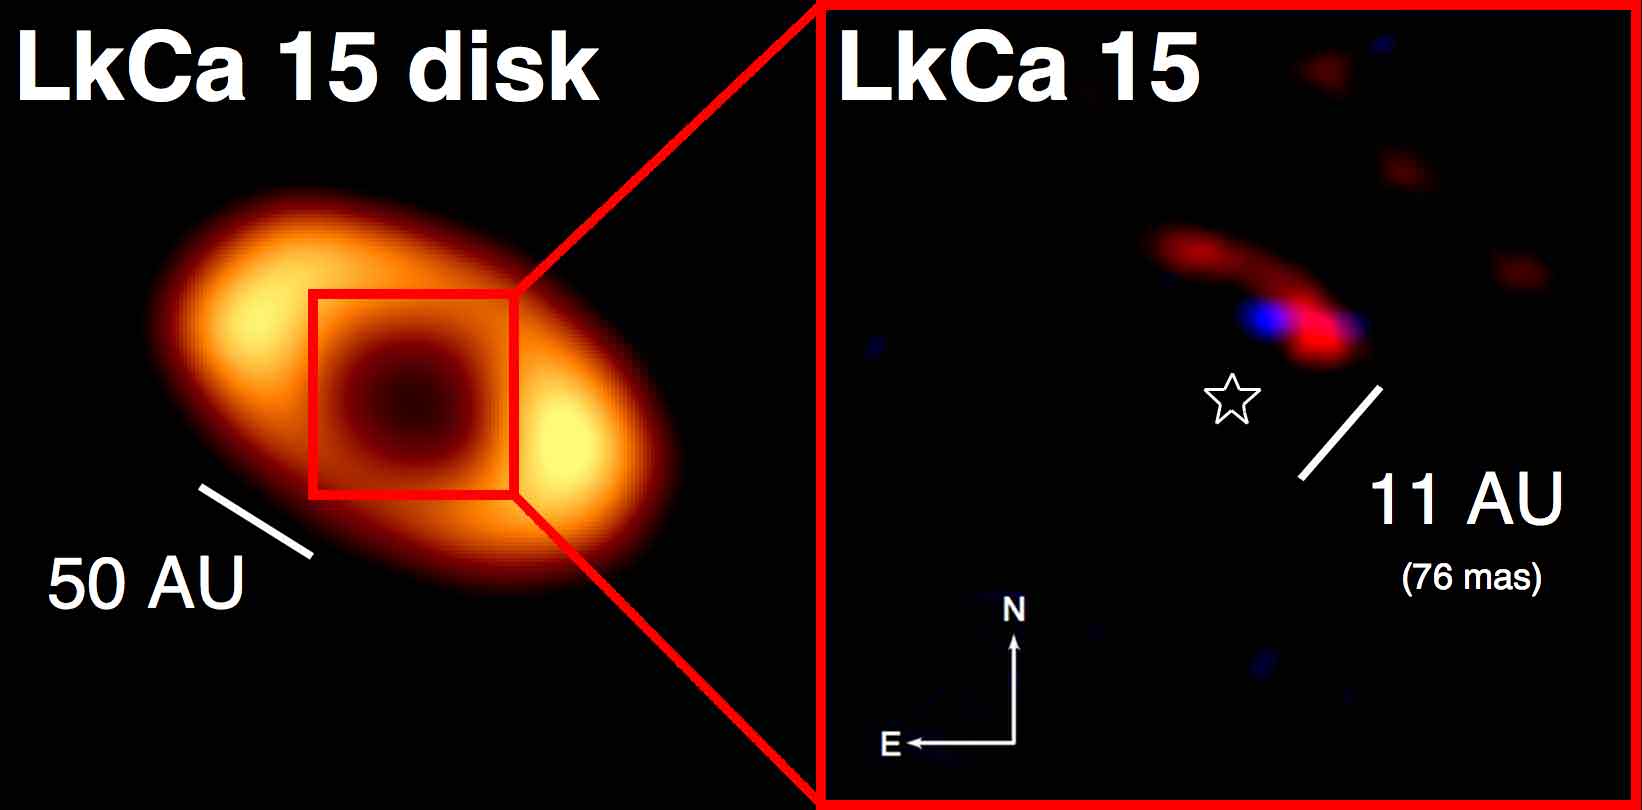
The left image shows the transitional disk around the star LkCa 15. All of the light at this wavelength is emitted by cold dust in the disk. The hole in the centre indicates an inner gap with a radius of around 55 times the distance from the Earth to the Sun. The right image is an expanded view of the central part of the cleared region, illustrating a composite of two reconstructed images (blue: 2.1 micrometres, from November 2010; red: 3.7 micrometres) for LkCa 15. The location of the central star is also marked. Image: Kraus & Ireland 2011.
[/caption]
Astronomers have taken a step closer to finding out how planetary systems form with the discovery of the ‘youngest’ planet ever found. LkCa 15 b is so young, it is still in the act of forming. This is the first direct image of a planet in the process of forming, and data indicates the planet is still being pieced together by gas and dust falling into its clutches from a cooler envelope that surrounds it.
The hot protoplanet orbits a star which possesses a mass comparable to our Sun, and is the youngest planetary system ever to be identified, with LkCa 15 aged at 2 million years, “We really have the age of the star and not the planet,” said Michael Ireland, a lecturer in astrophotonics at the Australian Astronomical Observatory. “The age of the star was determined by a great many people studying the gravitational contraction of both LkCa 15 and all of the other stars in the Taurus star forming region, which formed at nearly the same time.”
The observations were made by astronomers from the University of Hawaii and the Australian Astronomical Observatory using the keen eyesight of the twin 10-metre Keck telescopes located on the summit of Hawaii’s dormant Mauna Kea volcano.
For decades, astronomers have been aware that many young stars that pepper the Universe are shrouded by clouds of gas and dust. And since this realization they have enlisted the help of powerful infrared space observatories such as NASA’s Spitzer Space Telescope to peer into dusty cosmic regions that are hidden from optical telescopes.
Until now scientists had not been lucky enough to capture observations of new planets forming around these young stars, but thanks to the trickery of adaptive optics combined with ‘aperture mask interferometry’ that allows astronomers to resolve discs of dust around stars without the hindrance of dazzling starlight, imaging LkCa 15 b became possible. “It’s like we have an array of small mirrors,” said Adam Kraus of the University of Hawaii’s Institute for Astronomy. “We can manipulate the light and cancel out distortions.”
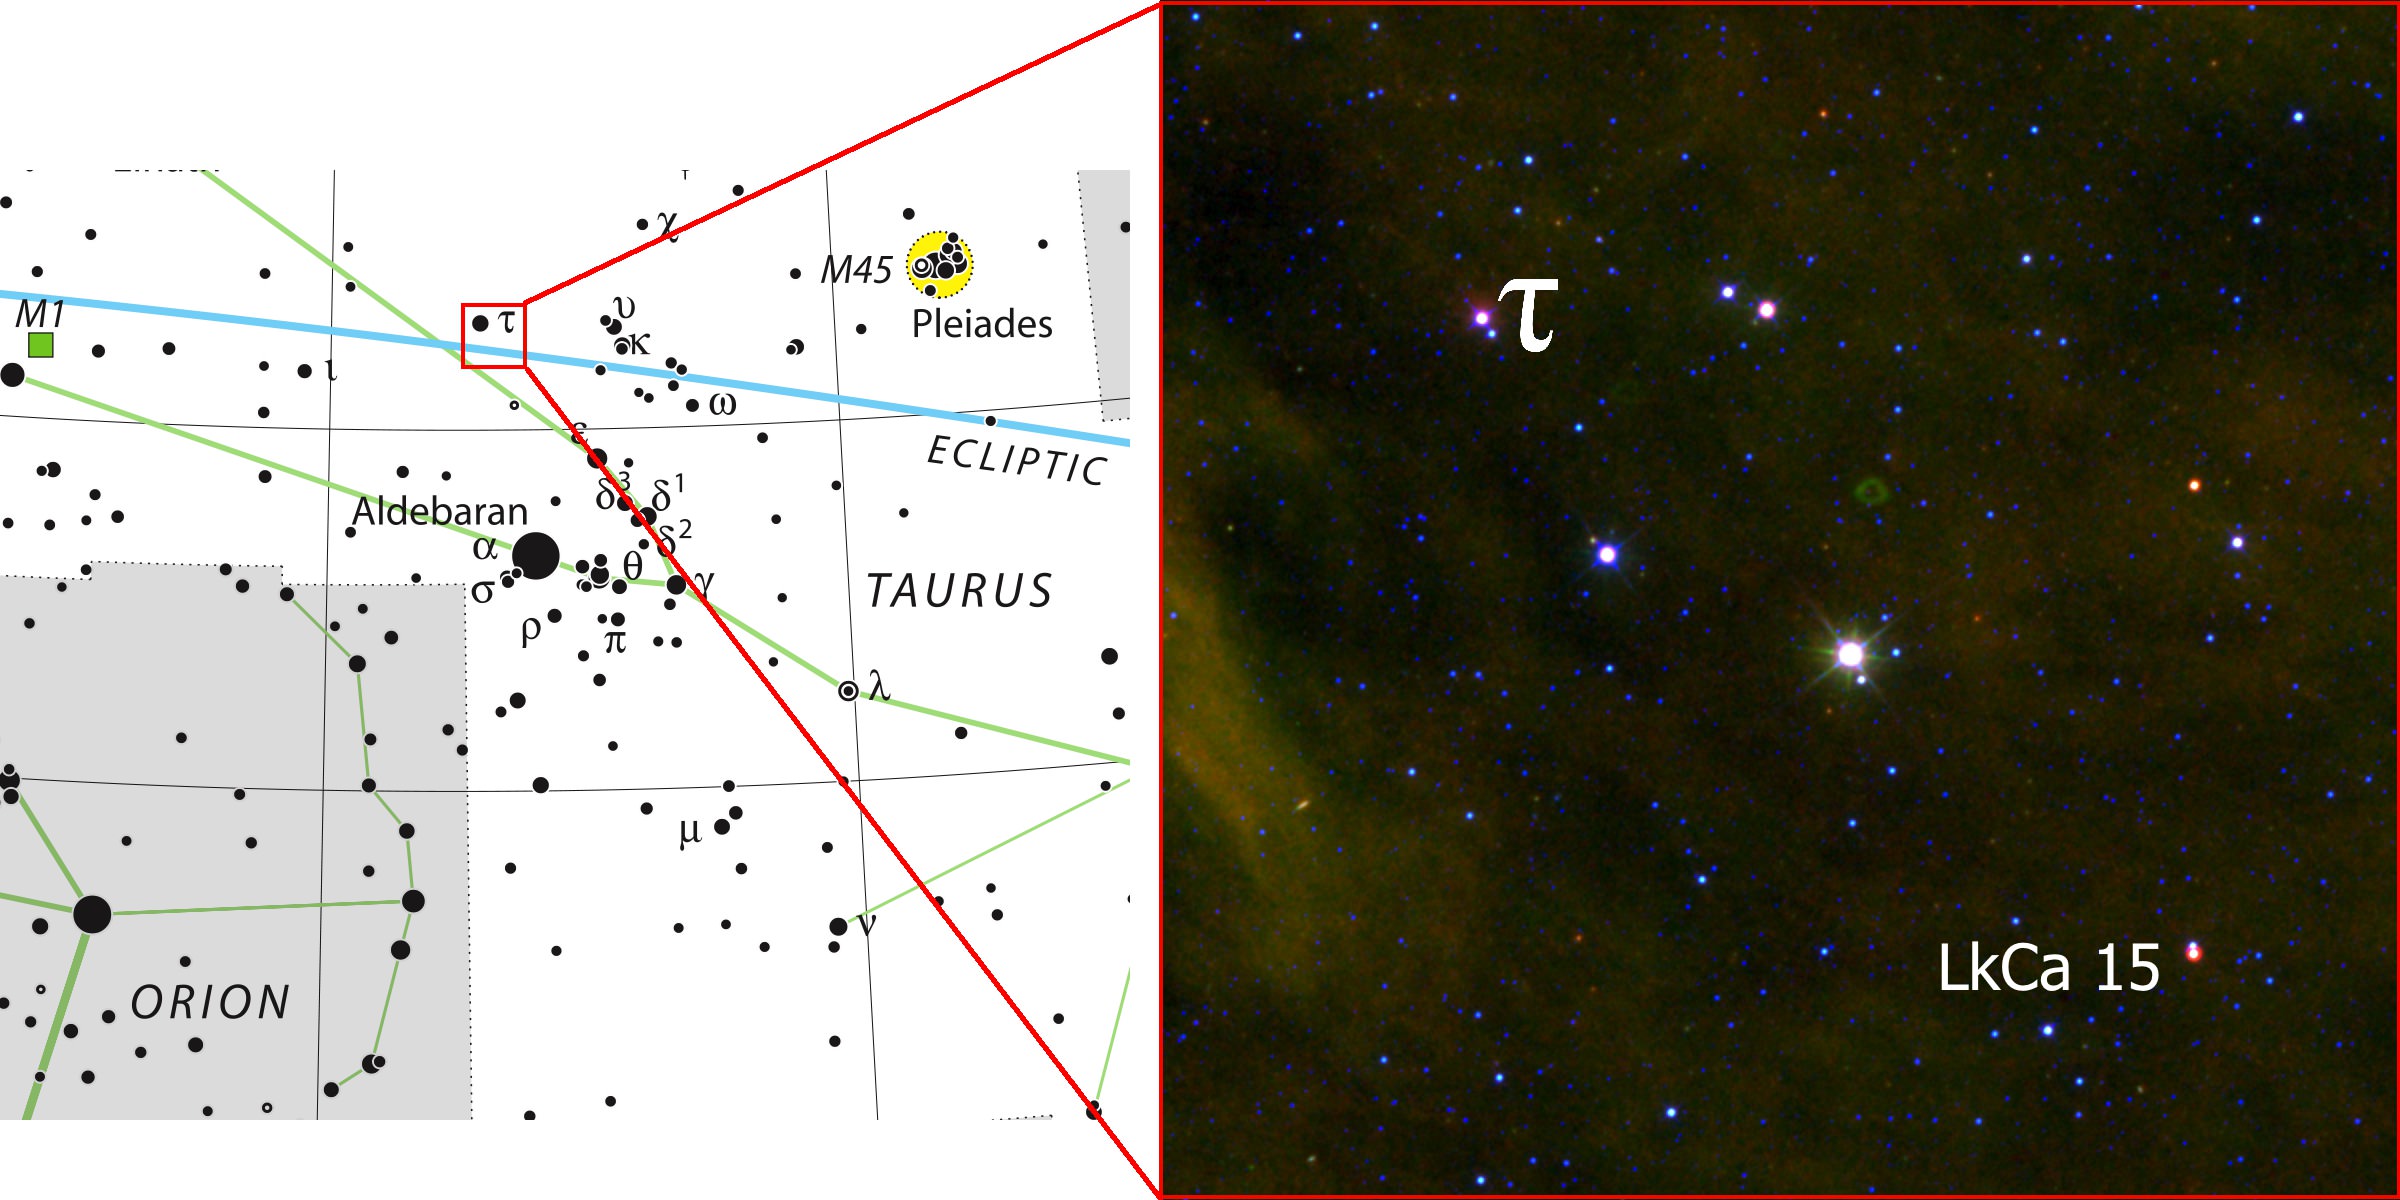
The location of LkCa 15 can be found using the above chart. Image: Adam Kraus/IAU/Sky & Telescope.
The astronomers have made the clever technique operable since 2008, which allowed them to search for gaps between stars and their protoplanetary dust discs where they figured planets are most likely to be lurking. In 2009 they were rewarded for their efforts as LkCa 15 b presented itself hugging its star, still bright from the energy of its formation. “LkCa 15 was only our second target and we immediately knew we were seeing something new,” said Kraus. “We could see a faint point source near the star, so thinking it might be a Jupiter-like planet we went back a year later to get more data.”
This hot, young world provides a view of the hellish birth of nascent planets.
“The protoplanet is heated up by its gravitational contraction energy,” said Ireland. “Gravitational potential energy is enough to make a truck’s brakes really hot when it goes down a mountain too fast. The potential energy of an entire planet being dropped onto itself is enough to make it glow red hot for millions of years. The planet is more than 1000 degrees Celsius – measuring its temperature more accurately is one of our goals next year. The dust and gas is mostly heated by the radiation field of the star and planet, and in equilibrium, reaches a temperature of less than 100 kelvins [-170 degrees Celsius].”
However, as the young planet pulls in more gas and dust onto itself, the astronomers can only guess as to how big this distant world could get. “The large outer disc around LkCa 15 still has about 55 Jupiter masses of material left in it,” said Ireland. “It is very difficult to estimate just how much of this material could end up on LkCa 15 b. If the orbit is nearly circular, and there is only one planet, then I believe that only a very small fraction of this matter could end up as part of LkCa 15 b. If I had to guess, I’d say around 10 times the mass of Jupiter for a final mass, with a little orbital migration to a closer orbit. However, we’ll get a better idea on this over the coming years with new theoretical models and after we see more of the orbit of the planet.”
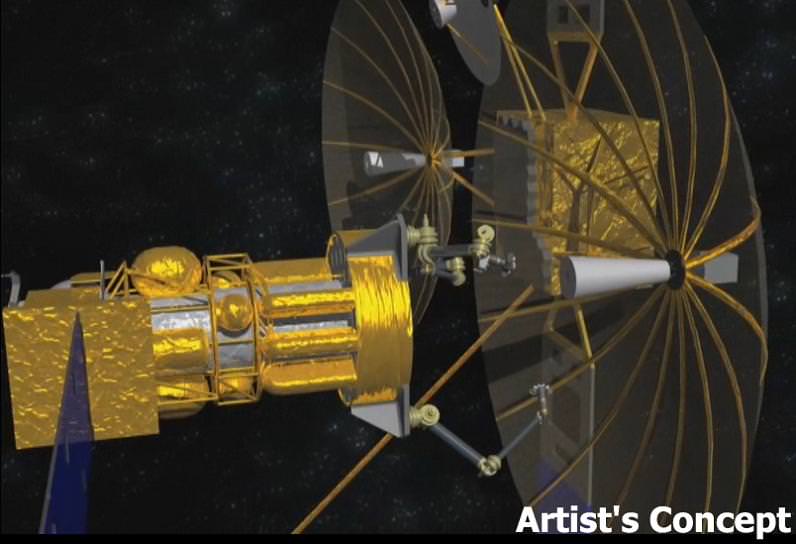
Artist's Concept of Phoenix Mission - Credit: DARPA
[/caption]
It’s the dead zone. Approximately 22,000 miles above the Earth, $300 million worth of retired satellites are simply taking up space in geosynchronous orbit. Like anything a bit elderly, they might have problems, but they’re far from useless. There are a hundred willing volunteers waiting to be retrofitted, and all they need is the wave of a magic wand to come back to life. The DARPA Phoenix program might just be the answer.
Communication satellites in geosynchronous orbit (GEO) enable vital interchanges between warfighters. When one fails, it means an expensive replacement. But what remains isn’t a burned-out shell – it’s still a viable piece of equipment which often contains still usable antennae, solar arrays and other components. The only problem is that we haven’t figured out a way to recycle them. Now DARPA’s Phoenix program is offering an answer by developing the technology necessary to “harvest” these non-working satellites and their working parts. “If this program is successful, space debris becomes space resource,” said DARPA Director, Regina E. Dugan.
However, as easy as the idea might sound, it’s going to take a lot of cooperation from a variety of applied sciences. For example, incorporating the robotics which allows a doctor to perform telesurgery from a remote location to the advanced remote imaging systems used for offshore drilling which views the ocean floor thousands of feet underwater. If this technology could be re-engineered to work at zero gravity, high-vacuum and under an intense radiation environment, it’s entirely possible to re-purpose retired GEO satellites.
“Satellites in GEO are not designed to be disassembled or repaired, so it’s not a matter of simply removing some nuts and bolts,” said David Barnhart, DARPA program manager. “This requires new remote imaging and robotics technology and special tools to grip, cut, and modify complex systems, since existing joints are usually molded or welded. Another challenge is developing new remote operating procedures to hold two parts together so a third robotic ‘hand’ can join them with a third part, such as a fastener, all in zero gravity. For a person operating such robotics, the complexity is similar to trying to assemble via remote control multiple Legos at the same time while looking through a telescope.”
Now enter DARPA’s System F6 – the master satellite. It will host affordable, smaller scale electronics and structural models that provide on-board control. These smaller units will be able to communicate with each other and the master satellite – working together to harness the potential of the retired satellite’s assets. Right now, the Phoenix program is looking for the automation technology for creating a new breed of “satlets,” or nanosatellites. These can be sent into space much more economically through existing commercial satellite launches and then robotically attached to the elderly satellites to create new systems.
Artist Concept of System F6 - Credit: DARPA
System F6 (Future, Fast, Flexible, Fractionated, Free-Flying Spacecraft United by Information Exchange) will be fascinating in itself… a hive of wirelessly-interconnected modules capable of communicating with each other – sharing resources among themselves and utilizing resources found elsewhere within the cluster. “The program is predicated on the development of open interface standards—from the physical wireless link layer through the network protocol stack, including the real-time resource sharing middleware and cluster flight logic—to enable the emergence of a space “global commons” which would enhance the mutual security posture of all participants through interdependence.” says the DARPA team. “A key program goal is the industry-wide promulgation of these open interface standards for the sustainment and development of future fractionated systems.”
Right now the Phoenix program is looking for high tech expertise needed to develop a payload orbital delivery system. The PODS units will be needed to safely house the satlets during launch. The next step is an independent servicing station which will be placed in GEO and connected to PODS. The service module will be home to equipment such as mechanical arms and remote vision systems… the virtual “operating” center to make the DARPA Phoenix program a success.
What did the three astronauts do on the ISS this past week? Here’s an update from NASA on the research and activities on the International Space Station for October 17-21, 2011. Includes updates on the upcoming Progress and Soyuz launches.
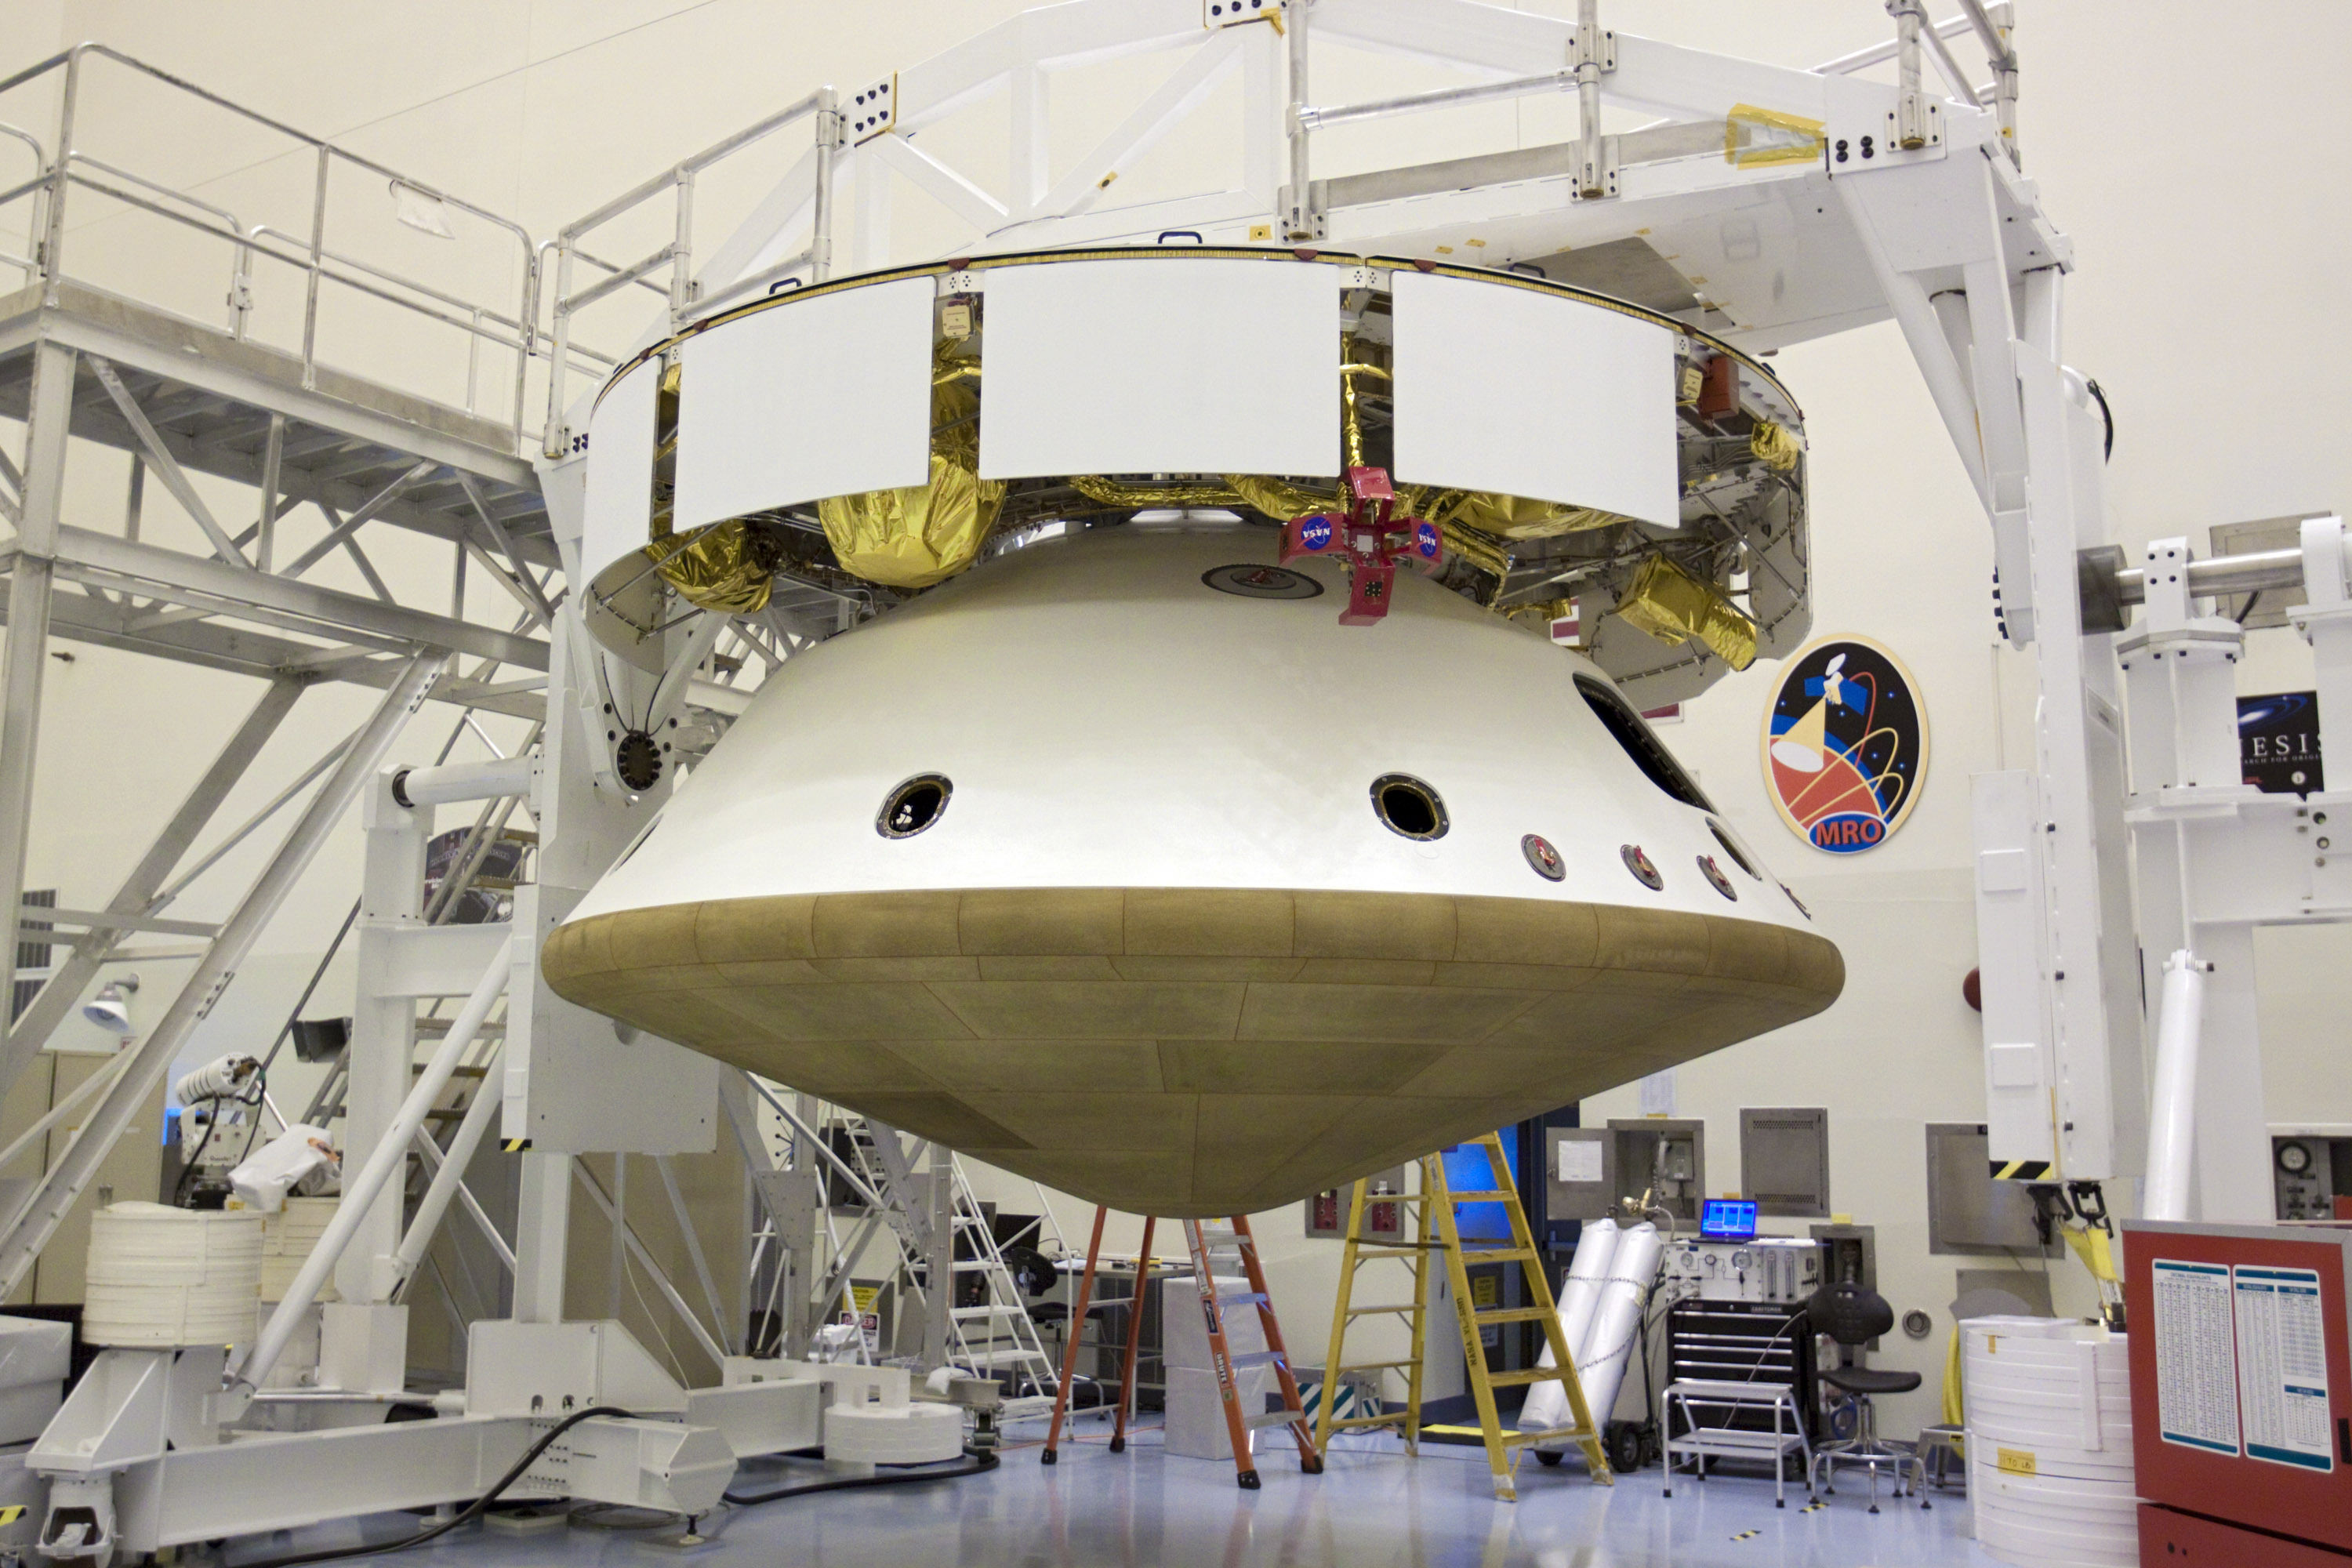
Curiosity Mars Science Laboratory (MSL)- all elements assembled into flight configuration in the Payload Hazardous Servicing Facility at NASA’s Kennedy Space Center in Florida. The top portion is the cruise stage attached to the aeroshell (containing the compact car-sized rover) with the heat shield on the bottom. Launch of MSL aboard a United Launch Alliance Atlas V rocket is scheduled for Nov. 25 from Space Launch Complex 41 on Cape Canaveral Air Force Station in Florida. Credit: NASA/Glenn Benson
[/caption]
Take a good last, long look at the magnificent robot that is Curiosity, because she’s been all buttoned up for her long Martian voyage in search of the ingredients of life. After years of exhaustive work, the most technologically advanced surface robotic rover ever to be sent beyond Earth has been assembled into the flight configuration, a NASA spokesperson informed Universe Today.
The next time Curiosity opens her eyes she will have touched down at the foot of a layered mountain inside the planet’s Gale crater.
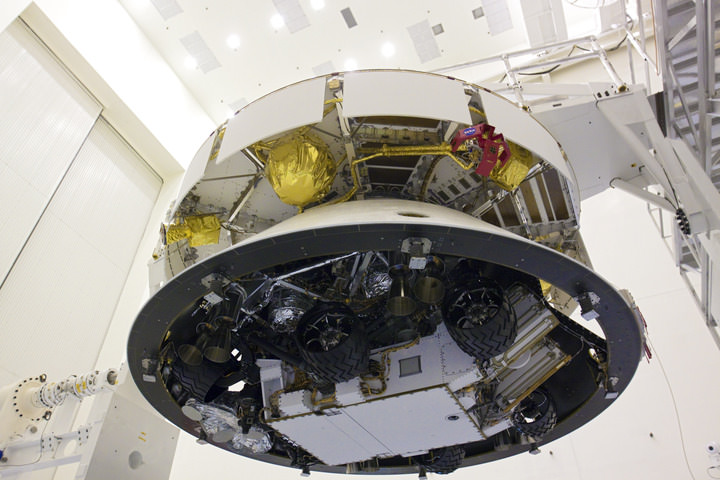
Curiosity Mars rover folded for flight and mated to the cruise stage. The cruise stage provides solar power, thrusters for navigation, and heat exchangers to the rover during its flight from Earth to Mars. Credit: NASA/Glenn Benson
Curiosity – NASA’s next Mars rover – is formally known as the Mars Science Laboratory (or MSL) and has entered the final stages of preflight processing.
After extensive quality assurance testing, Curiosity has been encapsulated for the final time inside the aeroshell that will be her home during the 10 month long interplanetary cruise to Mars. Furthermore, she’s been attached to the cruise stage that will guide her along the path from the home planet to the red planet.
Curiosity Mars Science Laboratory (MSL) assembled into flight configuration in the Payload Hazardous Servicing Facility at NASA’s Kennedy Space Center in Florida. The rover Curiosity has 10 science instruments designed to search for evidence on whether Mars has had environments favorable to microbial life, including chemical ingredients for life. Credit: NASA/Glenn Benson
The work to combine all the components into an integrated assembly was carried out inside the clean room facilities of the Payload Hazardous Servicing Facility at NASA’s Kennedy Space Center (KSC) in Florida.
The aeroshell is comprised of the heat shield and back shell.
The job of the aeroshell is to protect Curiosity from the intense heat of several thousand degrees F(C) generated by friction as the delicate assemblage smashes into the Martian atmosphere at about 13,200 MPH (5900 m/s) and plummets some 81 miles during the terrifying seven minute long entry, descent and landing (EDL) on the surface.
The massive 2000 lb (900 kg) rover is folded up and mated to the back shell powered descent vehicle, known as the PDV or Sky Crane. The spacecraft is designed to steer itself through a series of S-curve maneuvers to slow the spacecraft’s descent through the Martian atmosphere.
In the final moments, the rocket powered Sky crane will lower the robot on tethers and then safely set Curiosity down onto the ground at a precise location inside the chosen landing site astride a layered mountain in Gale Crater believed to contain phyllosilicate clays and hydrated sulfate minerals that formed in liquid water.
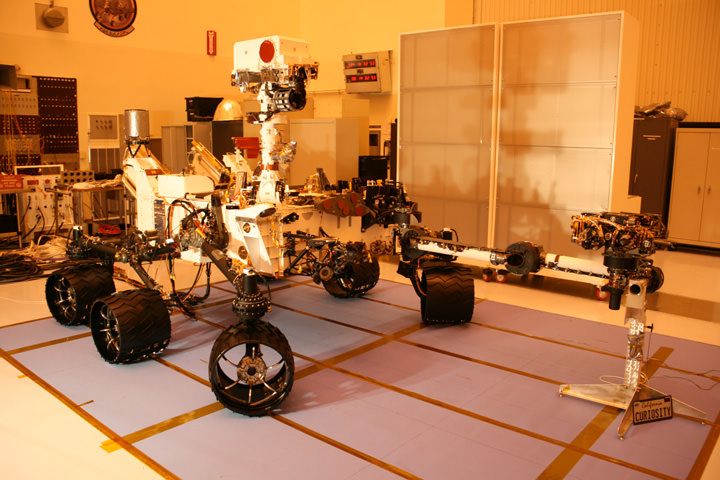
The robot is the size of a compact car and measures three meters in length, roughly twice the size of the MER rovers; Spirit and Opportunity. It is equipped with 10 science instruments for a minimum two year expedition across Gale crater.
NASA's Curiosity Mars Science Laboratory Rover
Inside the Clean room at the Payload Hazardous Servicing Facility at the Kennedy Space Center.
The science payload weighs ten times more than any prior Mars rover mission. Curiosity will zap rocks with a laser and deftly maneuver her outstretched robotic arm to retrieve and analyze dozens of Martian soil samples. Credit: Ken Kremer
Curiosity will search for the ingredients of life including water and organic molecules and environmental conditions that could have been hospitable to sustaining Martian microbial life forms if they ever existed in the past or survived to the present through dramatic alterations in Mars climatic and geologic history.
Liftoff of the $2.5 Billion Curiosity rover is slated for Nov. 25 from Cape Canaveral Air Force Station in Florida on a United Launch Alliance Atlas V booster rocket. The launch window to Mars extends until Dec. 18.
This coming week, Curiosity will be encapsulated into the clamshell like payload fairing and the MSL logo will then be applied to the fairing, KSC spokesman George Diller told Universe Today. It will then be hoisted onto the payload transporter and carefully conveyed to Space Launch Complex 41 on Nov. 2, for mating atop the Atlas V rocket.
Mars Science Laboratory Aeroshell with Curiosity enclosed inside. Credit: NASA
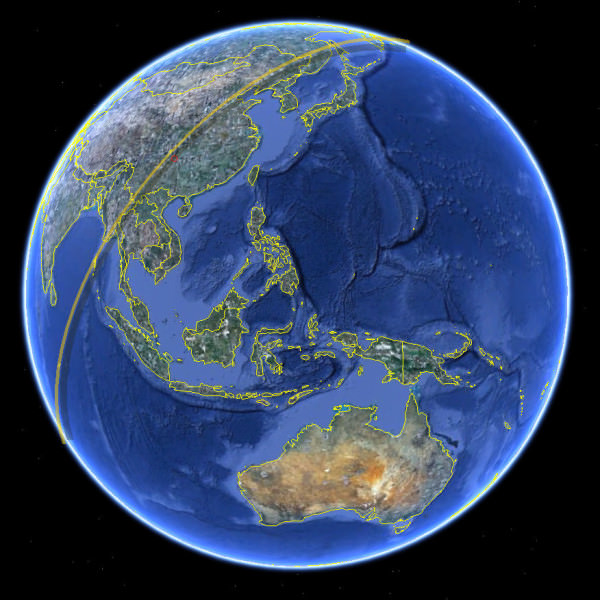
Initial reports said ROSAT fell sometime during this track. Credit: DLR and ROSAT_Reentry Twitter.
[/caption]
It’s official: the ROSAT satellite has come down. The Deutsches Zentrum für Luft- und Raumfahrt (DLR), the German Space Agency confirmed the satellite plunged to Earth sometime between 1:45 UTC and 2:15 UTC on Oct. 23, 2011 (between 8:45 and 9:15 EDT Oct. 22) There is currently no confirmation if pieces of debris have reached Earth’s surface.
Update: US Strategic Command estimates an entry time of 1:50 UTC +/- 7 Minutes. This entry time would put the satellite in the Indian Ocean, and not over China as reported below. The DLR said that after further analysis they should be able to provide more information about exactly where the debris hit.
The @ROSAT_Reentry Twitter feed posted the picture above, indicating the satellite’s fall occurred sometime during the groundtrack shown.
Other reports via Twitter from skywatchers around the world had no sightings of any lit debris falling, or any actual sightings of the satellite passing overhead since 23:30 UTC on Oct. 22. Some news reports say it could have re-entered over China, but it likely didn’t make it as far as Korea or Japan.
We’ll provide more information when it becomes available.
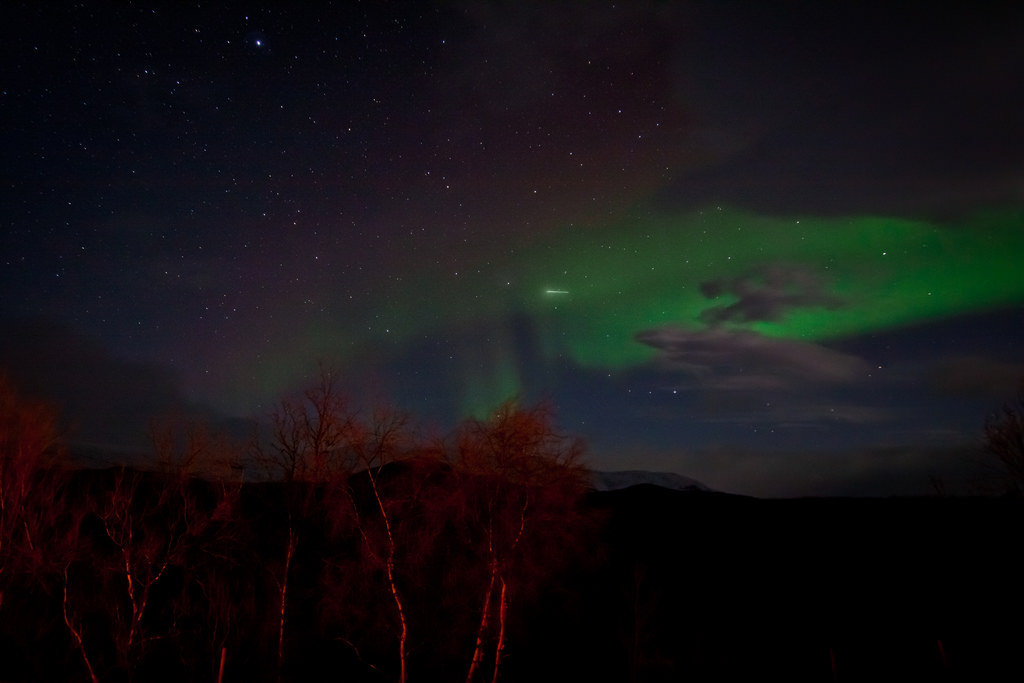
Photo of the northern lights over northern Norway by Adon Buckley.
[/caption]
A meteor slices through the glow of the northern lights (or “Nordlys”) in this photo by Adon Buckley, taken near the border of Norway and Finland on the night of October 19, 2011.
“The weather was against us, it was raining heavily in the northern Norwegian town of Tromsø,” Adon describes on his Flickr page. “We drove for 2 hours and waited on the Norwegian/Finish border for 3 more and this was at the start of the show on October 19th.”
He adds, “I actually missed the shooting star when it happened, but my friend told me and I was eager to check the exposure when I got home.”
Superconductivity and magnetic fields are like oil and water… they don’t mix. When it can, the superconductor will push out any magnetic fields from the interior in a process called the Meissner effect. It happens when a sample is cooled below its superconducting transition temperature, where it then cancels out its magnetic flux. What’s next? A superconductor. Now the fun really begins… Continue reading “Quantum Levitation And The Superconductor”
A Green Pea galaxy - which may be an local analogue of the univere's first galaxies. Credit: Galaxy Zoo/SDS.
[/caption]
The ground-breaking discovery of a new class of galaxies, Green Peas, in 2009 by a group of Galaxy Zoo volunteers – have recently been followed up by further observations in the radio spectrum.
The Green Peas were first identified from Sloane Digital Sky Survey data – and then in Hubble Space Telescope archive images. Now radio observations of Green Pea galaxies (from GMRT and VLA) have led to some new speculation on the role of magnetic fields in early galaxy formation.
Green Pea galaxies were so named from their appearance as small green blobs in Galaxy Zoo images. They are low mass galaxies, with low metallicity and high star formation rates – but, surprisingly, are not all that far away. This is surprising given that their low metallicity means they are young – and being not very far away means they formed fairly recently (in universal timeframe terms).
Most nearby galaxies reflect the 13.7 billion year old age of the universe and have high metallicity resulting from generations of stars building elements heavier than hydrogen and helium through fusion reactions.
But Green Peas do seem to have formed from largely unsullied clouds of hydrogen and helium that have somehow remained unsullied for much of the universe’s lifetime. And so, Green Peas may represent a close analogue of what the universe’s first galaxies were like.
Their green color comes from strong OIII (ionised oxygen) emission lines (a common consequence of lots of new star formation) within a redshift (z) range around 0.2. A redshift of 0.2 means we see these galaxies as they were when the universe was about 2.4 billion years younger (according to Ned Wright’s cosmology calculator). Equivalent early universe galaxies are most luminous in ultraviolet at a redshift (z) between 2 and 5 – when the universe was between 10 and 12 billion years younger than today.
Spectroscopic data from Green Pea galaxy 587739506616631548 - demonstrating the prominent OIII emission lines which are characteristic of Green Pea galaxies. Credit: Galaxy Zoo.
Anyhow, studying Green Peas in radio has yielded some interesting new features of these galaxies.
With the notable exception of Seyfert galaxies, where the radio output is dominated by emission from supermassive black holes, the bulk radio emission from most galaxies is a result of new star formation, as well as synchrotron radiation arising from magnetic fields within the galaxy.
Based on a number of assumptions, Chakraborti et al are confident they have discovered that Green Peas have relatively powerful magnetic fields. This is surprising given their youth and smaller size – with magnetic field strengths of around 30 microGauss, compared with the Milky Way’s approximately 5 microGauss.
They do not offer a model to explain the development of Green Pea magnetic fields, beyond suggesting that turbulence is a likely underlying factor. Nonetheless, they do suggest that the strong magnetic fields of Green Peas may explain their unusually high rate of star formation – and that this finding suggests that the same processes existed in some of the first galaxies to appear in our 13.7 billion year old universe.
This video created with data from the Solar Dynamics Observatory is just absolutely and astoundingly beautiful, showing magnetic loops on the Sun earlier today (October 22, 2011). Via @TheSunToday Twitter feed, just watch how the magnetic loops jump, shimmer and coil back into the Sun, following a long duration M1 flare at about 1100 UTC.