German ROSAT Satelite Heading Towards Uncontrolled Re-Entry to Earth

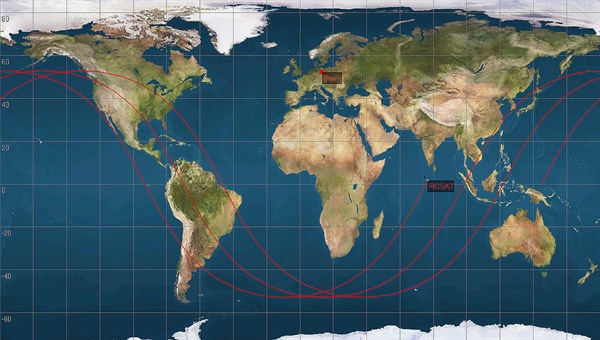
A sample of 3 consecutive ROSAT orbits. Credit: DLR

[/caption]

Here we go again: A satellite without a propulsion system is set to crash to Earth later this month, and officials can’t predict exactly when or where it will fall. This is not the second coming of NASA’s UARS (Upper Atmosphere Research Satellite) but a German X-Ray observatory named ROSAT (ROentgen SATellite), which will likely plummet through Earth’s atmosphere sometime between October 20 and 25, plus or minus 3 days.

Due to fluctuations in solar activity, “the time and location of re-entry cannot be predicted precisely,” the German Aerospace Center (DLR) said in a statement on their website.

Coming in at about 28,000 kilometers (17,000 miles) per hour, DLR said the satellite will break up into fragments, with possibly up to 30 individual pieces weighing a total of 1.7 tons reaching the surface of the Earth. The largest single fragment will probably be the telescope’s mirror, which is very heat resistant and weighs about 1.7 tons.

German officials said there is a 1-in-2,000 chance that debris from the satellite could hit a person on Earth, and added the chance any a German citizen would be hit about 1 in 700,000. They did not include the odds of any one specific person on Earth getting hit by debris, but for the UARS satellite, it was estimated at about 1 in 21 trillion.

Like the UARS satellite, ROSAT’s orbital track takes it over much of Earth’s oceans.
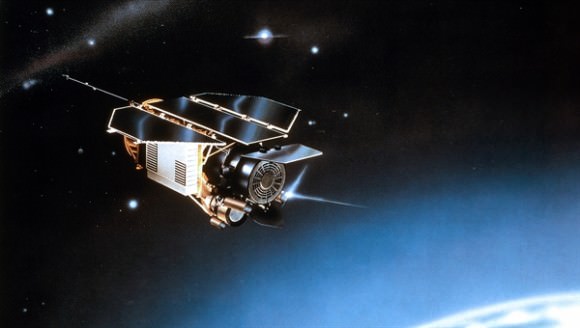
An artist's impression of ROSAT in orbit. Credit: DLR

ROSAT is about the size of a car, and during its mission was in an elliptical orbit at distances of between 585 and 565 kilometers above the surface of the Earth. It was decommissioned in 1999, and since that time, atmospheric drag has caused the satellite to lose altitude. In June 2011, it was at a distance of only about 327 kilometers above the ground.

Since ROSAT does not have a propulsion system on board, it is not possible to maneuver the satellite to perform a controlled re-entry. ROSAT’s orbit extends to 53 degrees north and south latitudes, and all areas in that region could be affected by its re-entry. The bulk of the debris will impact near the ground track of the satellite. However, isolated fragments could fall to Earth in an 80-kilometer wide path along the track.

DLR will provide updates to predict the moment of re-entry as accurately as possible. During the re-entry phase of the satellite, German scientists will be evaluating data from the US Space Surveillance Network (SSN). In addition, the Tracking and Imaging Radar (TIRA), the large radar facility at the Fraunhofer Institute for High-Frequency Physics and Radar Techniques in Wachtberg near Bonn will be monitoring the descent of the X-ray satellite to further improve calculations of its trajectory.

Last month, the bus-sized 6-ton UARS satellite that hurtled uncontrolled toward Earth and plunged into the Pacific Ocean without causing any problems.

Source: DLR

Free Range Brown Dwarfs

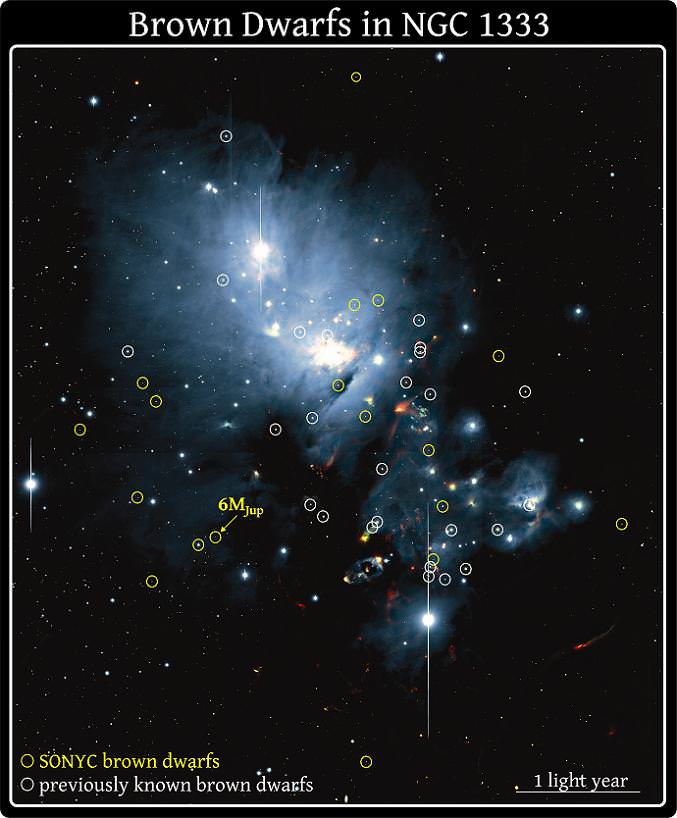
Brown dwarfs in the young star cluster NGC 1333. This photograph combines optical and infrared images taken with the Subaru Telescope. Brown dwarfs newly identified by the SONYC Survey are circled in yellow, while previously known brown dwarfs are circled in white. The arrow points to the least massive brown dwarf known in NGC 1333; it is only about six times heftier than Jupiter. Credit: SONYC Team/Subaru Telescope

[/caption]

Using two of the world’s largest optical-infrared telescopes, the Subaru Telescope in Hawaii and the Very Large Telescope (VLT) in Chile, an international team of astronomers has discovered more than two dozen brown dwarf stars floating around in two galactic clusters. During the Substellar Objects in Nearby Young Clusters (SONYC) survey, these “failed stars” came to their attention by showing up in extremely deep images of the NGC 1333 and rho Ophiuchi star clusters at both optical and infrared wavelengths. To make the findings even more exciting, these stellar curiosities outnumbered the “normal” stars in one cluster!

“Our findings suggest once again that objects not much bigger than Jupiter could form the same way as stars do. In other words, nature appears to have more than one trick up its sleeve for producing planetary mass objects,” says Professor Ray Jayawardhana, Canada Research Chair in Observational Astrophysics at the University of Toronto and leader of the international team. Their discovery will be published in two upcoming papers in the Astrophysical Journal and will be presented this week at a scientific conference in Garching, Germany.

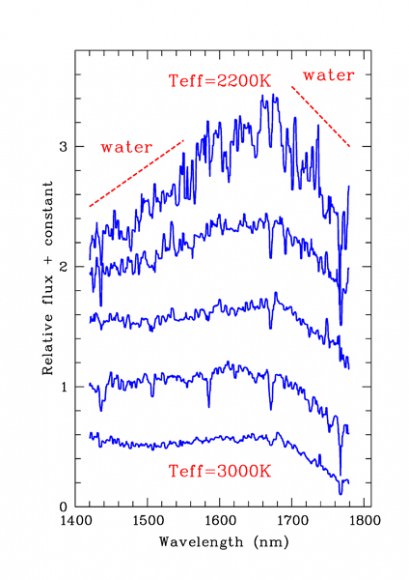
Spectra of several brown dwarfs in the young star cluster NGC1333, taken with the FMOS instrument on the Subaru Telescope. The spectra show a characteristic peak around 1670nm. Water steam in a brown dwarf's atmosphere absorbs radiation on both sides of the peak. The plot shows that the strength of the water absorption increases in cooler objects (from 3000 to 2200K). FMOS allows astronomers to take spectra for many objects simultaneously, a crucial advantage for the SONYC Survey. Credit: SONYC Team/Subaru Telescope

Using spectroscopy, the researchers were able to separate candidate brown dwarfs by their red color. But there’s more to the story than just hues. In this case, it’s the identification of one that’s only about six times more massive than Jupiter. Located in NGC 1333, it is the smallest known free-floating object to date. What does that mean? “Its mass is comparable to those of giant planets, yet it doesn’t circle a star. How it formed is a mystery,” said Aleks Scholz of the Dublin Institute for Advanced Studies in Ireland, lead author of the first paper.

Brown dwarfs are indeed unusual. They walk a fine line between planet and star – and may have once been in stellar orbit, only to be ejected at some point in time. But in this circumstance, all of the brown dwarfs found in this particular cluster have very low mass – only about twenty times that of Jupiter. “Brown dwarfs seem to be more common in NGC 1333 than in other young star clusters. That difference may be hinting at how different environmental conditions affect their formation,” said Koraljka Muzic of the University of Toronto in Canada, lead author of the second paper.

“We could not have made these exciting discoveries if not for the remarkable capabilities of Subaru and the VLT. Instruments that can image large patches of the sky and take hundreds of spectra at once are key to our success,” said Motohide Tamura of the National Astronomical Observatory of Japan.

Free-range brown dwarfs? I’ll take mine over easy…

Original Story Source: Subaru Telescope News.

Astronomy Cast Ep. 234: Lunar Phases

The Moon is a stark reminder that we actually live in a Universe filled with stars and planets and moons. The changing phases of the Moon show us the relative positions of the Earth, the Sun and the Moon as they interact with one another. Let’s learn about the different phases, the geometry of the whole system, and some of the interesting science wrapped up with our fascination of our only natural satellite.

Click here to download the episode.

Or subscribe to: astronomycast.com/podcast.xml with your podcatching software.

“Lunar Phases” on the Astronomy Cast website.

Carnival of Space #218

This week’s Carnival of Space is hosted by Peter Lake at the Aartscope Blog

Click here to read the Carnival of Space #218

And if you’re interested in looking back, here’s an archive to all the past Carnivals of Space. If you’ve got a space-related blog, you should really join the carnival. Just email an entry to [email protected], and the next host will link to it. It will help get awareness out there about your writing, help you meet others in the space community – and community is what blogging is all about. And if you really want to help out, sign up to be a host. Send and email to the above address.

Life In A Slice Of Ice

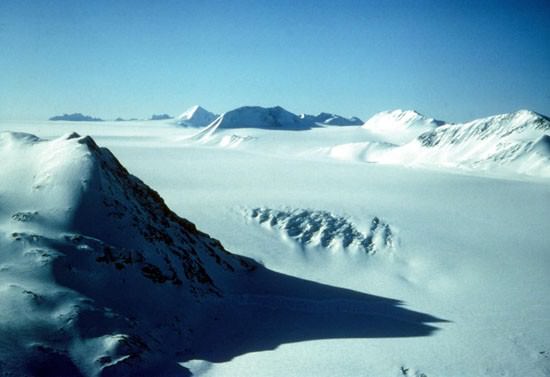
Image of the Harding Ice Field on Alaska’s Kenai Peninsula. Credit: US Fish and Wildlife Service

[/caption]

Thanks to a grant from the National Science Foundation, a University of Washington doctoral student named Adam Campbell has been conducting a research on photosynthetic algae. While this simple, light-loving form of life might not seem very important, it very well could have survived the global ice age by hiding in an area similar to the Red Sea.

“Under those frigid conditions, there are not a lot of places where you would expect liquid water and light to occur in the same area, and you need both of those things for photosynthetic algae to survive,” said Campbell.

How could this slice of ice endure against the massive force of a glacier? If there was a thin body of water about six and half times longer than it was wide, it would be possible for it to create enough physical resistance to stop a moving ice sheet. Chances are good that the ice would vaporize before it reached the end of the sea. This means at least enough open water for algae to survive.

“The initial results have shown pretty well that these kinds of channels could remain relatively free of thick glacial ice during a ‘snowball Earth’ event,” Campbell elucidates.

Through the use of an analytical model that simulates environmental conditions theorized to exist somewhere between 800 million and 550 million years ago, Campbell and his team of Edwin Waddington and Stephen Warren, UW professors of Earth and space sciences, were able to simulate ten million years of deep freeze. Their timeline began before the Cambrian explosion about 530 million years ago when Earth quickly changed tactics and became more heterogeneous. However, simple photosynthetic plankton have made their presence known in the records both before and after this studied time period… a presence which made scientists wonder how it could happen if the Earth had been totally covered in ice.

Campbell said it is assumed the algae survived these episodes, “unless they re-evolved each time, which creates a whole different problem for evolutionary biology.”

Why chose the Red Sea as an example? Quite simply put, because it’s perfect. It formed from a tectonic process called continental rifting, existed in the right time line and was correctly globally positioned. Campbell also noted that in a snowball Earth event, the exposed sea would have quickly evaporated if there weren’t a method of refill – such as created by a dam of glacial ice. Just a small amount… like enough to last 10 million years for the algae to take hold.

“Over 10 million years, you could evaporate the deepest lake in the world,” Campbell said. “If you’re in a desert, you’d have to have a supply of sea water.”

Original Story Source: University of Washington News.

Former Space Shuttle Manager Mike Moses Joins Virgin Galactic

Shuttle Program Integration Manager Mike Moses. Image: Nancy Atkinson

[/caption]

One of the most respected members of NASA’s space shuttle program has joined Virgin Galactic as the commercial space company’s Vice President of Operations. Mike Moses, NASA’s former Space Shuttle Launch Integration Manager, will oversee the planning and execution of all operations at Virgin Galactic’s headquarters at Spaceport America in New Mexico. In a press release, the company said Moses will develop and lead the team responsible for Virgin Galactic spaceship operations and logistics, flight crew operations, customer training, and spaceport ground operations, with overall operational safety and risk management as the primary focus.

“I am extremely excited to be joining Virgin Galactic at this time,” Moses said, “helping to forge the foundations that will enable routine commercial suborbital spaceflights. Virgin Galactic will expand the legacy of human spaceflight beyond traditional government programs into the world’s first privately funded commercial spaceline.”

Moses talked with Irene Klotz at Reuters and said he thinks the direction NASA is taking is good, but he wants to be where the action is.

“I’m more than onboard with NASA’s plan,” Moses told Reuters. “It’s just that the operations of that system were still eight to 10 years away. I couldn’t just push paper around and write requirements for the next 10 years so I’m going to take another shot at it here in the commercial sector.”

Moses served as the Launch Integration Manager from 2008 until the landing of the final Shuttle mission in July 2011. He was responsible for supervising all Space Shuttle processing activities from landing through launch, and for reviewing major milestones including final readiness for flight.

Moses was part of the team that made regular appearances at launch briefings at Kennedy Space Center and was a media favorite for his no-nonsense, but congenial and sometimes humorous answers to questions. Along with Shuttle Launch Director Mike Leinbach, “The Two Mikes” were responsible for providing ultimate launch decision authority during the final years of the space shuttle program.

Moses also served as chair of the Mission Management Team, making decisions for the final 12 space shuttle flights, and directly overseeing the safe and successful flights of 75 astronauts.

“Bringing Mike in to lead the team represents a significant investment in our commitment to operational safety and success as we prepare to launch commercial operations,” said Virgin Galactic President and CEO George Whitesides. “His experience and track record in all facets of spaceflight operations are truly unique. His forward-thinking perspective to bring the hard-won lessons of human spaceflight into our operations will benefit us tremendously.”

Prior to his most recent NASA role, Moses served as a Flight Director at the NASA Johnson Space Center where he led teams of flight controllers in the planning, training and execution of all aspects of space shuttle missions. Before being selected as a Flight Director in 2005, Moses had over 10 years experience as a flight controller in the Shuttle Propulsion and Electrical Systems Groups.

Sources: Virgin Galactic, Reuters

Why is Tonight’s Full Moon the Smallest of the Year?

Moon at Perigee and Apogee. Credit NASA

[/caption]
Think we can only see half of the Moon’s surface from Earth? Not always.

Over the course of the year, observers on Earth can view a bit less and a bit more than half of the lunar surface. Additionally, the Moon appears smaller in the sky during some months compared to other times of the year.

Due to the processes at work, tonight’s full Moon is an opposite of the “Supermoon” that made headlines earlier this year.

What causes our Moon to change apparent size throughout the year, and how do we notice this phenomenon?

While it would be difficult to judge the apparent size of the full Moon each month with our eyes, the phenomenon of Lunar librations is readily apparent in the animation below.

There are three forces at work that help produce the “dancing” effect as shown in the video above.

There are three types of lunar libration:

First, the Moon doesn’t orbit Earth in a perfectly circular orbit. An eccentric orbit will cause our Moon to lead and lag in its orbital position while its rotational speed stays the same. This causes a libration in longitude.

Secondly, the Moon’s rotational axis is slightly inclined to its orbital plane, with respect to Earth. The Moon’s orbit is also inclined with respect to the ecliptic, allowing the Moon to be illuminated from above and sometimes from below. The illumination from above and below allows some of the lunar surface beyond the poles to be visible from Earth.

Last but not least, there is a small daily oscillation due to Earth’s rotation. This oscillation changes the perspective at which an observer views the Moon. Imagine a straight line connecting the center of Earth with the center of the Moon. Over time an observer would be on one side of this imaginary line and then the other, which would allow the observer to look first around one side of the Moon and then around the other. This is because an observer on Earth is on the surface and not at the center of Earth.

A slight bit of Lunar trivia: Lunar librations helped notable British astronomer Patrick Moore investigate the edge regions where librations provided extra coverage. Moore’s investigations lead him to discover a large circular feature, which he named “Mare Oriental”. Once studies of the Lunar farside were performed from space, it was discovered that Mare Oriental was a lava filled impact crater.

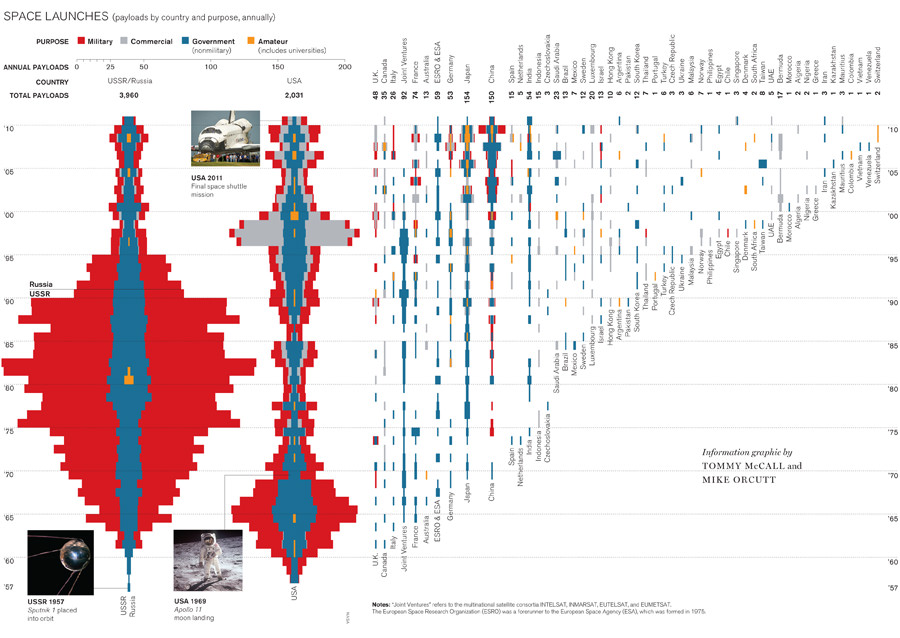
Infographic: Space Launches Over Time

Space launches over time. Credit: Tommy McCall and Mike Orcutt, via Technology Review Blog.

[/caption]

For people who erroneously believe that the end of the space shuttle program means the end of space exploration for the human race, this graphic should provide a little perspective. According to the data compiled here, human missions funded by the U.S. government have represented only a small part of the launches into space. And interestingly, the data creates nice Star Wars battle cruiser-like shapes for US and Russian launches!

Of the 7,000 spacecraft that have been launched into orbit or beyond from 1957 to July 2011, more than half were defense satellites used for communication, ­navigation, and imaging. Reportedly, the USSR sent up a huge number of satellites because their satellites didn’t last as long as those launched b the Us. In the 1970s, private companies began increasingly adding to the mix, ­launching satellites for telecommunications and broadcasting.

This graphic groups payloads by the nationality of the owner. A satellite, a capsule of cosmonauts, or a deep-space probe would each count as one payload. The data were drawn from hundreds of sources, including space agency documents, academic journals, and interviews. They were compiled by Jonathan ­McDowell, an ­astrophysicist at the Harvard-­Smithsonian Center for Astrophysics and author of Jonathan’s Space Report, a newsletter that tracks launches.

This graphic is available through a limited-time free access to premium content of Technology Review, who have opened 14 years of premium online content to celebrate their annual Emtech MIT event. Hurry, the limited access ends on October 19, 2011. You can download a pdf of the graphic here through that date.

Source: Technology Review

Earth Vs. Stuff from the Sun

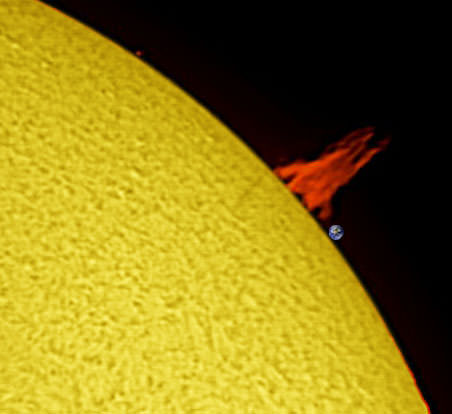
Compare the size of Eath to a prominence on the Sun on October 10, 2011. Credit: Ron Cottrell

[/caption]

The Sun is big. And comparatively, Earth is a tiny Lilliputian. We’ve all seen images comparing the size of Earth to the Sun, but here are two images from October 10, 2011 that really bring home the size-scale of features on the Sun when compared to the size of Earth. Amateur astronomer Ron Cottrell from Oro Valley, Arizona took these images of two different features on the the Sun yesterday, overlaying the size of the Earth for reference. Both are viewed in Hydrogen- Alpha light, and the first is a fiery-looking huge prominence from the northwest limb of the Sun. Yikes!

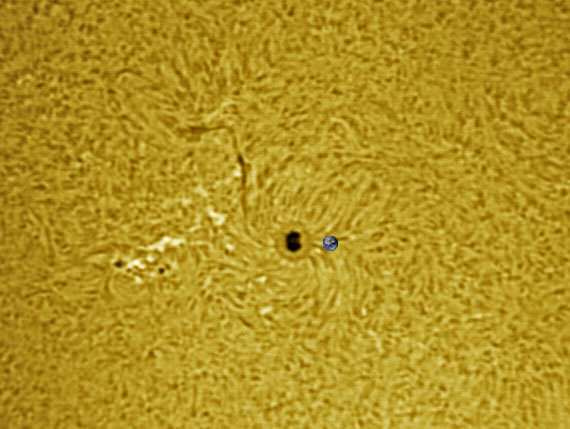
Below, see a comparison of Earth to a current sunspot:

The Earth compared to Sunspot 1312 on 10-10-11. Credit: Ron Cottrell.

This is sunspot 1312 which has a classic sunspot shape with a core a that’s larger than the Earth.

Ron used a 40mm Coronado telescope and a webcam to capture the images. He explains the colors of the Sun in Hydrogen-Alpha, and in particular why the prominence appears fiery red:

“The red color of the prominence is very close to the color collected in the image. The yellow disk is enhanced. I actually capture the disk image in black and white and add the color. I can choose any color. The final image is a composite of two separate images. Prominences are, in general, much fainter than the bright disk. Therefore, the prominence image is captured at a slower shutter speed, e.g. 1/25 sec, compared to the disk image captured at 1/100 sec. The two images are combined in PhotoShop.”

You can see more of Ron’s handiwork on his Flickr page.

And speaking of the Sun, activity on our closest star has been ramping up and last week a series of active regions were lined up one after the other across the upper half of the Sun. Interestingly, the Solar Dynamics Observatory was able to capture how these regions twisted and interacted with each other. The video shows activity from Sept. 28 – Oct. 2, 2011, as seen in extreme UV light. The magnetically intense active regions sported coils of arcing loops and numerous times these magnetic field lines above them can be seen connecting with the active region next door. Towards the end of the clip, a leading active region blasted out a coronal mass ejection, quickly succeeded by a blast from another active region. The disruption of the magnetic field from one likely triggered the second, a phenomenon that has been observed before by SDO.

New YouTube Space Station Experiment Contest

What’s a good way to generate excitement around the whole world for the International Space Station? Create a contest for kids from anywhere on the planet to have their idea for a science experiment performed by astronauts on the space station, with it live-streamed back to Earth. YouTube SpaceLab is an open competition inviting 14 – 18 year olds to come up with an idea for a science experiment for space. You don’t have to actually do the experiment, you just have to make a 2-minute video of yourself explaining it.

The tagline for this contest is “Your experiment, 250 miles above the Earth, for the whole world to see,” and this should be a really fun and engaging world-wide contest that is sure to generate a lot of interest.
Continue reading “New YouTube Space Station Experiment Contest”