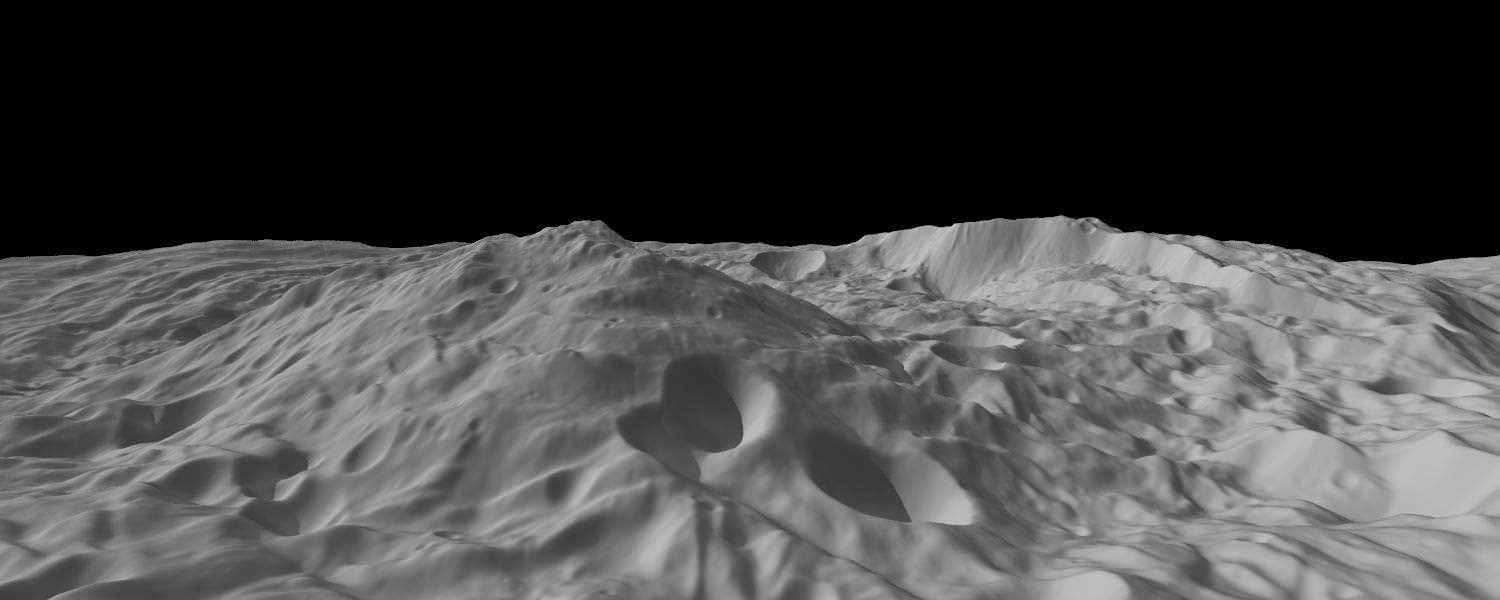
Something New On the Sun: SDO Spots a Late Phase in Solar Flares

Instead of a conventional picture, the EUV variability Experiment (EVE) on board SDO produces graphs like this, called spectra, that show the total intensity of any given extreme ultraviolet (EUV) wavelength of light coming off of the sun. This image shows a single moment from May 5, 2010. Instead of a conventional picture, the EUV variability Experiment (EVE) on board SDO produces graphs like this, called spectra, that show the total intensity of any given extreme ultraviolet (EUV) wavelength of light coming off of the sun. This image shows a single moment from May 5, 2010. The height of each vertical line represents how much energy is present in that particular wavelength. Spectra like this can measure energy from the sun more comprehensively than instruments that can only “see” a single wavelength. Credit: NASA/SDO/EVE

From a NASA press release:

The Sun’s surface dances. Giant loops of magnetized solar material burst up, twist, and fall back down. Some erupt, shooting radiation flares and particles out into space. Forced to observe this dance from afar, scientists use all the tools at their disposal to look for patterns and connections to discover what causes these great explosions. Mapping these patterns could help scientists predict the onset of space weather that bursts toward Earth from the Sun, interfering with communications and Global Positioning System (GPS) signals.

Analysis of 191 solar flares since May 2010 by NASA’s Solar Dynamics Observatory (SDO) has recently shown a new piece in the pattern: some 15 percent of the flares have a distinct “late phase flare” some minutes to hours later that has never before been fully observed. This late phase of the flare pumps much more energy out into space than previously realized.

“We’re starting to see all sorts of new things,” says Phil Chamberlin, deputy project scientist for SDO at NASA’s Goddard Space Flight Center in Greenbelt, Md. “We see a large increase in emissions a half-hour to several hours later, that is sometimes even larger than the original, traditional phases of the flare. In one case on November 3, 2010, measuring only the effects of the main flare would mean underestimating the amount of energy shooting into Earth’s atmosphere by 70 percent.”

The entire space weather system, from the Sun’s surface to the outer edges of the solar system, is dependent on how energy transfers from one event to another – magnetic reconnection near the Sun transferred to movement energy barreling across space to energy deposited into Earth’s atmosphere, for example. Better understanding of this late phase flare will help scientists quantify just how much energy is produced when the sun erupts.

The team found evidence for these late phases when SDO first began collecting data in May of 2010 and the Sun decided to put on a show. In that very first week, in the midst of an otherwise fairly quiet time for the sun, there sprouted some nine flares of varying sizes. Flare sizes are divided into categories, named A, B, C, M and X, that have long been defined by the intensity of the X-rays emitted at the flare’s peak as measured by the GOES (Geostationary Operational Environmental Satellite) satellite system. GOES is a NOAA-operated network of satellites that has been in geosynchronous orbit near Earth since 1976. One of the GOES satellites measures only X-ray emissions and is a crucial source of information on space weather that the sun sends our way.

That May 2010, however, SDO observed those flares with its multi-wavelength vision. It recorded data indicating that some other wavelengths of light weren’t behaving in sync with the X-rays, but peaked at other times.

“For decades, our standard for flares has been to watch the x-rays and see when they peak,” says Tom Woods, a space scientist at the University of Colorado, Boulder, Colo. who is first author on a paper on this subject that goes online September 7 in the Astrophysical Journal. “That’s our definition for when a flare goes off. But we were seeing peaks that didn’t correspond to the X-rays.” Woods says that at first they were worried the data were an anomaly or a glitch in the instruments. But as they confirmed the data with other instruments and watched the patterns repeat over many months, they began to trust what they were seeing. “And then we got excited,” he says.

Over the course of a year, the team used the EVE (for Extreme ultraviolet Variability Experiment) instrument on SDO to record data from many more flares. EVE doesn’t snap conventional images. Woods is the principal investigator for the EVE instrument and he explains that it collects all the light from the sun at once and then precisely separates each wavelength of light and measures its intensity. This doesn’t produce pretty pictures the way other instruments on SDO do, but it provides graphs that map out how each wavelength of light gets stronger, peaks, and diminishes over time. EVE collects this data every 10 seconds, a rate guaranteed to provide brand new information about how the sun changes, given that previous instruments only measured such information every hour and a half or didn’t look at all the wavelengths simultaneously – not nearly enough information to get a complete picture of the heating and cooling of the flare.

[/caption]

Recording extreme ultraviolet light, the EVE spectra showed four phases in an average flare’s lifetime. The first three have been observed and are well established. (Though EVE was able to measure and quantify them over a wide range of light wavelengths better than has ever been done.) The first phase is the hard X-ray impulsive phase, in which highly energetic particles in the sun’s atmosphere rain down toward the sun’s surface after an explosive event in the atmosphere known as magnetic reconnection. They fall freely for some seconds to minutes until they hit the denser lower atmosphere, and then the second phase, the gradual phase, begins. Over the course of minutes to hours, the solar material, called plasma, is heated and explodes back up, tracing its way along giant magnetic loops, filling the loops with plasma. This process sends off so much light and radiation that it can be compared to millions of hydrogen bombs.

The third phase is characterized by the Sun’s atmosphere — the corona –losing brightness, and so is known as the coronal dimming phase. This is often associated with what’s known as a coronal mass ejection, in which a great cloud of plasma erupts off the surface of the Sun.

But the fourth phase, the late phase flare, spotted by EVE was new. Anywhere from one to five hours later for several of the flares, they saw a second peak of warm coronal material that didn’t correspond to another X-ray burst.

“Many observations have spotted an increased extreme ultraviolet peak just seconds to minutes after the main phase of the flare, and this behavior is considered a normal part of the flare process. But this late phase is different,” says Goddard’s Chamberlin, who is also a co-author on the paper. “These emissions happen substantially later. And it happens after the main flare exhibits that initial peak.”

To try to understand what was happening, the team looked at the images collected from SDO’s Advanced Imaging Assembly (AIA) as well. They could see the main phase flare eruption in the images and also noticed a second set of coronal loops far above the original flare site. These extra loops were longer and become brighter later than the original set (or the post-flare loops that appeared just minutes after that). These loops were also physically set apart from those earlier ones.

“The intensity we’re recording in those late phase flares is usually dimmer than the X-ray intensity,” says Woods. “But the late phase goes on much longer, sometimes for multiple hours, so it’s putting out just as much total energy as the main flare that typically only lasts for a few minutes.” Because this previously unrealized extra source of energy from the flare is equally important to impacting Earth’s atmosphere, Woods and his colleagues are now studying how the late phase flares can influence space weather.

The late phase flare is, of course, just one piece of the puzzle as we try to understand the star with which we live. But keeping track of the energy, measuring all the different wavelengths of light, using all the instruments NASA has at its disposal, such information helps us map out all the steps of the Sun’s great dance.

Milky Way Harbors “Ticking Time Bombs”

New research shows that some old stars known as white dwarfs might be held up by their rapid spins, and when they slow down, they explode as Type Ia supernovae. Thousands of these "time bombs" could be scattered throughout our Galaxy. In this artist's conception, a supernova explosion is about to obliterate an orbiting Saturn-like planet. Credit: David A. Aguilar (CfA)

[/caption]

According to new research, the only thing that may be keeping elderly stars from exploding is their rapid spin. In a galaxy filled with old stars, this means we could literally be sitting on a nearby “time bomb”. Or is this just another scare tactic?

“We haven’t found one of these ‘time bomb’ stars yet in the Milky Way, but this research suggests that we’ve been looking for the wrong signs. Our work points to a new way of searching for supernova precursors,” said astrophysicist Rosanne Di Stefano of the Harvard-Smithsonian Center for Astrophysics (CfA).

In light of the two recently discovered supernova events in Messier 51 and Messier 101, it isn’t hard to imagine the Milky Way having more than one candidate for a Type Ia supernova. This is precisely the type of stellar explosion Di Stefano and her colleagues are looking for… and it happens when a white dwarf star goes critical. It has reached Chandrasekhar mass. Add any more weight and it blows itself apart. How does this occur? Some astronomers believe Type Ia supernova are sparked by accretion from a binary companion – or a collision of two similar dwarf stars. However, there hasn’t been much – if any – evidence to support either theory. This has left scientists to look for new answers to old questions. Di Stefano and her colleagues suggest that white dwarf spin might just be what we’re looking for.

“A spin-up/spin-down process would introduce a long delay between the time of accretion and the explosion. As a white dwarf gains mass, it also gains angular momentum, which speeds up its spin. If the white dwarf rotates fast enough, its spin can help support it, allowing it to cross the 1.4-solar-mass barrier and become a super-Chandrasekhar-mass star. Once accretion stops, the white dwarf will gradually slow down. Eventually, the spin isn’t enough to counteract gravity, leading to a Type Ia supernova.” explains Di Stefano. “Our work is new because we show that spin-up and spin-down of the white dwarf have important consequences. Astronomers therefore must take angular momentum of accreting white dwarfs seriously, even though it’s very difficult science.”

Sure. It might take a billion years for the spin down process to happen – but what’s a billion years in cosmic time? In this scenario, it’s enough to allow accretion to have completely stopped and a companion star to age to a white dwarf. In the Milky Way there’s an estimated three Type Ia supernovae every thousand years. If figures are right, a typical super-Chandrasekhar-mass white dwarf takes millions of years to spin down and explode. This means there could be dozens of these “time bomb” systems within a few thousand light-years of Earth. While we’re not able to ascertain their locations now, upcoming wide-field surveys taken with instruments like Pan-STARRS and the Large Synoptic Survey Telescope might give us a clue to their location.

“We don’t know of any super-Chandrasekhar-mass white dwarfs in the Milky Way yet, but we’re looking forward to hunting them out,” said co-author Rasmus Voss of Radboud University Nijmegen, The Netherlands.

And the rest of us hope you don’t find them…

Original Story Source: Harvard Smithsonian Center for Astrophysics News. For Further Reading: Spin-Up/Spin-Down models for Type Ia Supernovae.

The Future of NASA’s Human Space Flight Program

The future of NASA’s human space flight looks exciting and bright in this new video. Only time will tell if the ISS program, COTS, CCDev2, Orion and SLS can come together to create the perfect storm of what could be an incredible future. Great expectations? You bet. But isn’t that what NASA is all about? Now if Congress can just get that message and figure it out.

Colorful Cluster of Stars Competes with the Tarantula Nebula

The star cluster NGC 2100 in the Large Magellanic Cloud. Credit: ESO

[/caption]

Who can shine the brightest in the Large Magellanic Cloud? A brilliant cluster of stars, open cluster NGC 2100 shines brightly, competing with the nearby Tarantula Nebula for bragging rights in this image from ESO’s New Technology Telescope (NTT).

Observers perhaps often overlook NGC 2100 because of its close proximity to the impressive Tarantula. The glowing gas of the Tarantula Nebula even tries to steal the limelight in this image — the bright colors here are from the nebula’s outer regions, and is lit up by the hot young stars that lie within the nebula itself.

But back to the star cluster — this brilliant star cluster is around 15 million years old, and located in the Large Magellanic Cloud, a nearby satellite galaxy of the Milky Way. An open cluster has stars that are relatively loosely bound by gravity. These clusters have a lifespan measured in tens or hundreds of millions of years, as they eventually disperse through gravitational interaction with other bodies.

This new picture was created from exposures through several different color filters.The stars are shown in their natural colors, while light from glowing ionized hydrogen (shown here in red) and oxygen (shown in blue) is overlaid.

See more info at the ESO website.

Astrophoto: “The Center Of Our Galaxy Is A Busy Place” by Mike Romine

Not only is the center of our galaxy a busy place for seeing deep space objects – but near ones as well! In this photo taken by Mike Romine, you’ll see many Messier and NGC objects, but one feature really stands out – the ISS. Before you move on, stop and take a closer look. You’ll also find the signatures of an airplane and a tumbling satellite in the frame as well! (Hint: These show up as perfectly spaced series of dots.)

This image was taken on September 4 with a Canon EOS 50D, 135mm lens, F/5.6, ISO 1600, 90 seconds, mounted on a Celestron SCT on a CG5-GT mount at approximately 9:00 pm EST.

Want to get your astrophoto featured on Universe Today? Join our Flickr group, post in our Forum or send us your images by email (this means you’re giving us permission to post them). Please explain what’s in the picture, when you took it, the equipment you used, etc.

Sun Erupts with Spectacular Flares

A digital filtergram shows a type 4B Flare with an X-ray class of X-2 in active region 1283 on Sept. 6, 2011. Credit: Monty Leventha

The Sun sent two flares yesterday from active region 1283. This video shows the second flare, at 6:12 p.m. EDT (2212 GMT) on Tuesday an even bigger flare than the M-class flare from early on Sept. 6, at about 0150 GMT. This was an X-class flare, major events that can trigger planet-wide radio blackouts and long-lasting radiation storms. The latest update says the CMEs could sail north of Earth, delivering a glancing blow to Earth’s magnetic field, and could arrive between September 8 -10. Spaceweather.com says high-latitude sky watchers should be alert for auroras in the nights ahead.

The image below was sent in to Universe Today by Monty Leventhal showing the type 4B Flare with an X-ray class of X-2 in active region 1283.

[/caption]

Here are the details and equipment Monty used:

Date:- 6-9-11
Time:- 22.05 U.T.
Conditions:- Poor
Camera:- Canon 300D
Filter:- H-alpha. 6Å.
Telescope:- Meade S.C. 10 inch

No Evacuation Plans for ISS Yet

Ron Garan and Mike Fossum during the news conference on Sept. 6, 2011. Credit: NASA T

[/caption]

The International Space Station has had a continual human presence for nearly 11 years, and so the astronauts now aboard the ISS are holding out hope that they won’t have to break that streak and turn out the lights and close all the hatches when they leave. Ron Garan and Mike Fossum said in a news conference with reporters on Tuesday that they have not yet been training for the possibility that they will have to leave the ISS unmanned due to a problem with the Soyuz rocket, the only ride astronauts and cosmonauts currently have to space.

“It’s too early for us to get too worried about that, frankly,” said Fossum, “and we haven’t started to do anything specific up here,except for documenting things we do on video. Fossum added that teams in mission control in Houston and Moscow are figuring out the procedures of what needs to be done if a problem with the Soyuz rockets can’t be figured out by November. “It will take us a few weeks to finish that up, but we have another nine or so weeks here, my crew of three. So we’ve got plenty of time for those kinds of things.”

Fossum said the ground crews are in the preliminary stages of deciding everything, “from what ventilation we’re going to leave running, what lights we’re going to leave on, what condition each particular experiment will be on, every tank, every valve, every hatch.”

A Russian rocket carrying a Progress resupply ship failed just after the third stage ignition two weeks ago and crashed into Siberia. While the Progress cargo ships launch on a Soyuz-U rocket and the Soyuz crew capsules — the Soyuz TMA — launches on a Soyuz-FG, the third stages of the two rockets are virtually identical.

Russian engineers said last week a malfunction in the third stage engine’s gas generator occurred; now they need to find out why and launch a couple of unmanned rockets before putting humans on board.

Right now a crew of six is on the station, with three of them scheduled to depart late next week – a week later than originally planned — to keep the station fully staffed as long as possible. A new crew of three was supposed arrive later this month, but that flight is on hold at least until early November, depending on the outcome of the investigation by the Russian engineers.

Since the space shuttles are no longer flying, the Soyuz is the only ride in town. While SpaceX is scheduled to send an unmanned Dragon capsule in a test run for bringing cargo to the station, the station would have to be abandoned if the Soyuz rocket isn’t cleared by November.

“It’s a complicated thing, when a rocket shuts down. It is a big deal,” said Fossum. “We’re not part of that investigation but we know what is going on. It’s not a fundamental design flaw, as this rocket has had hundreds of successful fights. But they are looking for what has changed.”

So, ground teams are now looking ahead for all the possible “what ifs” that might occur and Fossum and Garan said the big problem would be a short time span to do a crew handover – training in the new crew – or if they have to leave the station unmanned. They’ve started videotaping procedures and intricacies they’ve discovered about the station, just in case they aren’t there when a new crew arrives.

But it’s been a source of pride that there have been crews up here for over 4,000 days straight. “I think it is important,” said Fossum, “the station requires some care and feeding, and it is important for us to be here if we possibly can. If we have to shut it down for awhile, we will do our best to leave it in the best possible condition for the next crew to open the doors and turn the lights and and get back to work.”

The astronauts said if they do have to leave the station unmanned for a short period, it shouldn’t be a problem, but if the short gap turns into months, “the probability starts to stack up against you and leads to possibility that you would have a problem that could be significant without anyone up here to take action,” said Fossum.

Meanwhile, science operations are going full speed ahead. “We’re breaking records every week with crew-based research, over and above the autonomous research,” Garan said. “It’s important to note, that in the event we have to leave, there will still be science operations on board.”

NASA Releases Closer Looks at Apollo Landing Sites from the Lunar Reconnaissance Orbiter

Low periapsis Narrow Angle Camera image of the Apollo 17 Landing Site. Image is 150 meters wide, Credit: NASA/GSFC/Arizona State University.

[/caption]

New images of the Apollo 12, 14 and 17 landing sites are the highest resolution pictures ever of human forays onto another world, as seen from a bird’s eye view — or in this case, a satellite’s eye view. The Lunar Reconnaissance Orbiter dipped to a lower altitude, just 21 kilometers (13 miles) over the lunar surface.

“We like to look at the Apollo landing site images because it’s fun,” said LRO principal investigator Mark Robinson at a media briefing today. “But LROC (Lunar Reconnaissance Orbiter Camera) is looking at the whole Moon, and we have now taken 1,500 of these very high resolution images from all around the Moon which will help scientists and engineers to plan where we want to go in the future.”

Apollo 17 landing site taken by LRO in its lower orbit, with 25 cm per pixel. Credit: NASA/Goddard/ASU

Apollo 17 landing site from the regular 50 km altitude and about 50 cm per pixel. Credit: NASA/ Goddard/ ASU

Compare in the images above the Apollo 17 landing site with 25 cm per pixel (top) and 50 cm per pixel (bottom).

Most notable are the tracks where the astronauts walked show up better, and details of the landers/descent stages can be resolved better.

Robinson said he was looking at the new images of the Apollo 17 landing site in Taurus Littrow Valley with Apollo 17 astronaut Jack Schmitt and Schmitt said “You need to image the whole valley at this resolution!”

This is the third resolution of Apollo sites that the LRO team has released — the first came from LRO’s commissioning phase where the altitude was about 100 km and the resolution was about 1 meter per pixel; next came the release of images from an altitude of about 50 km, with a resolution of about 50 cm per pixel; and now from about 21-22 km altitude with a resolution of 25 cm per pixel.

“These are the sharpest images of Apollo landing sites we’ll probably ever get with LRO,” said Rich Vondrak, LRO project scientist, “as we’ll never go as low in altitude as we were in the past month.”

LRO has now returned to its circular orbit of 50 km above the surface. This altitude requires monthly reboosts and since keeping LRO in that orbit would quickly exhaust the remaining fuel, in mid-December, LRO will move to an elliptical orbit, (30 km over south pole and 200 km over north pole). LRO will be able to stay in this orbit for several more years.

“This has been a highly productive mission, releasing a total of 245 terabytes of data — which would be a stack of 52,000 DVDs,” Vondrak said. Next week the science team will put out their 7th public release of data to the Planetary Data System, making all that data available to the public.

The paths left by astronauts Alan Shepard and Edgar Mitchell on both Apollo 14 moon walks are visible in this image. (At the end of the second moon walk, Shepard famously hit two golf balls.) The descent stage of the lunar module Antares is also visible. Credit: NASA's Goddard Space Flight Center/ASU

Robinson noted that the details of what pieces of equipment are in each location are verified by images taken from the surface by the astronauts. He was asked about the flags and if they are still standing: “All we can really see is the spots where the flag was planted because the astronauts tramped down the regolith. I’m not sure if the flags still exist, given the extreme heat and cold cycle and the harsh UV environment. The flags were made of nylon, and personally I would be surprised if anything was left of them since it has been over 40 years since they were left on the Moon and the flags we have here on Earth fade after they are left outside for one summer. If the flags are still there they are probably in pretty rough shape.”

The tracks made in 1969 by astronauts Pete Conrad and Alan Bean, the third and fourth humans to walk on the moon, can be seen in this LRO image of the Apollo 12 site. The location of the descent stage for Apollo 12's lunar module, Intrepid, also can be seen. Credit: NASA/Goddard/ASU

Since we can still see the tracks and equipment looking unchanged (at least from this vantage point) one reporter asked if these items will be on the Moon forever. “Forever is a long time, so no, they won’t be there forever,” Robinson replied. “The Moon is constantly bombarded by micrometeorites, and slowly over time the tracks will disappear, then the smaller pieces of equipment will disappear, and eventually the decent stages will probably get blasted by an a larger asteroid. The estimate is that rocks erode 1 mm per million years. In human terms it may seems like forever, but geologic terms, there will be no traces of Apollo exploration in 10 to 100 million years.”

This video shows more info and a “zoom in” of the sites:

Sources: Media briefing, NASA, LROC

Astrophoto: Laser Lightning!

Lightning strikes during a test of a new laser guide star at the Allgäu Public Observatory in Ottobeuren, Germany. Credit: Martin Kornmesser, ESO

[/caption]

Yikes! This science-fiction-like scene was captured by Martin Kornmesser, a visual artist for the European Southern Observatory. Just as the ESO was testing a new laser guide star unit at the Allgäu Public Observatory in Ottobeuren, Germany, a thunderstorm erupted, throwing down bolts of lightning. The folks at ESO say this is a “very visual demonstration of why ESO’s telescopes are in Chile, and not in Germany.” Although the storm was still far from the observatory, the lightning appears to clash with the laser beam in the sky.

Laser guide stars are one type of adaptive optics astronomers use to correct for the blurring effect of the atmosphere in astronomical observations. The laser creates an artificial guide star 90 kilometers up in the Earth’s atmosphere. The laser in this photograph is a powerful one, with a 20-watt beam, but the power in a bolt of lightning peaks at a trillion watts — although it lasts for just a fraction of a second. Shortly after this picture was taken the storm reached the observatory, forcing operations to close for the night.

See more info at the ESO website.

Mars ‘Rock Garden,’ Now in Color

The 'Rock Garden' at the rim of Endeavour Crater on Mars as seen by the Opportunity rover. Credit: NASA/JPL/Caltech, color by Stu Atkinson

[/caption]

Last week we shared a 3-D view of the area being studied by the Opportunity rover on Mars; now here’s a color view of this stunning landscape on Mars. Both views are the handiwork of Stu Atkinson, a member of Unmanned Spaceflight and author of the Road to Endeavour blog. This is actually an ejecta field of rocks thrown about after the impact that created this huge crater where the rover is now traversing, and is an exciting region for the MER scientists to explore. Look for more great views of this region as Oppy makes her way around, and eventually inside the crater.

Stu tells us that no one should get too excited about the “green stuff” showing up on some of the rocks, as it certainly is not algae or moss or anything like that. “It’s just the colour balance I’ve gone with and the techniques I use,” he said. “Other versions by people with better software and processing skills than myself will no doubt show that green stuff isn’t anything of the kind, but this is the best I can do. And I unashamedly and apologetically go for ‘pretty picture’ rather than ‘scientifically 100% accurate’. That’s NASA’s job. When their version of this scene appears, it’ll be rather different, I’m sure.”

Thanks to Stu for sharing this image!