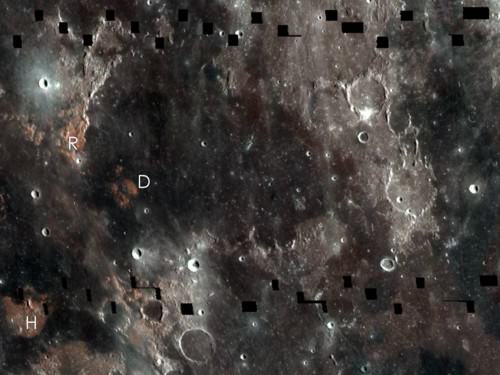
Astrophoto: “Hanging On To A Comet” by Mike Romine

For those of us who had the opportunity to chase Comet Garradd this weekend, half the joy was catching it crossing the “Coathanger” cluster! In this great shot by Mike Romine, the comet appears along the curve of the upside down 2 of the asterism. Mike took this shot without a telescope, using a Canon EOS 50D, 135mm lens, F/5.6, ISO 1600, 90 seconds, mounted on a Celestron SCT on a CG5-GT mount at 12:45 AM. Nice catch!

Want to get your astrophoto featured on Universe Today? Join our Flickr group, post in our Forum or send us your images by email (this means you’re giving us permission to post them). Please explain what’s in the picture, when you took it, the equipment you used, etc.

Meals for Mars?

Mars-bound astronauts may require different meals than the ones prepared for the shuttle program. Image Credit: NASA Johnson Space Center (NASA-JSC)

[/caption]

NASA has made tremendous progress during the past fifty years with regards to food science. Gone are the days of nutrients in toothpaste style tubes and it’s safe to assume NASA astronauts haven’t had to drink Tang in decades.

At a recent meeting of the American Chemical Society, Maya R. Cooper, senior research scientist at NASA’s Space Food Systems Laboratory discussed how feeding astronauts will be one of the most difficult issues to resolve before launching a manned mission to Mars.

Despite all the progress NASA has made, what challenges still need to be overcome to feed the crew of a manned mission to Mars?

When we plan a camping trip, not much thought is given to what will be eaten during a weekend, a week, or even a month’s time. Modern food science has given us products that are safe to eat after even weeks, and in some cases months. It is very easy to go to the store and load up on delicious and nutritious food, with the expectation that said food will be relatively safe to eat with minor concerns for safety.

Manned spaceflight however, isn’t your average camping trip. Even during a one to two week mission, NASA astronauts can’t just open a refrigerator and make themselves a cold-cut sandwich. Food scientists at NASA must specially prepare meals for astronauts in order to ensure said meals are safe to consume during the mission, not only for the crew, but for their habitat as well. The average can or bottle of pop wouldn’t provide the same level of safety and satisfaction for a crew in space as it would for a person on Earth. Food crumbs can clog air filters or become lodged into sensitive equipment. Basically, what works well for a camping trip doesn’t always work for an ISS mission and what works for the ISS crew may not work for a multi-year mission to Mars.

In her talk, Cooper discussed some of the issues such as food safety that she and her team currently address. Some of the other issues discussed included food packaging, nutrition, weight, and of course variety.

Cooper cited that the current daily allocation of food for manned spaceflight crews is just under four pounds per day. Estimating a five-year trek to Mars would require over 7,000 pounds of food per crew person. “That’s a clear impediment to a lot of mission scenarios,” Cooper said. “We need new approaches. Right now, we are looking at the possibility of implementing a bioregenerative system that would involve growing crops in space and possibly shipping some bulk commodities to a Mars habitat as well. This scenario involves much more food processing and meal preparation than the current food system developed for the space shuttles and the International Space Station.”

Various examples of encapsulated space food.
Image Credit: NASA/Johnson Space Flight Center

The idea behind bioregenerative systems is that plants could multi-task, not only providing food, but also removing carbon dioxide gas and releasing oxygen, just like plants on Earth. Plants that are prime candidates for a Mars mission would have very little inedible structure. So far, ten plants that require little room and grow with minimal work have been identified. A few of the ten ideal plants identified are lettuce, spinach, carrots, tomatoes, strawberries, some herbs and cabbage.

One other idea Cooper suggested for future manned missions to Mars, would be to ship food products ahead of time. Sending supplies in advance of a mission would result in less food and packaging flying onboard the manned spacecraft headed to Mars. There are a few questions regarding sending supplies in advance, namely what happens if a critical supply ship fails to reach Mars and whether current food preservation technology can guarantee adequate nutritional content for a mission to Mars.

“The NASA Advanced Food Technology project is currently working to address the issues of food variety, weight, volume, nutrition and trash disposal through research and external academic and commercial collaborations,” Cooper noted.

Source: American Chemical Society

Ray Sanders is a Sci-Fi geek, astronomer and space/science blogger. Visit his website Dear Astronomer and follow on Twitter (@DearAstronomer) or Google+ for more space musings.

Where’s the Debris for Transiting Planets?

For many exoplanet systems that have been discovered by the radial velocity method, astronomers have found excess emission in the infrared portion of the spectrum. This has generally been interpreted as remnants of a disk or collection of objects similar to our own Kupier belt, a ring of icy bodies beyond the orbit of Pluto. But as Kepler and other exoplanet finding missions rake in the candidates though transits of the parent star, astronomers began noticing something unusual: None of the exoplanet systems discovered through this method were known to have debris disks. Was this an odd selection effect, perhaps induced by the fact that transiting planets often orbit close to their parent stars, making them more likely to pass along the line of sight which could in turn, betray different formation scenarios? Or were astronomers simply not looking hard enough? A recent paper by astronomers at the Astrophysikalisches Institut in Germany attempts to answer that question.

In order to do so, the team compared the (at the time) 93 known transiting exoplanets to stars for which archival data was available through infrared missions such has IRAS, ISO, AKARI, and WISE. The team then searched the data looking for a previously unrecognized bump in the emission in the infrared. Many of the stars they searched were faint, due to distance, so most of the IR telescopes did not have images with sufficient depth to draw much in the way of conclusions. Between IRAS, ISO, Spitzer, and AKARI, the team was only able to examine three stars, and all of those came from Spitzer observations.

The most plentiful return came from the WISE telescope which had 53 entries that overlapped with known transiting systems, one of which was excluded due to image defects. From these 52 candidates, the team found four that may have contained excess emission. To follow up, the team added observations from other observatories that lied in the near infrared (the 2MASS survey) and the visual portion of the spectrum. This allowed them to build a more complete picture of the brightness of the stars at various wavelengths which would make the excess stand out even more. While all four systems deviated from an ideal blackbody in the portion of the spectrum expected for a debris disk, only two of them, TrES-2, and XO-5, did so in a manner that did so in a statistically significant manner.

While this study shows that debris disks are possible around transiting stars, it was only able to confirm their presence in two stars out of 52, or just under 4% of their sample. But how does that compare to systems discovered by other methods? One of the studies cited in the paper used a similar method of comparing archival data from IR observatories to known exoplanet system discovered by other methods in 2009. In this study, the team found debris disks around 10 of the 150 planet-bearing stars, which is roughly 7%. Due to the low return rate on both of these studies, the inherent uncertainty puts these two figures within a plausible range of one another, but certainly, more studies will be in order in the future. They will help astronomers determine just what difference exists, if any, as well as giving more insight into how planetary system form and evolve.

Tropical Storm Lee Drenches Gulf Coast as Hurricane Katia Aims for US East Coast

Tropical Storm Lee - Visible image from the GOES-13 satellite on Sunday, Sept. 4 at 9:32 a.m. EDT. It shows the extent of Lee's cloud cover over Louisiana, Mississippi, Alabama and the Florida Panhandle and spread into the Tennessee Valley. The thickest clouds and heaviest rainfall stretch from the northeast to southwest of the center. Credit: NASA/NOAA GOES Project

[/caption]

New imagery from NASA and NOAA satellites taken today (Sept 4) shows the extent of a hurricane season storm currently ravaging the US Gulf Coast and another potentially posing a new threat to US East Coast areas still suffering from the vast destruction caused by Hurricane Irene just days ago. Data from the NASA and NOAA satellites is critical in providing advance warning to government officials and local communities to save human lives and minimize property damage. .

Slow moving Tropical Storm Lee has unleashed strong thunderstorms and heavy rainfall in several Gulf Coast states. Rainfall amounts of up to 7 to 14 inches over the last 48 hours are currently drenching coastal and inland communities – especially in Louisiana, Mississippi and Alabama along a wide swath that extends from Texas to the Florida panhandle.

Isolated pockets of Gulf State areas may see up to 20 inches of rainfall. Severe flooding to homes and roads has occurred in some locations. Winds have diminished from 60 mph on Saturday (Sept. 3) to 45 mph on Sunday.

Imagery and measurements from the Aqua and GOES-13 satellites from NASA and NOAA revealed that TS Lee finally made landfall in Louisiana after two days of drenching rain along the Gulf Coast..

A tropical storm warning is in effect on Sept 4 for New Orleans, Lake Pontchartrain, and Lake Maurepas. Fortunately the rebuilt levees in New Orleans appear to holding in the first serious test since the vast destruction of Hurricane Katrina. Other areas are less lucky.

This infrared image of Tropical Storm Lee on Sept. 3 at 3:47 p.m. EDT when the center was still sitting south of the Louisiana coast. The strongest thunderstorms and coldest clouds (purple) stretched from Mobile Bay, south into the Gulf of Mexico and covered about 1/3rd of the Gulf of Mexico. Winds were 55 mph at the time of this image. The image was taken by the AIRS instrument on NASA's Aqua satellite. Credit: NASA JPL, Ed Olsen NASA

Lee’s tropical force winds now extend out 275 miles from the center. A large part of Lee is still over the Gulf of Mexico where the driving wind and rain affected operations on some oil rigs.

Lee has spawned more than a dozen tornadoes in the Gulf Coast states. The storm is spreading more heavy rain and winds on a northeast to east- northeast heading tracking towards Tennessee over the next 24 to 36 hours according to the latest weather forecasts.

Meanwhile Hurricane Katia is packing winds of 110 MPH and is on a path that could cause it to make landfall on the Outer Banks of North Carolina just a week after the state suffered from Hurricane Irene.

Hurricane Katia has the potential to affect the launch of NASA’s GRAIL Lunar Mappers slated for liftoff on Sept. 8 from Cape Canaveral, Florida, depending on its exact course.

This GOES-13 satellite image shows Hurricane Katia (right), Tropical Depression 13 (left) and System 94L (top). Credit: NASA/NOAA GOES Project

Irene caused extensive flooding and devastation on the hundred year scale in several US states still reeling from flooding and destruction. More than 43 deaths have been reported so far, including emergency rescue workers. Initial damage estimates are over $6 Billion.

Thousands of East Coast homes and businesses are still without power as strong after effects from Irene continue to play out.

President Obama toured flood stricken areas of Paterson, New Jersey today (Sept. 4).

According to a statement by Rob Gutro, of NASA’s Goddard Space Flight Center, Greenbelt, Md; Tropical Storm Lee’s winds had dropped from 60 mph exactly 24 hours before to 45 mph at 8 a.m. EDT on Sept. 4.

Lee’s center was over Vermillion Bay, Louisiana near 29.7 North and 92.0 West. It was crawling to the northeast near 3 mph (6 kmh) and expected to continue in that direction today, turning to the east-northeast tonight. Because Lee’s center is over land, he is expected to continue weakening gradually in the next couple of days. Lee’s outer bands still extend far over the Gulf of Mexico, bringing in more moisture and keeping the system going.

Here's a 3-D look at Tropical Depression 13 from NASA's TRMM Satellite on Sept 1. Some of the highest thunderstorm towers in that area were shown by PR data to reach heights of over 15km (~9.3 miles) and there were areas of heavy rain - which is going to affect the shoreline.. waves of rainfall to move inland. Credit: NASA/Goddard
This visible image of Tropical Storm Lee was taken from the GOES-13 satellite on Saturday, Sept. 3 at 9:32 a.m. EDT. It shows the extent of Lee's cloud cover over Louisiana, Mississippi, Alabama and the Florida Panhandle. The clearing on the southeastern side is a result of drier air moving in and preventing development of thunderstorms. Credit: NASA/NOAA GOES Project

NASA – Eyes On The Solar System

Are you ready for a fascinating virtual experience? Then check out “Eyes on the Solar System”! This clever compilation of visualizations and real images takes you on a journey that’s sure to keep you entertained for hours!

If you’ve had the chance to use high dollar astronomy software, you’ll appreciate this free program. Inside is a 3-D environment full of real NASA mission data which lets you explore the cosmos from the comfort of your computer. You can choose exploring an asteroid, scouring around a planet or taking a look at Earth from above. Fly with NASA’s Voyager 2 spacecraft or join Cassini. You can even see the entire solar system moving in real time! Just check out a very small part of the features in this introductory video…

There’s so much more there, too. Imagine the possibilities of Kepler, Lunar Reconnaissance Orbiter and the Spitzer Space Telescope! Move forward and backward in time… You’re in command of this space journey! According to the developers, the awesome modeling team is currently working on a number of spacecraft models. In the near future, expect to see finished models of Phoenix (cruise), Mars Exploration Rovers (cruise), Mars Science Laboratory (cruise), Mars Odyssey, and Mars Express. There are many spacecraft in the pipeline, so be patient!

While NASA’s “Eyes on the Solar System” is compatible with Windows and Mac OS X, the partially Java-scripted format has a certain dependence on what browser is used. Firefox is recommended for smoothest operation, but it also works with IE and Safari. (I personally use Opera and encountered no problems – but avoid Chrome.) Other than that? Grab and comfy seat and take flight!

Mars Express Delivers Views Of Martian Lake

Holden crater is 140 km across, filling the left side of the image, while to the right is the remaining part of Eberswalde crater, with a diameter of about 65 km. They are located in the southern highlands of Mars. North is to the right of the image. The image was acquired by Mars Express at approximately 25°S / 326°E during orbit 7208 on 15 August 2009. The images have a ground resolution of about 22 m per pixel. Credits: ESA/DLR/FU Berlin (G. Neukum)

[/caption]

In the southern highlands of Mars, Eberswalde crater to be exact, ESA’s Mars Express exploration has pinpointed an area which once held a lake. Although it may have been some 4 billion years ago, the geologic remains – called a delta – are still evident in the new images. This region of dark sediments are a shadowed reminder that Mars once had water.

Formed by an asteroid strike, Eberswalde crater has nearly eroded away with time. After it formed, it was partially obliterated by another impact which shaped 140 km diameter crater Holden. Although this second strike buried Eberswalde with ejecta, 115 square kilometers of delta area and feeder channels survived. These channels once were the arteries that pumped water along the surface to pool in the crater’s interior, forming a lake. As they carried water, they also carried sediments and – just as on Earth – left their mark. With time, the water dried up and even more sediments were carried along by the wind, exposing the area in vivid relief.

NASA’s Mars Global Surveyor spacecraft spied the delta in earlier missions, giving even further solidification that Mars was once a wet world. While Eberswalde crater and Holden crater were once a part of a list of possible landing sites for the Mars Science Laboratory, Gale crater was selected as the Curiosity’s landing site, given its high mineral and structural diversity related to water. But don’t count this wonderful, wet confession of a lake out forever. Thanks to high mineral diversity and suggestive structure, we’re sure to visit the delta of Eberswalde and Holden again, from orbit or with another landing mission.

Original Story Source: ESA News.

Astronomy Without A Telescope – Cosmic Coincidence

caption...

[/caption]

Cosmologists tend not to get all that excited about the universe being 74% dark energy and 26% conventional energy and matter (albeit most of the matter is dark and mysterious as well). Instead they get excited about the fact that the density of dark energy is of the same order of magnitude as that more conventional remainder.

After all, it is quite conceivable that the density of dark energy might be ten, one hundred or even one thousand times more (or less) than the remainder. But nope, it seems it’s about three times as much – which is less than ten and more than one, meaning that the two parts are of the same order of magnitude. And given the various uncertainties and error bars involved, you might even say the density of dark energy and of the more conventional remainder are roughly equivalent. This is what is known as the cosmic coincidence.

To a cosmologist, particularly a philosophically-inclined cosmologist, this coincidence is intriguing and raises all sorts of ideas about why it is so. However, Lineweaver and Egan suggest this is actually the natural experience of any intelligent beings/observers across the universe, since their evolution will always roughly align with the point in time at which the cosmic coincidence is achieved.

A current view of the universe describes its development through the following steps:

Inflationary era – a huge whoomp of volume growth driven by something or other. This is a very quick era lasting from 10-35 to 10-32 of the first second after the Big Bang.
Radiation dominated era – the universe continues expanding, but at a less furious rate. Its contents cools as their density declines. Hadrons begin to cool out from hot quark-gluon soup while dark matter forms out of whatever it forms out of – all steadily adding matter to the universe, although radiation still dominates. This era lasts for maybe 50,000 years.
Matter dominated era – this era begins when the density of matter exceeds the density of radiation and continues through to the release of the cosmic microwave background radiation at 380,000 years, when the first atoms formed – and then continues on for a further 5 billion years. Throughout this era, the energy/matter density of the whole universe continues to gravitationally restrain the rate of expansion of the universe, even though expansion does continue.
Cosmological constant dominated era – from 5 billion years to now (13.7 billion) and presumably for all of hereafter, the energy/matter density of the universe is so diluted that it begins losing its capacity to restrain the expansion of universe – which hence accelerates. Empty voids of space grow ever larger between local clusters of gravitationally-concentrated matter.

And here we are. Lineweaver and Egan propose that it is unlikely that any intelligent life could have evolved in the universe much earlier than now (give or take a couple of billion years) since you need to progressively cycle through the star formation and destruction of Population III, II and then I stars to fill the universe with sufficient ‘metals’ to allow planets with evolutionary ecosystems to develop.

The four eras of the universe mapped over a logarithmic time scale. Note that "Now" occurs as the decline in matter density and the acceleration in cosmic expansion cross over. Credit: Lineweaver and Egan.

So any intelligent observer in this universe is likely to find the same data which underlie the phenomenon we call the cosmological coincidence. Whether any aliens describe their finding as a ‘coincidence’ may depend upon what mathematical model they have developed to formulate the cosmos. It’s unlikely to be the same one we are currently running with – full of baffling ‘dark’ components, notably a mysterious energy that behaves nothing like energy.

It might be enough for them to note that their observations have been taken at a time when the universe’s contents no longer have sufficient density to restrain the universe’s inherent tendency to expand – and so it expands at a steadily increasing rate.

Further reading: Lineweaver and Egan. The Cosmic Coincidence as a Temporal Selection Effect Produced by the Age Distribution of Terrestrial Planets in the Universe (subsequently published in Astrophysical Journal 2007, Vol 671, 853.)

HARPS Tunes In On Habitable Planet

Artist Concept of Extra-Solar Planet Courtesy of NASA

[/caption]

Using the High Accuracy Radial velocity Planet Searcher (HARPS), a team of scientists at University of Geneva, Switzerland, led by the Swiss astronomer Stephane Udry made a sound discovery… an Earth-like planet orbiting star HD 85512. Located about 36 light years away in the constellation of Vela, this extrasolar planet is one of the smallest to be documented in the “habitable zone” and could very well be a potential home to living organisms.

Circling its parent star every 54 days at about the quarter of the distance which Earth orbits the Sun, the newly discovered planet shows every sign of a temperate climate and a possibility of water. However, the rocky little world would need to exhibit some very cloudy skies to make the grade.

“We model rocky planets with H2O/CO2/N2 atmospheres, representative of geological active planets like Earth, to calculate the maximum Bond albedo as a function of irradiation and atmosphere composition and the edges of the HZ for HD 85512 b. These models represent rocky geological active planets and produce a dense CO2 atmosphere at the outer edge, an Earth-like atmosphere in the middle, and a dense H2O atmospheres at the inner edge of the HZ.” says the team. “The inner limit for the 50% cloud case corresponds to the “Venus water loss limit”, a limit that was empirically derived from Venus position in our Solar System (0.72 AU).”

But there’s always from one extreme to another when it comes to a planet being in just the right place. “The inner edge of the (Habitable zone) denotes the location where the entire water reservoir can be vaporized by runaway greenhouse conditions, followed by the photo-dissociation of water vapor and subsequent escape of free hydrogen into space. The outer boundary denotes the distance from the star where the maximum greenhouse effect fails to keep CO2 from condensing permanently, leading to runaway glaciation,” says the Kaltenegger/Udry/Pepe study.

While the whole scenario might not be exciting to some, the study is helping to lay a very solid foundation for evaluating current and future planet candidates for life supporting conditions. “A larger sample will improve our understanding of this field and promises to explore a very interesting parameter space that indicates the potential coexistence of extended H/He and H2O dominated atmospheres as well as rocky planet atmospheres in the same mass and temperature range.” says Kaltenegger. “HD 85512 b is, with Gl 581 d, the best candidate for exploring habitability to date, a planet on the edge of habitability.”

And one step closer to better understanding what’s out there…

For further reading: A Habitable Planet around HD 85512?.

What is the Difference Between Speed and Velocity?

What is the Difference Between Speed and Velocity?
Launch of Atlantis's final mission, STS-135. Credit: NASA. 3-D by Nathanial Burton-Bradford.

[/caption]
When it comes to measuring motion, that is the relative passage of an object through space at a certain rate of time, several different things need to be taken into account. For example, it is not enough to know the rate of change (i.e. the speed) of the object. Scientists must also be able to assign a vector quantity; or in other words, to know the direction as well as the rate of change of that object. In the end, this is major difference between Speed and Velocity. Though both are calculated using the same units (km/h, m/s, mph, etc.), the two are different in that one is described using numerical values alone (i.e. a scalar quantity) whereas the other describes both magnitude and direction (a vector quantity).

By definition, the speed of an object is the magnitude of its velocity, or the rate of change of its position. The average speed of an object in an interval of time is the distance traveled by the object divided by the duration of the interval. Represented mathematically, it looks like this: ν=[v]=[?] = [dr/dt]•, where speed ν is defined as the magnitude of the velocity v, that is the derivative of the position r with respect to time. The fastest possible speed at which energy or information can travel, according to special relativity, is the speed of light in vacuum (a.k.a. c = 299,792,458 meters per second, which is approximately 1079 million kilometers per hour or 671,000,000 mph).

Velocity, on the other hand, is the measurement of the rate and direction of change in the position of an object. Since it is a vector physical quantity, both magnitude and direction are required to define it. The scalar absolute value (magnitude) of velocity is speed, a quantity that is measured in metres per second (m/s) when using the SI (metric) system. Mathematically, this is represented as: v = Δx/Δt, where v is the average velocity of an object, (Δx) is the displacement and (Δt) is the time interval. Add to this a vector (i.e. Δx/Δt→, ←, or what have you), and you’ve got velocity!

As an example, consider the case of a bullet being fired from a gun. If we divide the overall distance it travels within a set period of time (say, one minute), than we have successfully calculated its speed. On the other hand, if we want to determine its velocity, we must consider the direction of the bullet after it’s been fired. Whereas the average speed of the object would be rendered as simple meters per second, the velocity would be meters per second east, north, or at a specific angle.

We have written many articles about speed and velocity for Universe Today. Here’s an article about formula for velocity, and here’s an article about escape velocity.

If you’d like more info on speed and velocity, check out these articles:
Speed and Velocity
Angular and Linear Velocity

We’ve also recorded an episode of Astronomy Cast about the space shuttle. Listen here, Episode 127: The US Space Shuttle.

Sources:
http://physics.info/velocity
http://en.wikipedia.org/wiki/Speed
http://en.wikipedia.org/wiki/Velocity
http://www.physicsclassroom.com/class/1dkin/u1l1d.cfm
http://www.edinformatics.com/math_science/acceleration.htm

Dispersion of Light

Dispersion of Light
Dispersion of Light. Credit: tutorvista.com

[/caption]
Look up into the rainy sky! What do you see? Well, if its just rained and the sun is once again shining, chances are you see a rainbow. Always a lovely sight isn’t it? But why is it that after a rainstorm, the air seems to catch the light in just the right way to produce this magnificent natural phenomenon? Much like stars, galaxies, and the flight of a bumblebee, some complicated physics underlie this beautiful act of nature. For starters, this effect, where light is broken into the visible spectrum of colors, is known as the Dispersion of Light. Another name for it is the prismatic effect, since the effect is the same as if one looked at light through a prism.

To put it simply, light is transmitted on several different frequencies or wavelengths. What we know as “color” is in reality the visible wavelengths of light, all of which travel at different speeds through different media. In other words, light moves at different speed through the vacuum of space than it does through air, water, glass or crystal. And when it comes into contact with a different medium, the different color wavelengths are refracted at different angles. Those frequencies which travel faster are refracted at a lower angle while those that travel slower are refracted at a sharper angle. In other words, they are dispersed based on their frequency and wavelength, as well as the materials Index of Refraction (i.e. how sharply it refracts light).

The overall effect of this – different frequencies of light being refracted at different angles as they pass through a medium – is that they appear as a spectrum of color to the naked eye. In the case of the rainbow, this occurs as a result of light passing through air that is saturated with water. Sunlight is often referred to as “white light” since it is a combination of all the visible colors. However, when the light strikes the water molecules, which have a stronger index of refraction than air, it disperses into the visible spectrum, thus creating the illusion of a colored arc in the sky.

Now consider a window pane and a prism. When light passes through glass that has parallel sides, the light will return in the same direction that it entered the material. But if the material is shaped like a prism, the angles for each color will be exaggerated, and the colors will be displayed as a spectrum of light. Red, since it has the longest wavelength (700 nanometers) appears at the top of the spectrum, being refracted the least. It is followed shortly thereafter by Orange, Yellow, Green, Blue, Indigo and Violet (or ROY G. GIV, as some like to say). These colors, it should be noted, do not appear as perfectly distinct, but blend at the edges. It is only through ongoing experimentation and measurement that scientists were able to determine the distinct colors and their particular frequencies/wavelengths.

We have written many articles about dispersion of light for Universe Today. Here’s an article about the refractor telescope, and here’s an article about visible light.

If you’d like more info on the dispersion of light, check out these articles:
dispersion of Light by Prisms
Q & A: Dispersion of Light

We’ve also recorded an episode of Astronomy Cast all about the Hubble Space Telescope. Listen here, Episode 88: The Hubble Space Telescope.

Sources:
http://en.wikipedia.org/wiki/Refractive_index
http://en.wikipedia.org/wiki/Dispersion_%28optics%29
http://www.physicsclassroom.com/class/refrn/u14l4a.cfm
http://www.phy.ntnu.edu.tw/ntnujava/index.php?topic=415.0
http://www.school-for-champions.com/science/light_dispersion.htm