Stunning Timelapse Video of Earth and Sky, Volume 2

Almost a year ago we featured a timelapse video by videographer Dustin Farrell that showed the beauty of our Earth and sky. He’s now completed a second video which is just absolutely beautiful. Of particular interest to Universe Today readers is how Farrell was able to capture the stunning shimmering of stars at night and he even got several long-trailing meteors to make a cameo. Farrell says every frame of this video is a raw still from a Canon 5D2 DSLR and processed with Adobe software. “In Volume 2 I again show off my beautiful home state of Arizona and I also made several trips to Utah,” he writes on his Vimeo page. “This video has some iconic landmarks that we have seen before. I felt that showing them again with motion controlled HDR and/or night timelapse would be a new way to see old landmarks.”

Just gorgeous. Watching in HD with a big screen is recommended. Farrell adds that part 3 may be on the way. (Yay!)

Buried Treasure: Astronomers Find Exoplanets Hidden in Old Hubble Data

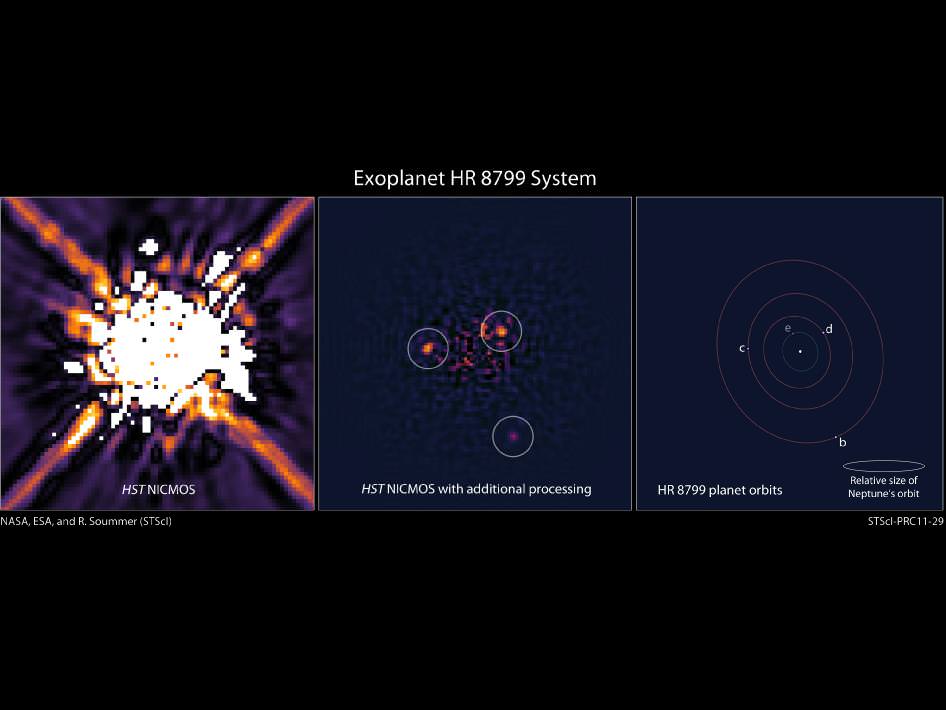
The left image shows the star HR 8799 as seen by Hubble's Near Infrared Camera and Multi-Object Spectrometer (NICMOS) in 1998. The center image shows recent processing of the NICMOS data with newer, sophisticated software. The processing removes most of the scattered starlight to reveal three planets orbiting HR 8799. Based on the reanalysis of NICMOS data and ground-based observations, the illustration on the right shows the positions of the star and the orbits of its four known planets. (Credit: NASA; ESA; STScI, R. Soummer)

[/caption]

Over the past 21 years, the Hubble Space Telescope has gathered boatloads of data, with the Hubble archive center filling about 18 DVDs for every week of the telescope’s life. Now, with improved data mining techniques, an intense re-analysis of HST images from 1998 has revealed some hidden treasures: previously undetected extrasolar planets.

Scientists say this discovery helps prove a new method for planet hunting by using archived Hubble data. Also, discovering the additional exoplanets in the Hubble data helps them compare earlier orbital motion data to more recent observations.

How did astronomers detect the previously unseen exoplanets, and can the methods used be applied to other HST data sets?

This isn’t the first time hidden exoplanets have been revealed in HST data – In 2009 David Lafreniere of the University of Montreal recovered hidden exoplanet data in Hubble images of HR 8799. The HST images Lafreniere studied were taken in 1998 with the Near Infrared Camera and Multi-Object Spectrometer (NICMOS). The outermost planet orbiting HR 8799 was identified and demonstrated the power of a new data-processing technique which could tease out faint planets from the glow of their central star.

Four giant planets are now known to orbit HR 8799, the first three of which were discovered in 2007/2008 in near-infrared images taken with instruments at the W.M. Keck Observatory and the Gemini North telescope by Christian Marois of the National Research Council in Canada. In 2010 Marois and his team uncovered a fourth, innermost, planet. What makes the HR 8799 system so unique is that it is the only multi-exoplanet star system that has been directly imaged.

The new analysis by Remi Soummer of the Space Telescope Science Institute has found all three of the outer planets. Unfortunately, the fourth, innermost planet is close to HR 8799 and cannot be imaged due obscuration by the the NICMOS coronagraph that blocks the central star’s light.

When astronomers study exoplanets by directly imaging them, they study images taken several years apart – not unlike methods used to find Pluto and other dwarf planets in our solar system like Eris. Understanding the orbits in a multi-planet system is critical since massive planets can affect the orbits of their neighboring planets in the system. “From the Hubble images we can determine the shape of their orbits, which brings insight into the system stability, planet masses and eccentricities, and also the inclination of the system,” says Soummer.

Making the study difficult is the extremely long orbits of the three outer planets, which are approximately 100, 200, and 400 years, respectively. The long orbital periods require considerable time to produce enough motion for astronomers to study. In this case however, the added time span from the Hubble data helps considerably. “The archive got us 10 years of science right now,” Soummer says. “Without this data we would have had to wait another decade. It’s 10 years of science for free.”

Given its 400 year orbital period, in the past ten years, the outermost planet has barely changed position. “But if we go to the next inner planet we see a little bit of an orbit, and the third inner planet we actually see a lot of motion,” Soummer added.

When the original HST data was analyzed, the methods used to detect exoplanets such as those orbiting HR 8799 were not available. Techniques to subtract the light from a host star still left residual light that drowned out the faint exoplanets. Soummer and his team improved on the previous methods and used over four hundred images from over 10 years of NICMOS observations.

The improvements on the previous technique included increasing contrast and minimizing residual starlight. Soummer and his team also successfully removed the diffraction spikes, a phenomenon that amateur and professional telescope imaging systems suffer from. With the improved techniques, Soummer and his team were able to see two of HR 8799’s faint inner planets, which are about 1/100,000th the brightness of the host star in infra-red.

Soummer has made plans to next analyze 400 more stars in the NICMOS archive with the same technique, which demonstrates the power of the Hubble Space Telescope data archive. How many more exoplanets are uncovered is anyone’s guess.

Finding these new exoplanets proves that even after the HST is no longer functioning, Hubble’s data will live on, and scientists will rely on Hubble’s revelations for years as they continue in their quest to understand the cosmos.

Source: Hubble Space Telescope Mission Updates

Encapsulating Curiosity for Martian Flight Test

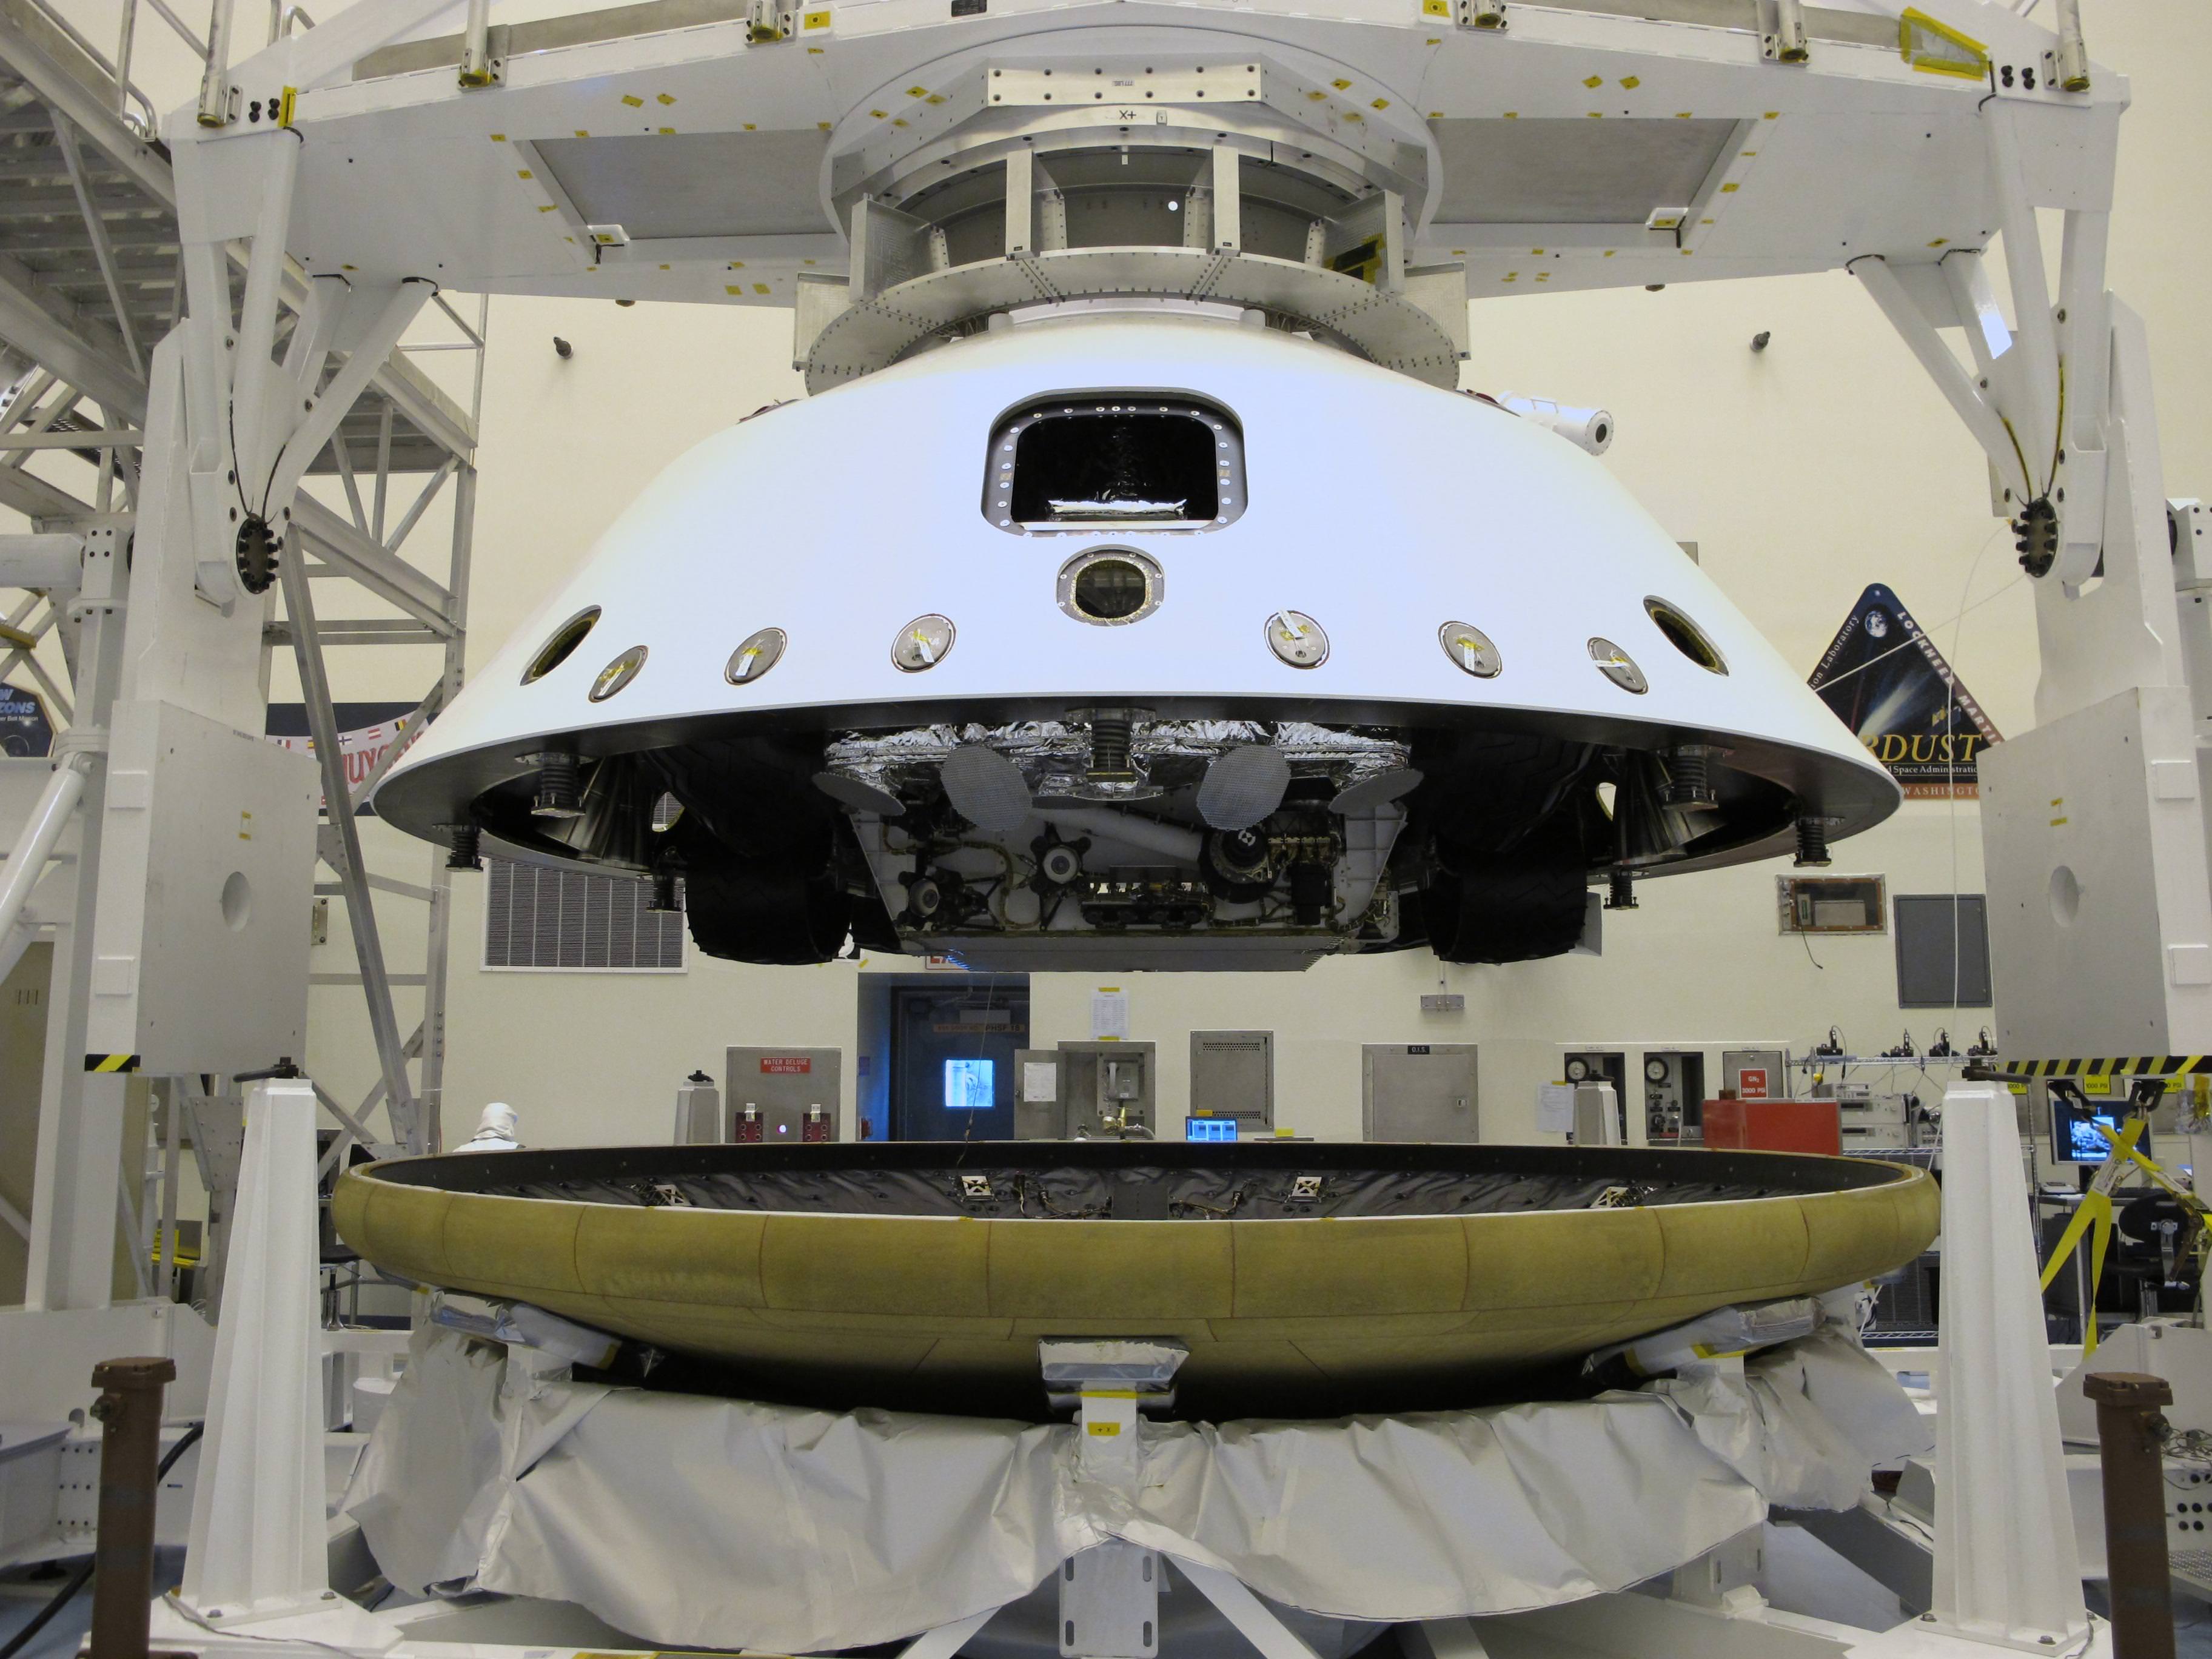
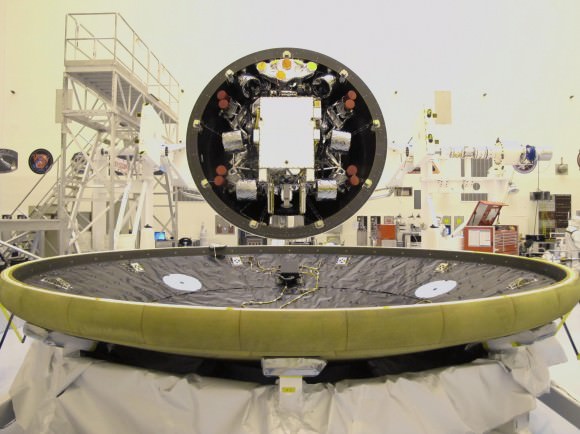
NASA’s Curiosity Mars Science Laboratory Rover inside the entry aeroshell. At the Payload Hazardous Servicing Facility at NASA's Kennedy Space Center in Florida, the "back shell powered descent vehicle" configuration, containing NASA's Mars Science Laboratory rover, Curiosity, is being placed on the spacecraft's heat shield. Credit: NASA/JPL-Caltech

[/caption]

With just over 6 weeks to go until the liftoff of Curiosity – NASA’s next Mars rover – prelaunch processing at the Kennedy Space Center (KSC) in Florida is rapidly entering the home stretch. Technicians placed the folded rover inside the complete aeroshell to match the Martian entry configuration components together and conduct preflight testing of the integrated assembly at the Payload Hazardous Servicing Facility at KSC. The aeroshell is comprised of the heat shield and back shell and encapsulates Curiosity during the long voyage to Mars.

The job of the aeroshell is to protect the Curiosity Mars Science Laboratory (MSL) from the intense heat of several thousand degrees F(C) generated by friction as the delicate assemblage smashes into the Martian atmosphere during the terrifying entry and descent to the surface.

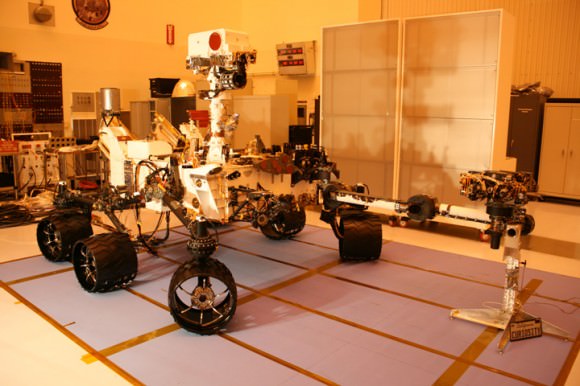
Curiosity Mars Science Laboratory Rover - inside the Cleanroom at KSC. Credit: Ken Kremer

The rover itself has been mated to the back shell powered descent vehicle, known as the PDV or sky crane. The rocket powered descent stage (PDV) is designed to maneuver through the Martian atmosphere, slow the descent and safely set Curiosity down onto the surface at a precise location inside the chosen landing site of Gale Crater.

Technicians still have several more weeks of hardware testing and planetary protection checks ahead before NASA’s minivan sized Martian robot is encapsulated inside the aeroshell for the final time.

Rotating Curiosity's Back Shell Powered Descent Vehicle
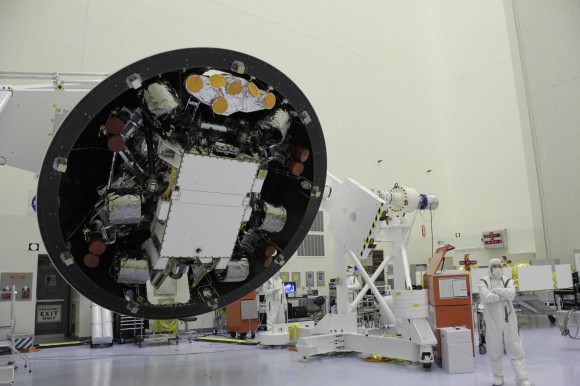
At the Payload Hazardous Servicing Facility at the Kennedy Space Center in Florida, the "back shell powered descent vehicle" configuration of NASA's Mars Science Laboratory is being rotated for final closeout actions. At this time Curiosity and its rocket-powered descent stage have already been integrated, and are now encapsulated inside the spacecraft's back shell. The configuration of rover integrated with the descent stage is the "powered descent vehicle." The back shell, a protective cover, carries the parachute and several other components used during descent. The yellow disks visible at the top of the configuration are the descent stage's radar antennas that will be used to calculate the rover's descent speed and altitude. Credit: NASA/JPL-Caltech

Another major task still to be completed is mating the aeroshell to the cruise stage and then fueling of the cruise stage, which guides MSL from the Earth to Mars, according to Guy Webster, press spokesman for NASA’s Jet Propulsion Laboratory which manages the MSL project for NASA.

The launch of the $2.5 Billion Curiosity rover atop an Atlas V rocket is slated for Nov. 25, the day after Thanksgiving, and the launch window extends until Dec. 18. Arrival at Gale crater is set for August 2012.

Curiosity is by far the most scientifically advanced surface robotic rover ever sent beyond Earth and will search for environmental conditions that could have been favorable to support Martian microbial life forms if they ever existed in the past or present.

Final Closeout Actions for Curiosity's Heat Shield and Back Shell
At the Payload Hazardous Servicing Facility at NASA's Kennedy Space Center in Florida, the "back shell powered descent vehicle" configuration, containing NASA's Mars Science Laboratory rover, Curiosity, is being rotated for final closeout actions. The flat, circular object in the foreground of the image is the spacecraft's heat shield. The heat shield and the back shell will together form an encapsulating aeroshell that will protect the rover from the intense heat and friction that will be generated as the flight system descends through the Martian atmosphere.Credit: NASA/JPL-Caltech

Watch for my upcoming report from inside the cleanroom with Curiosity.
Read Ken’s continuing features about Curiosity and Opportunity starting here:
Opportunity spotted Exploring vast Endeavour Crater from Mars Orbit
Twin Towers 9/11 Tribute by Opportunity Mars RoverNASA Robot arrives at ‘New’ Landing Site holding Clues to Ancient Water Flow on Mars
Opportunity Arrives at Huge Martian Crater with Superb Science and Scenic Outlook
Opportunity Snaps Gorgeous Vistas nearing the Foothills of Giant Endeavour Crater
Dramatic New NASA Animation Depicts Next Mars Rover in Action
Opportunity Rover Heads for Spirit Point to Honor Dead Martian Sister; Science Team Tributes

The Crab Gets Cooked With Gamma Rays

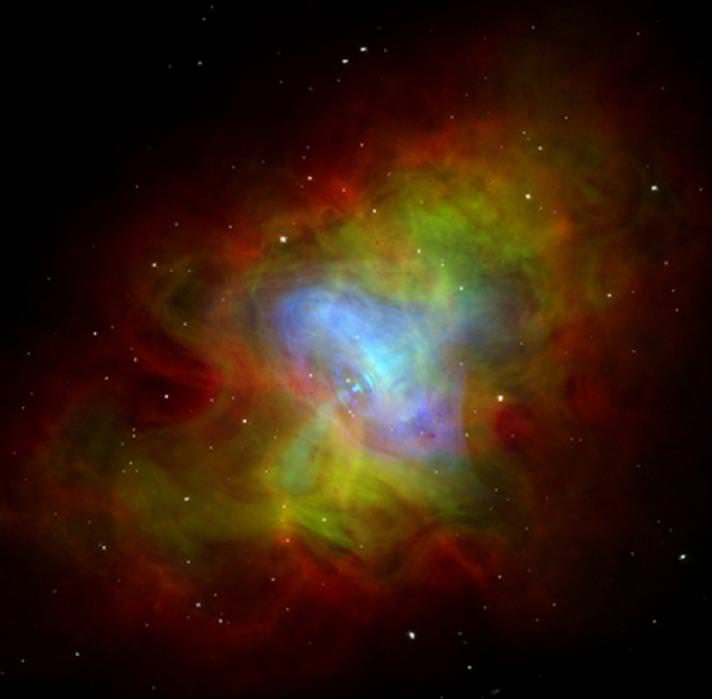
X-ray: NASA/CXC/ASU/J. Hester et al.; Optical: NASA/HST/ASU/J. Hester et al.; Radio: NRAO/AUI/NSF Image of the Crab Nebula combines visible light (green) and radio waves (red) emitted by the remnants of a cataclysmic supernova explosion in the year 1054. and the x-ray nebula (blue) created inside the optical nebula by a pulsar (the collapsed core of the massive star destroyed in the explosion). The pulsar, which is the size of a small city, was discovered only in 1969. The optical data are from the Hubble Space Telescope, and the radio emission from the National Radio Astronomy Observatory, and the X-ray data from the Chandra Observatory.

[/caption]

It’s one of the most famous sights in the night sky… and 957 years ago it was bright enough to be seen during the day. This supernova event was one of the most spectacular of its kind and it still delights, amazes and even surprises astronomers to this day. Think there’s nothing new to know about M1? Then think again…

An international collaboration of astrophysicists, including a group from the Department of Physics in Arts & Sciences at Washington University in St. Louis, has detected pulsed gamma rays coming from the heart of the “Crab”. Apparently the central neutron star is putting off energies that can’t quite be explained. These pulses between range 100 and 400 billion electronvolts (Gigaelectronvolts, or GeV), far higher than 25 GeV, the most energetic radiation recorded. To give you an example, a 400 GeV photon is almost a trillion times more energetic than a light photon.

“This is the first time very-high-energy gamma rays have been detected from a pulsar – a rapidly spinning neutron star about the size of the city of Ames but with a mass greater than that of the Sun,” said Frank Krennrich, an Iowa State professor of physics and astronomy and a co-author of the paper.

We can thank the Arizona based Very Energetic Radiation Imaging Telescope Array System (VERITAS) array of four 12-meter Cherenkov telescopes covered in 350 mirrors for the findings. It is continually monitoring Earth’s atmosphere for the fleeting signals of gamma-ray radiation. However, findings like these on such a well-known object is nearly unprecedented.

“We presented the results at a conference and the entire community was stunned,” says Henric Krawczynski, PhD, professor of physics at Washington University. The WUSTL group led by James H. Buckley, PhD, professor of physics, and Krawczynski is one of six founding members of the VERITAS consortium.

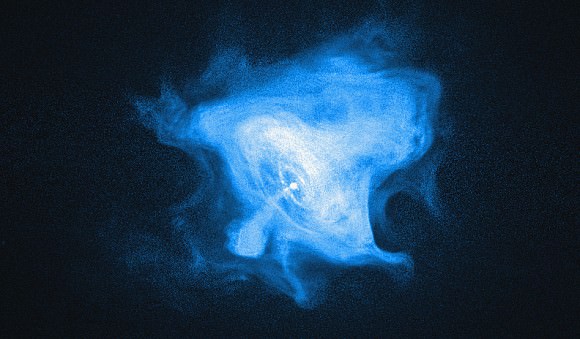
An X-ray image of the Crab Nebula and pulsar. Image by the Chandra X-ray Observatory, NASA/CXC/SAO/F. Seward.

We know the Crab’s story and how its pulsar sweeps around like a lighthouse… But Krennrich said such high energies can’t be explained by the current understanding of pulsars. Not even curvature radiation can be at the root of these gamma-ray emissions.

“The pulsar in the center of the nebula had been seen in radio, optical, X-ray and soft gamma-ray wavelengths,” says Matthias Beilicke, PhD, research assistant professor of physics at Washington University. “But we didn’t think it was radiating pulsed emissions above 100 GeV. VERITAS can observe gamma-rays between100 GeV and 30 trillion electronvolts (Teraelectronvolts or TeV).”

Just enough to cook one crab… well done!

Original Story Source: Iowa State University News Release. For Further Reading: Washington University in St. Louis News Release.

Even the Early Universe Had the Ingredients for Life

The optical image of TN J0924-2201, a very distant radio galaxy at (redshift) z = 5.19, obtained with the Hubble Space Telescope. (c) NASA/STScI/NAOJ.

[/caption]

For us carbon-based life forms, carbon is a fairly important part of the chemical makeup of the Universe. However, carbon and oxygen were not created in the Big Bang, but rather much later in stars. How much later? In a surprising find, scientists have detected carbon much earlier in the Universe’s history than previously thought.

Researchers from Ehime University and Kyoto University have reported the detection of carbon emission lines in the most distant radio galaxy known. The research team used the Faint Object Camera and Spectrograph (FOCAS) on the Subaru Telescope to observe the radio galaxy TN J0924-2201. When the research team investigated the detected carbon line, they determined that significant amounts of carbon existed less than a billion years after the Big Bang.

How does this finding contribute to our understanding of the chemical evolution of the universe and the possibilities for life?

To understand the chemical evolution of our universe, we can start with the Big Bang. According to the Big Bang theory, our universe sprang into existence about 13.7 billion years ago. For the most part, only Hydrogen and Helium ( and a sprinkle of Lithium) existed.

So how do we end up with everything past the first three elements on the periodic table?

Simply put, we can thank previous generations of stars. Two methods of nucleosythesis (element creation) in the universe are via nuclear fusion inside stellar cores, and the supernovae that marked the end of many stars in our universe.

Over time, through the birth and death of several generations of stars, our universe became less “metal-poor” (Note: many astronomers refer to anything past Hydrogen and Helium as metals”). As previous generations of stars died out, they “enriched” other areas of space, allowing future star-forming regions to have conditions necessary to form non-star objects such as planets, asteroids, and comets. It is believed that by understanding how the universe created heavier elements, researchers will have a better understanding of how the universe evolved, as well as the sources of our carbon-based chemistry.

So how do astronomers study the chemical evolution of our universe?

By measuring the metallicity (abundance of elements past Hydrogen on the periodic table) of astronomical objects at various redshifts, researchers can essentially peer back into the history of our universe. When studied, redshifted galaxies show wavelengths that have been stretched (and reddened, hence the term redshift) due to the expansion of our universe. Galaxies with a higher redshift value (known as “z”) are more distant in time and space and provide researchers information about the metallicity of the early universe. Many early galaxies are studied in the radio portion of the electromagnetic spectrum, as well as infra-red and visual.

The research team from Kyoto University set out to study the metallicity of a radio galaxy at higher redshift than previous studies. In their previous studies, their findings suggested that the main era of increased metallicity occurred at higher redshifts, thus indicating the universe was “enriched” much earlier than previous believed. Based on the previous findings, the team then decided to focus their studies on galaxy TN J0924-2201 – the most distant radio galaxy known with a redshift of z = 5.19.

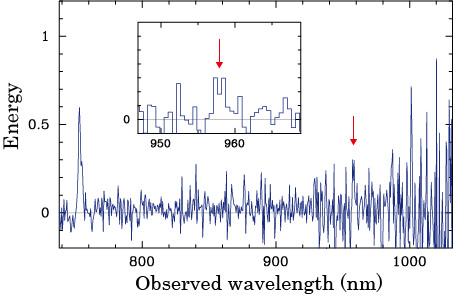
The deep optical spectrum of TN J0924-2201 obtained with FOCAS on the Subaru Telescope. The red arrows point to the carbon emission line.

The research team used the FOCAS instrument on the Subaru Telescope to obtain an optical spectrum of galaxy TN J0924-2201. While studying TN J0924-2201, the team detected, for the first time, a carbon emission line (See above). Based on the detection of the carbon emission line, the team discovered that TN J0924-2201 had already experienced significant chemical evolution at z > 5, thus an abundance of metals was already present in the ancient universe as far back as 12.5 billion years ago.

If you’d like to read the team’s findings you can access the paper Chemical properties in the most distant radio galaxy – Matsuoka, et al at: http://arxiv.org/abs/1107.5116

Source: NAOJ Press Release

First Look At Interstellar Turbulence

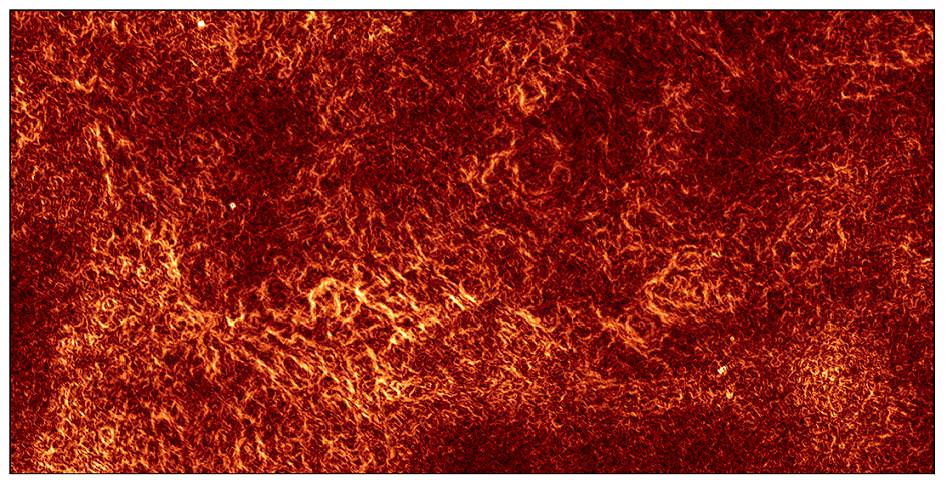
Regions of gas where the density and magnetic field are changing rapidly as a result of turbulence. [Technical note: the image shows the gradient of linear polarisation over an 18-square-degree region of the Southern Galactic Plane.] Image credit – B. Gaensler et al. Data: CSIRO/ATCA

[/caption]

All of the space that surrounds us isn’t empty. We’ve always known the Milky Way was filled with great areas of turbulent gas, but we’ve never been able to see them… Until now. Professor Bryan Gaensler of the University of Sydney, Australia, and his team used a CSIRO radio telescope in eastern Australia to create this first-ever look which was published in Nature today.

“This is the first time anyone has been able to make a picture of this interstellar turbulence,” said Professor Gaensler. “People have been trying to do this for 30 years.”

So what’s the point behind the motion? Turbulence distributes magnetism, disperses heat from supernova events and even plays a role in star formation.

“We now plan to study turbulence throughout the Milky Way. Ultimately this will help us understand why some parts of the galaxy are hotter than others, and why stars form at particular times in particular places,” Professor Gaensler said.

Employing CSIRO’s Australia Telescope Compact Array because “it is one of the world’s best telescopes for this kind of work,” as Dr. Robert Braun, Chief Scientist at CSIRO Astronomy and Space Science, explained, the team set their sights about 10,000 light years away in the constellation of Norma. Their goal was to document the radio signals which emanate from that section of the Milky Way. As the radio waves pass through the swirling gas, they become polarized. This changes the direction in which the light waves can “vibrate” and the sensitive equipment can pick up on these small differentiations.

By measuring the polarization changes, the team was able to paint a radio portrait of the gaseous regions where the turbulence causes the density and magnetic fields to fluctuate wildly. The tendrils in the image are also important, too. They show just how fast changes are occurring – critical for their description. Team member Blakesley Burkhart, a PhD student from the University of Wisconsin, made several computer simulations of turbulent gas moving at different speeds. By matching the simulations with the actual image, the team concluded “the speed of the swirling in the turbulent interstellar gas is around 70,000 kilometers per hour — relatively slow by cosmic standards.”

Original Story Source: CSIRO Astronomy and Space Science News Release. For Further Reading: Low Mach number turbulence in interstellar gas revealed by radio polarization gradients.

Find Out What the Astronauts on the Space Station Are Doing Right Now

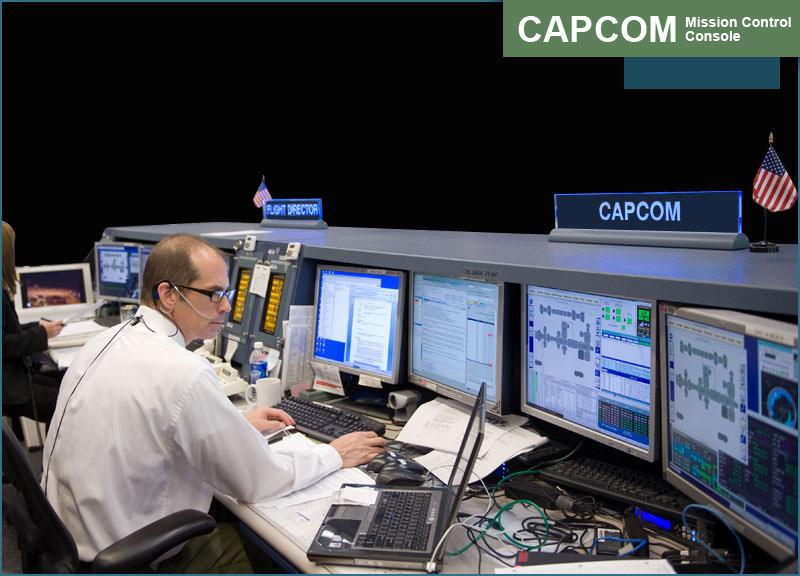
A view of the Capcom station in ISS Mission Control at Johnson Space Center. Credit: NASA

[/caption]

Want to know what science experiments the astronauts are working on in the International Space Station today? Interested in looking over the shoulder of the flight controllers in Houston? There’s a new website that allows you to follow all the activities on the space station in real time, from seeing exactly what each crew member is doing, to watching live video from space, to seeing the displays on consoles in the ISS Mission Control at Johnson Space Center. Called Space Station Live!, the new interactive website is part of NASA’s Open Government Initiative, an “effort to increase public access to government information and services through live data feeds and data sets.”

The website is still in beta, so there are a few bugs (the video feed is sometimes blank and not all the links work all the time) but the data available and interactive features are enough to make a space nerd swoon. And soon, there will be apps available so all the data will be accessible with mobile devices, according to NASA Spaceflight.com. There is historical information on the assembly of the International Space Station, a large diagram showing the current configuration ISS, access to operational handbooks, an audio feed of the communications between the station and mission control, and much more. Of course, all the sensitive and classified information and materials are not available, but this is a brand new and unprecedented way for NASA to share real-time data with the public. There are also educator resources and soon there will be a programming interface to allow teachers to integrate live data and science from the ISS in their classroom projects.

A good place to start is in the crew timeline area, which provides information for each crew member, what time it is on the ISS, a video feed, and information on the ISS orbital status (is the ISS in orbital daylight or darkness?)

Have fun!

Planetary Pinball – Uranus Gets The “Tilt”

Between 3 to 4 billion years ago, a body twice the size of Earth impacted Uranus, knocking the ice giant onto its side. Image Credit: Jacob A. Kegerreis/Durham University
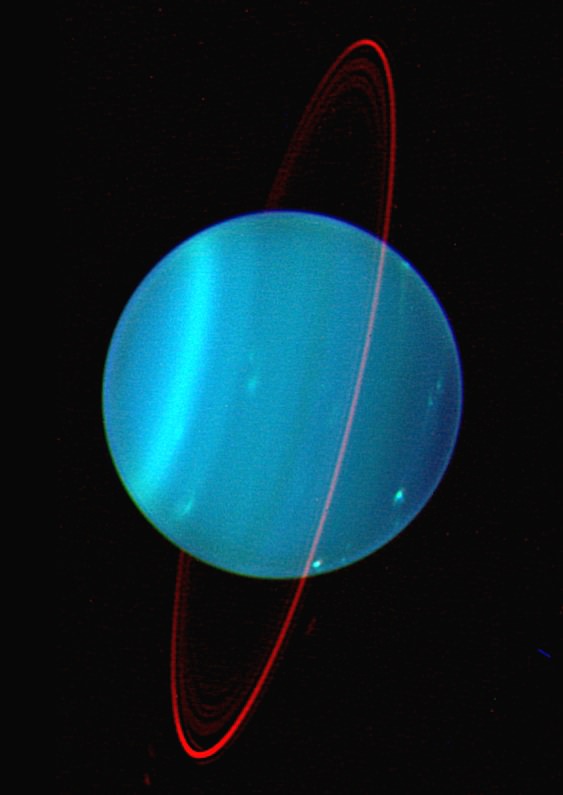
Near-infrared views of Uranus reveal its otherwise faint ring system, highlighting the extent to which it is tilted. Credit: Lawrence Sromovsky, (Univ. Wisconsin-Madison), Keck Observatory.

[/caption]

Popular theory on how Uranus ended up with a highly eccentric axis has always been pretty standard – one giant blow. However, at today’s (October 6) EPSC-DPS Joint Meeting in Nantes, astronomers are thinking things may have occurred slightly differently. Instead of a singular impact, the glowing blue-green gas giant may have been the victim of a series of smaller punches.

At a 98 degree inclination, Uranus and its satellites have always been somewhat of a mystery to planetary scientists. While many of the Solar Systems planets have an inclined axis, none can compare with nearly being on its side. It has always been popular conjecture that Uranus was plastered that way at some point in its evolution by a body a few times larger than Earth. While this seems plausible, only one hole remains in the theory. Why did its moons take on the same inclination instead of staying in their original position?

This long-standing puzzle may have been solved by an international team of scientists led by Alessandro Morbidelli (Observatoire de la Cote d’Azur in Nice, France). Their theory relies on computer modeling – and the thought the impact might have occurred while Uranus was still forming. If the simulations are correct and the strike happened when the planet was still surrounded by a protoplanetary disk, ” the disk would have reformed into a fat doughnut shape around the new, highly-tilted equatorial plane. Collisions within the disk would have flattened the doughnut, which would then go onto form the moons in the positions we see today.”

But that’s not a neat answer. Just like throwing a tilt into pinball, the game changes. In this new scheme, the moons displayed retrograde motion – precisely the opposite of the way things are now. So what’s a player to do? Change the game again by re-arranging the parameters. By adding multiple strikes to Uranus – instead of just one large – the satellites now behave as we observe them.

Of course, when you “tilt” the game is over, and the new research doesn’t jive with current theories of planetary formation. This may mean re-writing the rules again. Morbidelli elaborates: “The standard planet formation theory assumes that Uranus, Neptune and the cores of Jupiter and Saturn formed by accreting only small objects in the protoplanetary disk. They should have suffered no giant collisions. The fact that Uranus was hit at least twice suggests that significant impacts were typical in the formation of giant planets. So, the standard theory has to be revised.”

That deaf, dumb and blind kid… Sure plays a mean pinball!

Original Story Source: Europlanet News Release.

Comet Elenin Disintegrated?

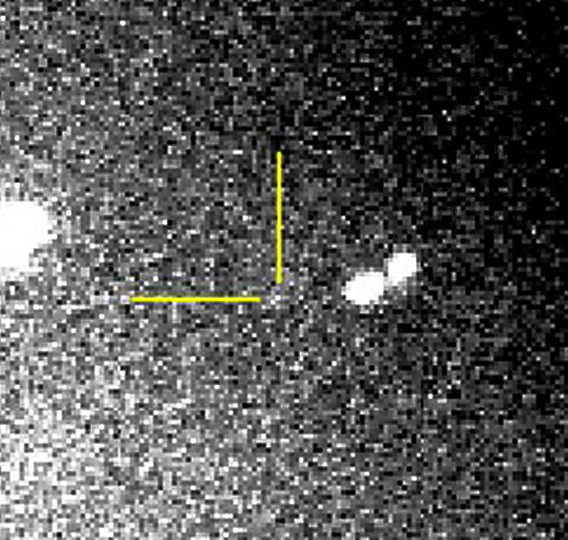
This could be our last look at Comet Elenin...

[/caption]

Comet Elenin, the supposed “doomsday comet” that has inspired so much confusion and controversy since its discovery in December 2010,  may have broken apart completely during its recent pass around the Sun.

Discoverer Leonid Elenin posted the image above earlier today on his website, SpaceObs.org. Taken with the International Scientific Optical Network’s 18″ telescope in New Mexico (ISON-NM), it shows what may be the remnants of Elenin, a faint cloud barely visible after its exit from behind the Sun.

“On the left you can see possible position of this ‘cloud’,” Leonid writes. “Brightness of this object does not exceed 18m, which means what now, magnitude of the comet is lower then predicted on 12m. Hopefully in the near future debris of the comet will be observed on a large telescopes, and perhaps we’ll see some details of this ‘cloud’.”

Ground-based viewing of Elenin’s remains may be hampered over the next few days by the full Moon, he adds.

Although many rumors have been spread about the catastrophic danger Elenin poses to humans, in reality the comet was never a threat. Not expected to come any closer than 22 million miles (35 million km) to Earth, it’s been previously speculated that Elenin would most likely disintegrate during its current orbit.

“I don’t know why fearmongers [chose] my comet,” Leonid Elenin told Universe Today. “I received many letters from scared people. But if they believe in conspiracy theories I can’t help them.”

Hopefully this helps put some of the doomsday nonsense to rest!

See Leonid’s latest post on his site here.

Image: ISON-NM Observatory

Uncloaking Type Ia Supernovae

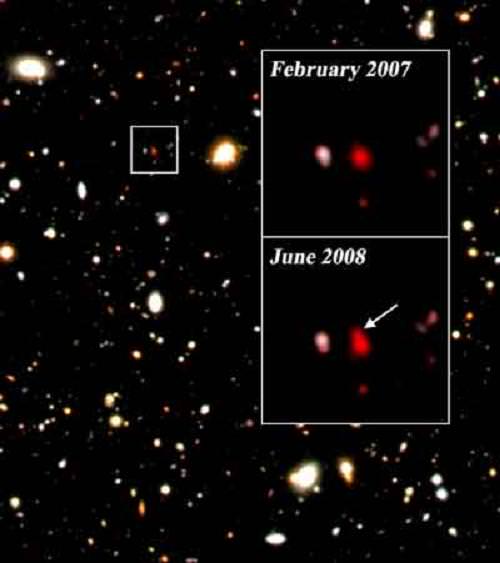
This three-color composite of a portion of the Subaru Deep Field shows mostly galaxies with a few stars. The inset shows one of the 10 most distant and ancient Type Ia supernovae discovered by the American, Israeli and Japanese team.

Type Ia supernovae… Right now they are one of the most studied – and most mysterious – of all stellar phenomenon. Their origins are sheer conjecture, but explaining them is only half the story. Taking a look back into almost the very beginnings of our Universe is what it’s all about and a team of Japanese, Israeli, and U.S. astronomers have employed the Subaru Telescope to give us the most up-to-date information on these elementally explosive cosmic players.

By understanding the energy release of a Type Ia supernova, astronomers have been able to measure unfathomable distances and speculate on dark energy expansion. It was popular opinion that what caused them was a white dwarf star pulling in so much matter from a companion that it finally exploded, but new research points in a different direction. According to the latest buzz, it may very well be the merging of two white dwarfs.

“The nature of these events themselves is poorly understood, and there is a fierce debate about how these explosions ignite,” said Dovi Poznanski, one of the main authors of the paper and a post-doctoral fellow at the University of California, Berkeley, and Lawrence Berkeley National Laboratory.

“The main goal of this survey was to measure the statistics of a large population of supernovae at a very early time, to get a look at the possible star systems,” he said. “Two white dwarfs merging can explain well what we are seeing.”

Can you imagine the power behind this theory? The Type Ia unleashed a thermonuclear reaction so strong that it is able to be traced back to nearly the beginning of expansion after the Big Bang. By employing the Subaru telescope and its prime focus camera (Suprime-Cam), the team was able to focus their attention four times on a small area named the Subaru Deep Field. In their imaging they caught 150,000 individual galaxies containing a total of 40 Type Ia supernova events. One of the most incredible parts of these findings is that these events happened about five times more frequently in the early Universe. But no worries… Even though the mechanics behind them are still poorly understood, they still serve as “cosmic distance markers”.

“As long as Type Ias explode in the same way, no matter what their origin, their intrinsic brightnesses should be the same, and the distance calibrations would remain unchanged.” says Alex Filippenko, UC Berkeley professor of astronomy.

Original Story Source: University of Berkeley News Release. For Further Reading: National Astronomical Observatory of Japan: Subaru News Release.