To help celebrate the start of the Dawn mission to Vesta, NASA is organizing a “Vesta Fiesta!” After traveling the solar system for nearly four years, the Dawn spacecraft is now entering the “science” phase of its mission. Given the fact that Dawn is the first spacecraft to orbit an object in the asteroid belt, a fiesta is in order! (Here in Arizona we relish ANY excuse to fiesta!) Between August 5 and August 7, 2011, Vesta Fiestas will be held to help celebrate Dawn’s arrival at Vesta.
NASA is encouraging fans of the Dawn mission to join the celebration by hosting events at local clubs, schools, museums or societies. NASA has also provided numerous resources that are free to use for Vesta Fiestas, including games and activities, media resources (invitations, audio files, observing info, etc.) and live video on August 6th from the “Flagship” celebration at JPL in Pasedena, California.
After studying the asteroid Vesta, Dawn will continue on to study dwarf planet Ceres, also in the main asteroid belt between Mars and Jupiter.
To help encourage participation, I humbly offer my Spicy Fiesta Cheese Dip:
Ingredients:
1lb sausage (breakfast or Italian)
1 block of Velveeta (cut into ~1 inch square cubes)
1 jar of your favorite salsa and (Optional) 1 small can (4oz?) of diced green chile peppers – Not Red Hot Chili Peppers! Flea, Chad and Anthony hate being diced.)
Procedure: Place 1/2 of the cubed Velveeta in a crock pot, set to “high”. Cook sausage and diced peppers completely in a skillet, add cooked sausage and peppers to the crock pot along with the salsa and remaining velveeta. Leave crock pot on “high” until all the Velveeta is melted, then set to “low” – stir often! Serve with tortilla chips and an ice cold drink of your choice.
If you’d like to learn more about the Dawn mission to Vesta and Ceres, you can visit the Dawn website.
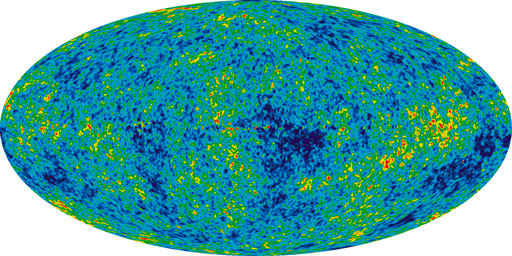
Seven Year Microwave Sky (Credit: NASA/WMAP Science Team)
[/caption]The multiverse theory is famous for its striking imagery. Just imagine our own Universe, drifting among a veritable sea of spontaneously inflating “bubble universes”, each a self-contained and causally separate pocket of higher-dimensional spacetime. It’s quite an arresting picture. However, the theory is also famous for being one of the most criticized in all of cosmology. Why? For one, the idea is remarkably difficult, if not downright impossible, to test experimentally. But now, a team of British and Canadian scientists believe they may have found a way.
Attempts to prove the multiverse theory have historically relied upon examination of the CMB radiation, relic light from the Big Bang that satellites like NASA’s Wilkinson Microwave Anisotropy Probe, or WMAP, have probed with incredible accuracy. The CMB has already allowed astronomers to map the network of large-scale structure in today’s Universe from tiny fluctuations detected by WMAP. In a similar manner, some cosmologists have hoped to comb the CMB for disk-shaped patterns that would serve as evidence of collisions with other bubble universes.
Seven Year Microwave Sky (Credit: NASA/WMAP Science Team)
Now, physicists at University College London, Imperial College London and the Perimeter Institute for Theoretical Physics have designed a computer algorithm that actually examines the WMAP data for these telltale signatures. After determining what the WMAP results would look like both with and without cosmic collisions, the team uses the algorithm to determine which scenario fits best with the actual WMAP data. Once the results are in, the team’s algorithm performs a statistical analysis to ensure that any signatures that are detected are in fact due to collisions with other universes, and are unlikely to be due to chance. As an added bonus, the algorithm also puts an upper limit on the number of collision signatures astronomers are likely to find.
While their method may sound fairly straightforward, the researchers are quick to acknowledge the difficulty of the task at hand. As UCL researcher and co-author of the paper Dr. Hiranya Peiris put it, “It’s a very hard statistical and computational problem to search for all possible radii of the collision imprints at any possible place in the sky. But,” she adds, “that’s what pricked my curiosity.”
The results of this ground-breaking project are not yet conclusive enough to determine whether we live in a multiverse or not; however, the scientists remain optimistic about the rigor of their method. The team hopes to continue its research as the CMB is probed more deeply by the Planck satellite, which began its fifth all-sky survey on July 29. The research is published in Physical Review Letters and Physical Review D.
This plot shows 3-days of 5-minute solar x-ray flux values measured on the SWPC primary GOES satellite. Credit: NOAA/SWPC
Early today, (Aug 3, 2011) two active regions on the Sun, sunspot 1261 and 1263 unleashed solar flares, which was captured by NASA’s Solar Dynamics Observatory. The above video shows an M6 class flare from 1261 in a couple of different wavelengths. SolarstormWatch, a citizen science project through the Royal Observatory in Greenwich, England predicts the solar storm from the larger flare to reach Earth at 15:00 UTC on August 5, 2011, and also predict direct hit on Earth.
See below for a graph of the activity:
[/caption]
Solar storms are a concern if they hit Earth directly since under the right conditions, they can create extra electrical currents in Earth’s magnetosphere. The electrical power grid is vulnerable to any extra currents, which can infiltrate high-voltage transmission lines, causing transformers to overheat and possibly burn out.
Check SpaceWeather.com and the National Weather Service’s Space Weather Prediction Center for more information.
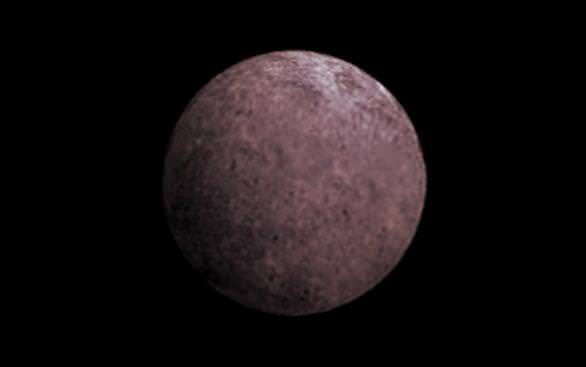
An artist's conception of 2007 OR10, nicknamed Snow White. Astronomers suspect that its rosy color is due to the presence of irradiated methane. [Credit: NASA]
Discovered in 2007 by former graduate student Meg Schwamb, dwarf planet Snow White orbits at the edge of the Solar System. Roughly half the size of Pluto, its color was nicknamed erroneously. At one time it was surmised the diminutive planet was a white, icy world broken away from a larger planet, but further studies show it may be the most red of all.
Astronomers at the California Institute of Technology (Caltech) have been taking a much closer look at dwarf planet 2007 OR10. This Kuiper Belt Object is a frozen world, covered in water ice which may have originated volcanically. While the slush covered rock could be assumed to be white, a more rosy hue is in order. Why? According to the new research, Snow White may have a thin atmosphere of methane that’s methodically dissipating.
“You get to see this nice picture of what once was an active little world with water volcanoes and an atmosphere, and it’s now just frozen, dead, with an atmosphere that’s slowly slipping away,” says Mike Brown, the Richard and Barbara Rosenberg Professor and professor of planetary astronomy, who is the lead author on a paper to be published in the Astrophysical Journal Letters describing the findings. “With all of the dwarf planets that are this big, there’s something interesting about them—they always tell us something,” Brown says. “This one frustrated us for years because we didn’t know what it was telling us.”
When dwarf planet 2007 OR10 was first discovered, the best instrument at the time for study was the Near Infrared Camera (NIRC) at the Keck Observatory. But, it wouldn’t be long until Adam Burgasser, a former graduate student of Brown’s and now a professor at UC San Diego, helped design a new instrument called the Folded-port Infrared Echellette (FIRE) to study Kuiper Belt Objects. Last fall, Brown, Burgasser, and postdoctoral scholar Wesley Fraser put FIRE to the test with the 6.5-meter Magellan Baade Telescope in Chile to take a closer look at Snow White. As they had surmised, the little planet was red – but what they weren’t expecting was the presence of water ice. “That was a big shock,” Brown says. “Water ice is not red.”
Is Snow White alone in its rose garden? The answer is no. A few years earlier Brown also discovered another dwarf planet – Quaoar – which had both a red spectrum and water ice. Because of its small size, Quaoar couldn’t hold on to an atmosphere. Over its evolutionary period, the volatile compounds were lost to space, leaving only methane which appears red. Because the spectrum of both small planets are similar, the conclusion is they both share similar properties. “That combination—red and water—says to me, ‘methane,'” Brown explains. “We’re basically looking at the last gasp of Snow White. For four and a half billion years, Snow White has been sitting out there, slowly losing its atmosphere, and now there’s just a little bit left.”
But the team is being cautious for now. While findings point to water ice, the presence of methane isn’t yet documented and will need further studies with larger telescopes like Keck. If their hypothesis turns out to be true, Snow White will join Quaoar as one of two dwarfs capable of keeping their volatile natures intact. Next up for the team is renaming 2007 OR10 since “white” no longer describes it. Before the discovery of water ice and the possibility of methane, “2007 OR10” might have sufficed for the astronomy community, since it didn’t seem noteworthy enough to warrant an official name. “We didn’t know Snow White was interesting,” Brown says. “Now we know it’s worth studying.”
Original Story Source: Caltech News Release. For further reading: Mike Brown’s Planets.
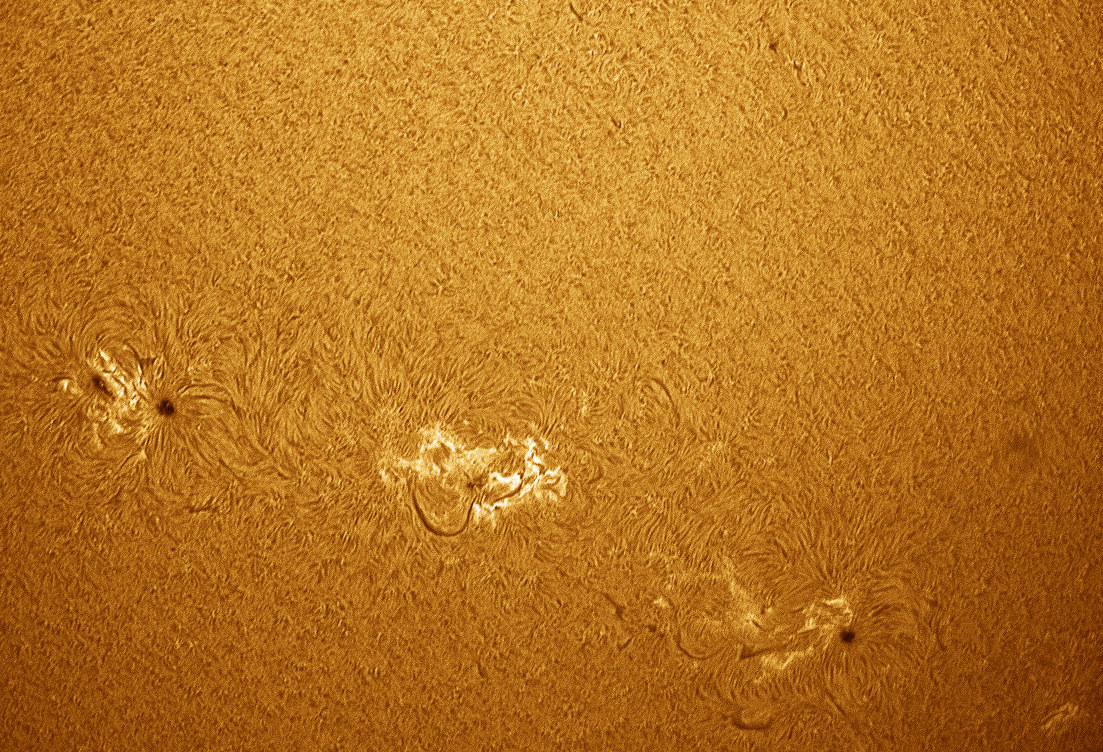
Active regions on the Sun on August 1, 2011. Credit: César Cantú, Chilidog Observatory.
[/caption]
The summer Sun (for us in the northern hemisphere) is getting active! Here are images and videos of recent activity, which include sunspots and an M-class flare. Above is a close-up look at four active regions taken by César Cantú from the Chilidog Observatory in Monterrey, Mexico.
Below, see a strong but brief M9-class solar flare which occurred on July 31, 2011 from Active Region 1261, captured by the Solar Dynamics Observatory. Scientists from SDO say that because it was brief it appears not to have hurled a large coronal mass ejection (CME) outwards.
The Sun in four different wavelengths. Credit: César Cantú from the Chilidog Observatory. Click for larger version.
Here’s a comparative look at the sunspots from August 1, 2011, taken by César Cantú from the Chilidog Observatory in Mexico. “Taking advantage of the program that I could attach Lucam Recorder in AVI (video) different bands of light, here is this comparative look in negative, white light, the calcium band and hydrogen-alpha band,” said Cantú. He used a 90 Coronado telescope and camera with dual ektalon DMK41.
Here’s a video clip from SDO showing an interesting alignment of three good-sized sunspot groups that appear to be marching across the Sun, taken July 28-29, 2011.
See more, and keep up with all the activity on the Sun at the SDO website.
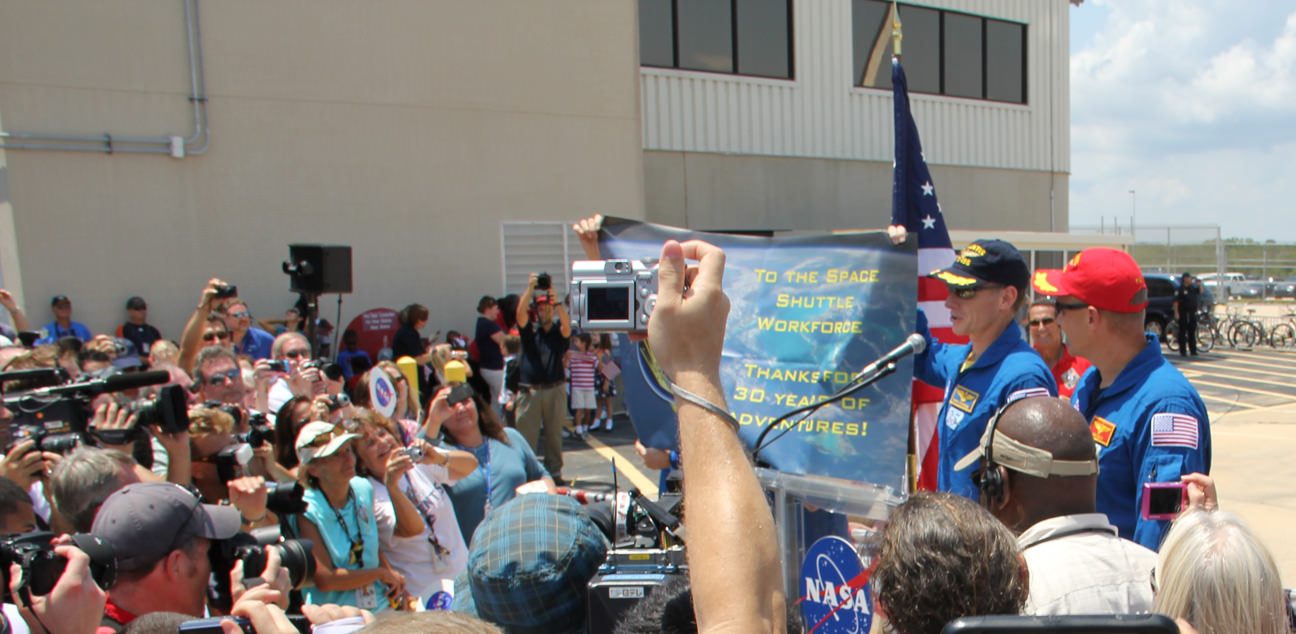
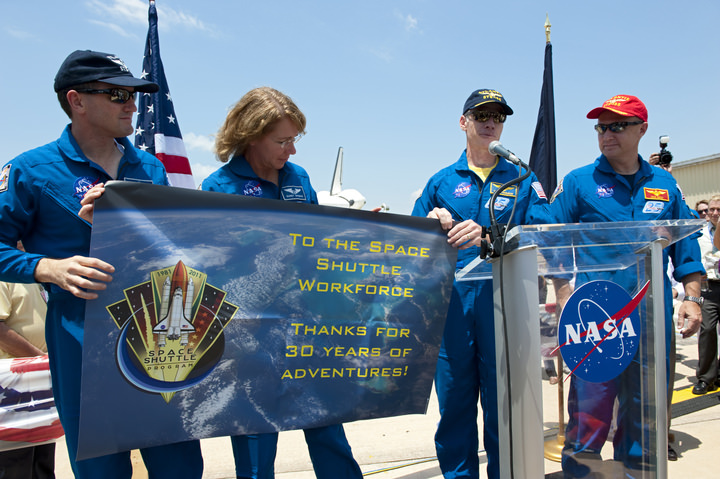
To The Shuttle Workforce – Thanks for 30 Years of Adventures. Commemorative banner flown to the ISS and back by the STS-135 shuttle crew, in thanks for more than 30 years of hard work and dedication by the Space Shuttle workforce preparing the space shuttles for 135 missions to space. STS-135 Crew from left; Mission Specialists Sandra Magnus and Rex Walheim, Pilot Doug Hurley and Shuttle Commander Chris Ferguson
[/caption]
Following the majestic predawn touchdown of Space Shuttle Atlantis at the Kennedy Space Center (KSC) to close out the Space Shuttle Era, the final crew of Atlantis, NASA Administrator Charles Bolden and KSC Director Bob Cabana thanked the Space Shuttle workforce for their dedication and hard work at an employee appreciation event held outside the processing hangers where the orbiters were prepared for the 135 shuttle missions flown by NASA over more than thirty years.
The four person crew of Atlantis on the STS-135 mission flew a special commemorative banner millions of miles to the International Space Station and back in honor of the thousands of workers who processed, launched and landed America’s five space shuttles. They unfurled the banner at the employee event at KSC in tribute to the shuttle workers.
“It’s great to be here in sunny Florida,” said STS 135 Commander Chris Ferguson. “Mike Leinbach [ the Space Shuttle Launch Director] said there was no way he’d let us land in California.”
“We want to express our gratitude on behalf of the astronaut office for everything you have done here at KSC, the safety you have built into the vehicles, the meticulous care that you take of the orbiter. As soon as we got on orbit, I was absolutely amazed that everything in Atlantis works so well. Everything looks beautiful on the inside.”
STS-135 crew and space flown tribute banner to Space Shuttle workforce. Credit: NASA
“I hope you all believe that every time we go, we take a little bit of every one of you with us,” Ferguson emphasized.
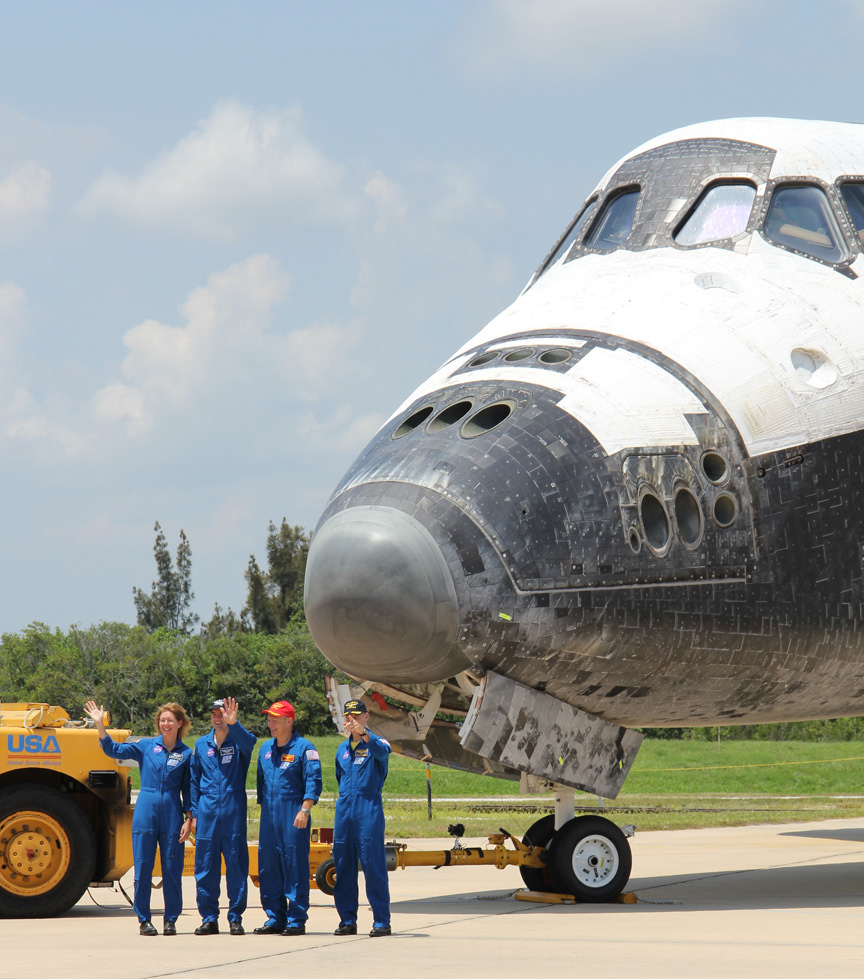
Atlantis was parked at the event as a backdrop for photo opportunities with the thousands of shuttle workers in attendance – along with over a hundred journalists including the Universe Today team of Alan Walters and Ken Kremer.
“Like Chris said, our one landing option was getting back to Florida and you all rather than anywhere else. It felt like being home again. Thank you for everything you have all done over the last 30+ years,” said Doug Hurley.
“We treated Atlantis with the utmost respect because we see firsthand how you process this vehicle and it is your baby,” said Rex Waldheim. “It is clean and well cared for. We did that for you because you all did such a great job preparing it for us.”
“You are such a special work force,” added Sandy Magnus. “There is no workforce like the space program workforce anywhere in the world. The pride, care, dedication and passion you take in your work is what makes it possible to have these very challenging missions and to succeed. You have to do everything right all of the time. And you DO. And you make it look easy!! Congratulations!”
The STS-135 crew then unfurled the colorful banner taken to the ISS aboard Atlantis to commemorate NASA’s Space Shuttle Era.
“We took this banner with us to space and this is our way of telling you that you guys rock ! We will present this to Mike Leinbach and Bob Cabana as just a small token of our appreciation for all the work you’ve done for us. Thank you for such a wonderful vehicle,” Ferguson summed up.
KSC Director Bob Cabana thanks the Shuttle Workforce. Credit Alan Walters (awaltersphoto.com)
The crew then waved good bye to the thousands of shuttle workers, posed with Atlantis one last time and departed with their families for a homecoming celebration at their training base at the Johnson Space Center in Houston, Texas.
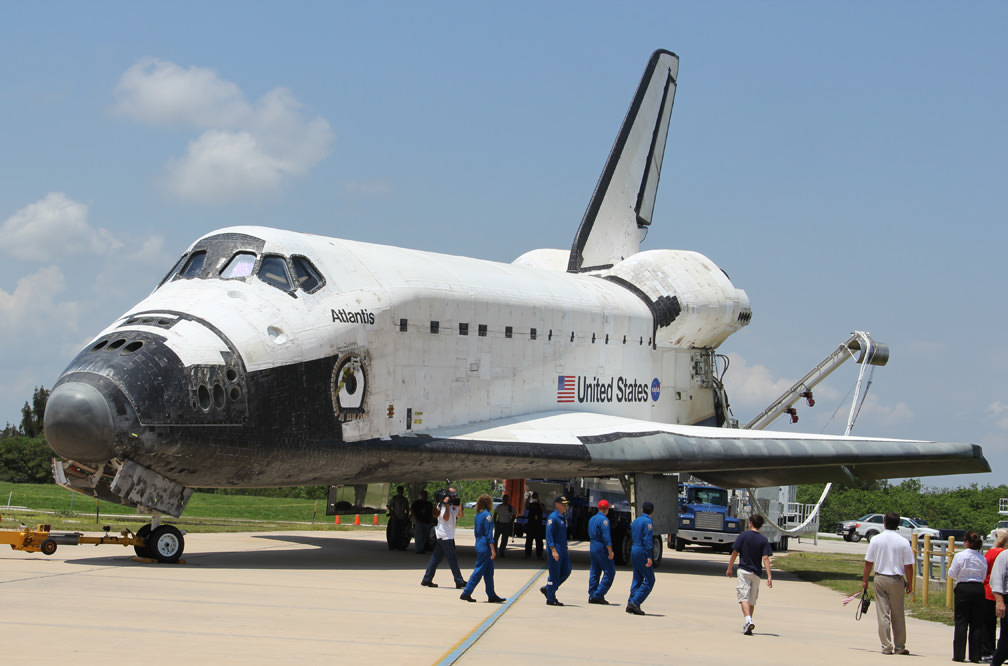
Atlantis was then towed a few hundred yards (meters) and came to rest inside the Orbiter Processing Facility to conclude her final spaceflight journey as the last of NASA’s flight worthy Space Shuttle Orbiters. She has began decommissioning activities due to last several months to prepare for her future retirement home at the Kennedy Space Center Visitor Complex (KSCVC) just a few miles (km) away. STS-135 crew pose with Atlantis and wave farewell to shuttle workforce at KSC. Credit: Ken Kremer (kenkremer.com
Atlantis permanent new abode at KSCVC is set to open in 2013 where she will be genuinely displayed bearing scorch marks from reentry and as though “In Flight” with payload bays doors wide open for the general public to experience reality up close.
For some 1500 shuttle workers, the day’s proceedings were both joyous and bittersweet – as their last full day of employment and last chance to bask in the glow of the triumphant conclusion of the Shuttle Era.
NASA Administrator Charles Bolden congratulates the Shuttle Workforce. Credit Alan Walters (awaltersphoto.com)STS-135 say farewell to Atlantis and shuttle workforce at KSC. Credit: Ken KremerNASA shuttle workers welcome STS-135 crew at employee appreciation event. Credit Alan Walters (awaltersphoto.com)
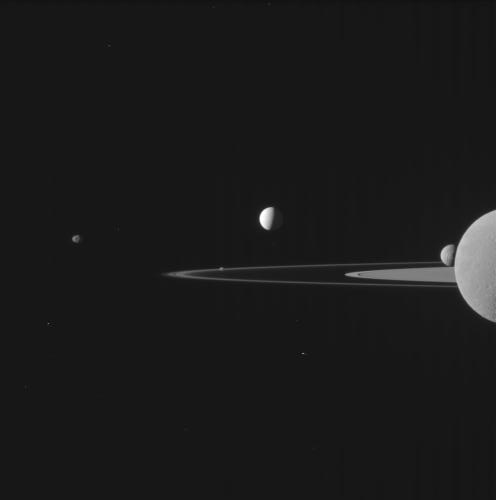
This Cassini raw image shows a portion of Saturn's rings along with several moons. How many can you find? Credit: NASA/JPL/Space Science Institute
[/caption]
This stunning new Cassini image was captured on July 29, 2011, and shows a portion of Saturn’s rings along with several moons dotting the view. How many moons can you find, and can you name them?
See below for a color version of this image, put together by our own Jason Major!
Saturns moons and rings, in color. Credit: NASA / JPL / SSI. Edited by Jason Major. Click for larger version.
Jason shares on his Flickr page the process of how he edited the image. As Jason says, it’s a moon flash mob!
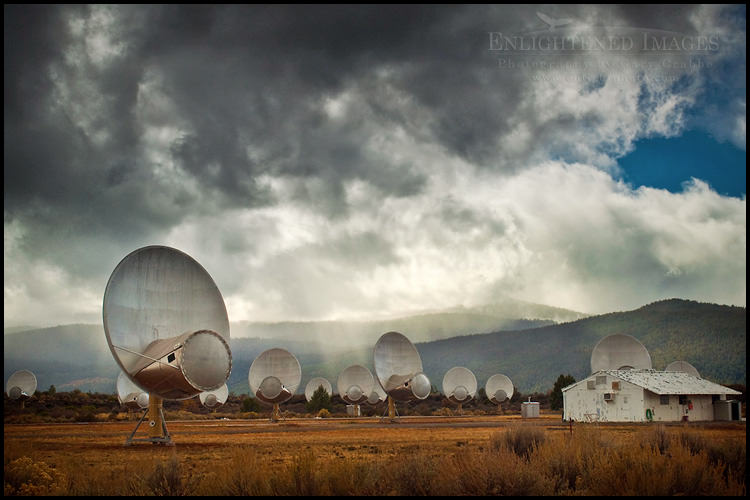
UC Hat Creek Radio Observatory (HRCO). Image credit: Gary Crabbe
[/caption]
Photographer Gary Crabbe captured this beautiful image of the Hat Creek Radio Observatory in Northern California. Here’s what Gary had to say about the photograph:
I was working on a book project about California history and traveling between locations in Northern California. I’ve always been an armchair astronomy and cosmology buff, so when by chance I whizzed by the sign that said something like UC Hat Creek Radio Observatory (HRCO) at 55 MPH, I knew immediately what it was. I made a quick U-Turn and followed the signs to the entrance to the Observatory. I was delighted to see that the public was welcomed to take self-guided tours on limited daytime hours M-F, or by special arrangement.
I highly recommend you check out Gary’s website and see the rest of his beautiful photographs.
Artist's impression of the Solar Nebula. Image credit: NASA
[/caption]
It has been known for several years that stars hosting planets are generally more rich in elements heavier than hydrogen and helium, known in astronomy as “metals”. These heavy elements help to form the cores of the forming planets and accelerate the formation process. However, a new study has helped to suggest that the opposite may also be true: Planets may make their host stars less metal rich than they should otherwise be.
The new research is led by Ivan Ramirez at the Carnegie Institution for Science. In it, the team analyzed the unusual exo-planetary system 16Cygni. The star system itself is a triple star system composed of two stars similar to the sun (A and B) as well as a red dwarf (C). The solar A star and the red dwarf form a tight binary system with the sun-like B star in a wider orbit of nearly 900 AU. 16CygniB was discovered to be host to a Jovian planet in 1996 making it one of the first systems known to contain an extrasolar planet.
The study analyzed the spectra of the two solar type stars and found that the one around which the planet orbits was notably lower in metals than the one in the binary orbit with the red dwarf. Because both stars should have formed from the same molecular cloud astronomers assume their initial compositions should be identical. Since both are similar masses, they should also have evolved similarly in their main-sequence life which should rule out divergence in their chemical fingerprints.
Similar properties have been noted in a 2009 paper by astronomers at the university of Porto in Portugal. In that study, the team compared our own Sun to other stars of similar composition and age. They discovered that the Sun had an odd feature: It was notably depleted in elements known as refractory metals when compared to volatile elements with low melting and boiling temperatures. The team suggested that those missing elements may have been stolen by forming planets. The newer study makes the same proposition.
Both teams note that the effect is not conclusive. They consider that 16CygA may have been polluted by heavy elements, possibly by the accretion of a planet or similar material. However, they note that if this was the case, they should also expect to see an additional amount of lithium. Yet the lithium abundance for the two stars match. The 2009 paper considers similar cases. They consider that the solar nebula may have been seeded by a nearby supernova that would enhance the abundances, but the enhanced elements do not seem to match the expected productions for any type of supernova. Still, with such a small number of systems for which this effect has been discovered, such cases of special pleading are still within the realm of statistical possibility. Future work will undoubtedly search for similar effects in other planetary systems. If confirmed, such elemental oddities could be considered as a sign of planetary formation.
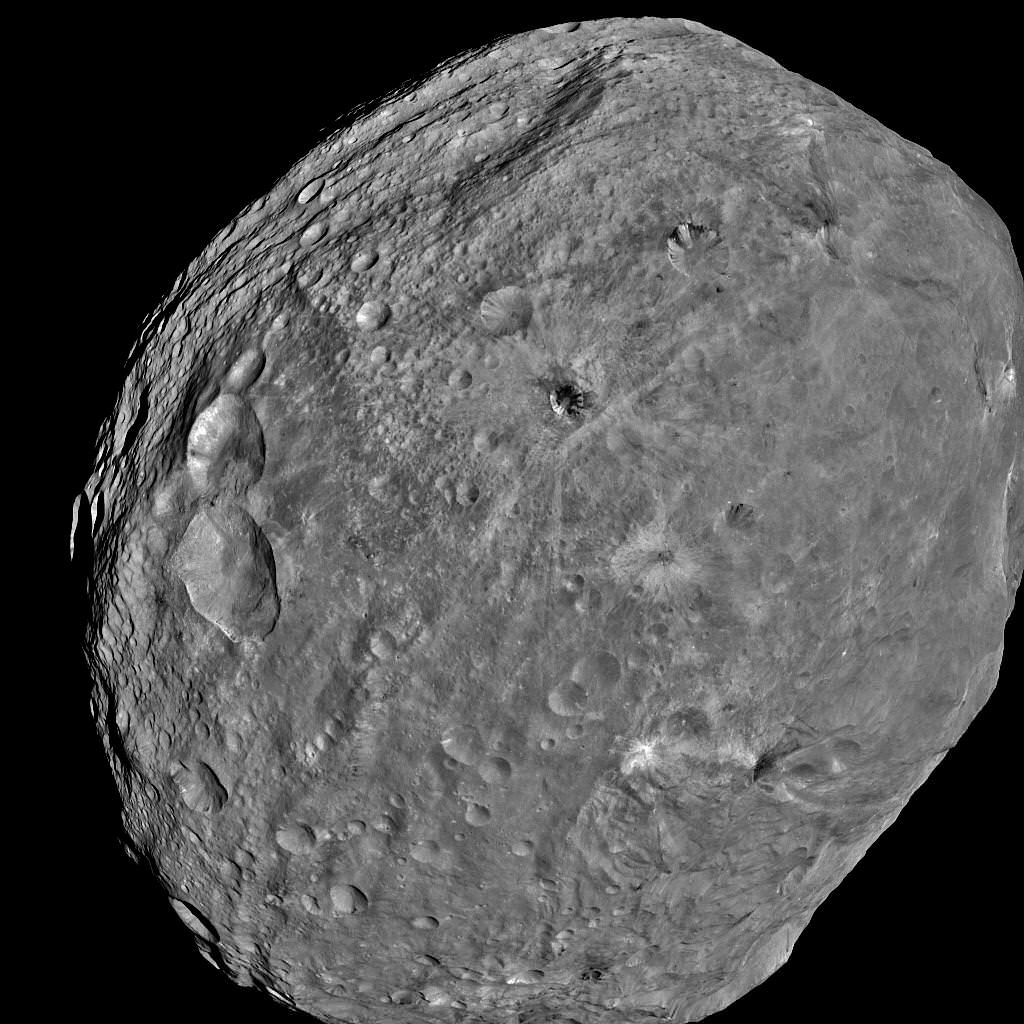
Dawn snaps First Full-Frame Image of Asteroid Vesta. NASA's Dawn spacecraft obtained this image of the giant asteroid Vesta with its framing camera on July 24, 2011. It was taken from a distance of about 3,200 miles (5,200 kilometers). Dawn entered orbit around Vesta on July 15, and will spend a year orbiting the body. After that, the next stop on its itinerary will be an encounter with the dwarf planet Ceres. The Dawn mission to Vesta and Ceres is managed by NASA's Jet Propulsion Laboratory, Pasadena, Calif. The framing cameras have been developed and built under the leadership of the Max Planck Institute for Solar System Research, Katlenburg-Lindau, Germany, with significant contributions by the German Aerospace Center (DLR) Institute of Planetary Research, Berlin, and in coordination with the Institute of Computer and Communication Network Engineering, Braunschweig, Germany. The framing camera project is funded by NASA, the Max Planck Society and DLR. Credit: NASA/JPL-Caltech/UCLA/MPS/DLR/IDA
[/caption]
NASA has just released the first full frame images of Vesta– and they are thrilling! The new images unveil Vesta as a real world with extraordinarily varied surface details and in crispy clear high resolution for the first time in human history.
Vesta appears totally alien and completely unique. “It is one of the last major uncharted worlds in our solar system,” says Dr. Marc Rayman, Dawn’s chief engineer and mission manager at NASA’s Jet Propulsion Laboratory in Pasadena, Calif. “Now that we are in orbit we can see that it’s a unique and fascinating place.”
“We have been calling Vesta the smallest terrestrial planet,” said Chris Russell, Dawn’s principal investigator at the UCLA. “The latest imagery provides much justification for our expectations. They show that a variety of processes were once at work on the surface of Vesta and provide extensive evidence for Vesta’s planetary aspirations.”
Dawn launch on September 27, 2007 by a Delta II Heavy rocket from Cape Canaveral Air Force Station, Florida. Credit: Ken Kremer
The newly published image (shown above) was taken at a distance of 3,200 miles (5,200 kilometers) by Dawn’s framing camera as the probe continues spiraling down to her initial science survey orbit of some 1,700 miles (2,700 km) altitude. The new images show the entire globe all the way since the giant asteroid turns on its axis once every five hours and 20 minutes.
Vesta and its new moon – Dawn – are approximately 114 million miles (184 million kilometers) distant away from Earth.
“The new observations of Vesta are an inspirational reminder of the wonders unveiled through ongoing exploration of our solar system,” said Jim Green, planetary division director at NASA Headquarters in Washington. The Dark Side of Vesta Captured by Dawn
NASA's Dawn spacecraft obtained this image over the northern hemisphere with its framing camera on July 23, 2011. It was taken from a distance of about 3,200 miles (5,200 kilometers) away from the giant asteroid Vesta. Credit: NASA/JPL-Caltech/UCLA/MPS/DLR/IDA
Dawn was launched atop a Delta II Heavy booster rocket in September 2007, took a gravity assist as it flew past Mars and has been thrusting with exotic ion propulsion for about 70 percent of the time ever since.
Dawn will spend 1 year collecting science data in orbit around Vesta before heading off to the Dwarf Planet Ceres.
The science team has just completed their press briefing. Watch for my more detailed report upcoming soon.
And don’t forget JUNO launches on Aug 5 – It’s an exciting week for NASA Space Science and I’ll be reporting on the Jupiter orbiter’s blastoff and more – as Opportunity closes in on Spirit Point !
NASA’s groundbreaking interplanetary science is all inter connected – because Vesta and Ceres failed to form into full-fledged planets thanks to the disruptive influence of Jupiter.