[/caption]
It’s raining on Saturn! Well, kind of. Actually, not really. But there’s some really cool news about Saturn, Enceladus and water – great topics, all. The bubbly water shooting from the moon Enceladus is responsible for the “mystery” water that was found in Saturn’s upper atmosphere several years ago. Observations with the Herschel space observatory has shown that water ice from geysers on Enceladus forms a giant ring of water vapor around Saturn.
Astronomers from the ESA’s Infrared Observatory discovered the presence of trace amounts of water in Saturn’s atmosphere back in 1997, but couldn’t really find an explanation for why it was there and how it got there. Water vapor can’t be seen in visible light, but Herschel’s infrared vision was able to track down the source of the water vapor.
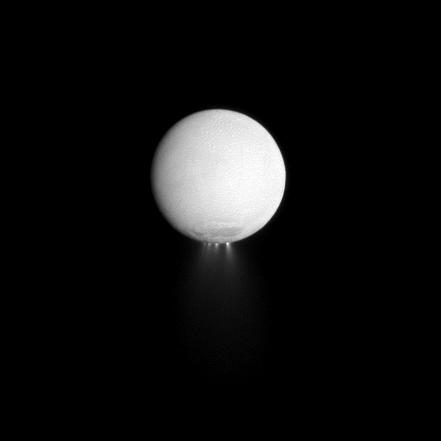
Enceladus expels around 250 kg of water vapor every second, through a collection of jets from the south polar region known as the Tiger Stripes because of their distinctive surface markings. Much of the ice ends up in orbit around Saturn, creating the hazy E ring in which Enceladus resides.
But a small amount reaches Saturn – about 3% to 5% of Enceladus’s ejected water ends up on the home planet of Saturn.
Phil Plait, The Bad Astronomer figured out that a decent rain shower on Earth is 7,000,000,000,000 times heavier than the rainfall on Saturn. So, not a lot of water makes it to Saturn.
But the fact that a moon is having an effect on its planet is unprecedented, as far as we know.
“There is no analogy to this behaviour on Earth,” said Paul Hartogh, Max-Planck-Institut für Sonnensystemforschung, in Germany, who led the collaboration on the analysis of these results. “No significant quantities of water enter our atmosphere from space. This is unique to Saturn.”
The running theory is that Enceladus has a liquid subsurface ocean of Perrier-like bubbly (and maybe salty) water. No one knows yet how much water lies beneath the moon’s surface, but it is thought that the pressure from the rock and ice layers above combined with heat from within force the water up through the Tiger Stripes. When this water reaches the surface it instantly freezes, sending plumes of ice particles hundreds of miles into space.
The total width of the torus is more than 10 times the radius of Saturn, yet it is only about one Saturn radius thick. Enceladus orbits the planet at a distance of about four Saturn radii, replenishing the torus with its jets of water.
The water in Saturn’s upper atmosphere is ultimately transported to lower levels, where it condenses. But scientists say the amounts are so tiny that the resulting clouds are not observable.
Again, despite its enormous size, this torus has it has escaped detection until now because of how water vapor is transparent to visible light but not at the infrared wavelengths Herschel was designed to see.
“Herschel has proved its worth again. These are observations that only Herschel can make,” says Göran Pilbratt, ESA Herschel Project Scientist. “ESA’s Infrared Space Observatory found the water vapour in Saturn’s atmosphere. Then NASA/ESA’s Cassini/Huygens mission found the jets of Enceladus. Now Herschel has shown how to fit all these observations together.”
Read the team’s paper here.
Source: ESA


")