[/caption]
From a Caltech Press Release:
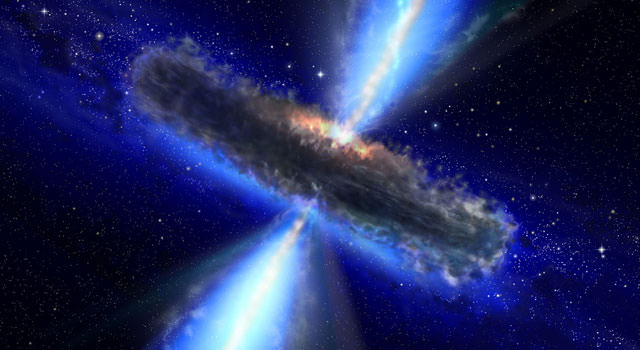
Water really is everywhere. Two teams of astronomers, each led by scientists at the California Institute of Technology (Caltech), have discovered the largest and farthest reservoir of water ever detected in the universe. Looking from a distance of 30 billion trillion miles away into a quasar—one of the brightest and most violent objects in the cosmos—the researchers have found a mass of water vapor that’s at least 140 trillion times that of all the water in the world’s oceans combined, and 100,000 times more massive than the sun.
Because the quasar is so far away, its light has taken 12 billion years to reach Earth. The observations therefore reveal a time when the universe was just 1.6 billion years old. “The environment around this quasar is unique in that it’s producing this huge mass of water,” says Matt Bradford, a scientist at NASA’s Jet Propulsion Laboratory (JPL), and a visiting associate at Caltech. “It’s another demonstration that water is pervasive throughout the universe, even at the very earliest times.” Bradford leads one of two international teams of astronomers that have described their quasar findings in separate papers that have been accepted for publication in the Astrophysical Journal Letters.
Read Bradford & team’s paper here.
A quasar is powered by an enormous black hole that is steadily consuming a surrounding disk of gas and dust; as it eats, the quasar spews out huge amounts of energy. Both groups of astronomers studied a particular quasar called APM 08279+5255, which harbors a black hole 20 billion times more massive than the sun and produces as much energy as a thousand trillion suns.
Since astronomers expected water vapor to be present even in the early universe, the discovery of water is not itself a surprise, Bradford says. There’s water vapor in the Milky Way, although the total amount is 4,000 times less massive than in the quasar, as most of the Milky Way’s water is frozen in the form of ice.
Nevertheless, water vapor is an important trace gas that reveals the nature of the quasar. In this particular quasar, the water vapor is distributed around the black hole in a gaseous region spanning hundreds of light-years (a light-year is about six trillion miles), and its presence indicates that the gas is unusually warm and dense by astronomical standards. Although the gas is a chilly –53 degrees Celsius (–63 degrees Fahrenheit) and is 300 trillion times less dense than Earth’s atmosphere, it’s still five times hotter and 10 to 100 times denser than what’s typical in galaxies like the Milky Way.
The water vapor is just one of many kinds of gas that surround the quasar, and its presence indicates that the quasar is bathing the gas in both X-rays and infrared radiation. The interaction between the radiation and water vapor reveals properties of the gas and how the quasar influences it. For example, analyzing the water vapor shows how the radiation heats the rest of the gas. Furthermore, measurements of the water vapor and of other molecules, such as carbon monoxide, suggest that there is enough gas to feed the black hole until it grows to about six times its size. Whether this will happen is not clear, the astronomers say, since some of the gas may end up condensing into stars or may be ejected from the quasar.
Bradford’s team made their observations starting in 2008, using an instrument called Z-Spec at the Caltech Submillimeter Observatory (CSO), a 10-meter telescope near the summit of Mauna Kea in Hawaii. Z-Spec is an extremely sensitive spectrograph, requiring temperatures cooled to within 0.06 degrees Celsius above absolute zero. The instrument measures light in a region of the electromagnetic spectrum called the millimeter band, which lies between infrared and microwave wavelengths. The researchers’ discovery of water was possible only because Z-Spec’s spectral coverage is 10 times larger than that of previous spectrometers operating at these wavelengths. The astronomers made follow-up observations with the Combined Array for Research in Millimeter-Wave Astronomy (CARMA), an array of radio dishes in the Inyo Mountains of Southern California.
This discovery highlights the benefits of observing in the millimeter and submillimeter wavelengths, the astronomers say. The field has developed rapidly over the last two to three decades, and to reach the full potential of this line of research, the astronomers—including the study authors—are now designing CCAT, a 25-meter telescope to be built in the Atacama Desert in Chile. CCAT will allow astronomers to discover some of the earliest galaxies in the universe. By measuring the presence of water and other important trace gases, astronomers can study the composition of these primordial galaxies.
The second group, led by Dariusz Lis, senior research associate in physics at Caltech and deputy director of the CSO, used the Plateau de Bure Interferometer in the French Alps to find water. In 2010, Lis’s team was looking for traces of hydrogen fluoride in the spectrum of APM 08279+5255, but serendipitously detected a signal in the quasar’s spectrum that indicated the presence of water. The signal was at a frequency corresponding to radiation that is emitted when water transitions from a higher energy state to a lower one. While Lis’s team found just one signal at a single frequency, the wide bandwidth of Z-Spec enabled Bradford and his colleagues to discover water emission at many frequencies. These multiple water transitions allowed Bradford’s team to determine the physical characteristics of the quasar’s gas and the water’s mass.