[/caption]
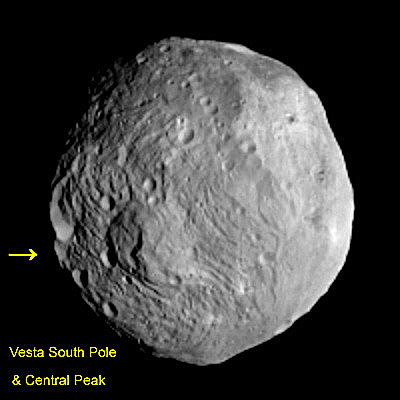
The first ever Vesta Vista snapped from the protoplanets orbit has been transmitted back through 117 million miles of space to eager eyes waiting on Earth. Although Vesta had been observed by telescopes on Earth and in space for more than two centuries since its discovery, only scant detail on its surface could be discerned until today.
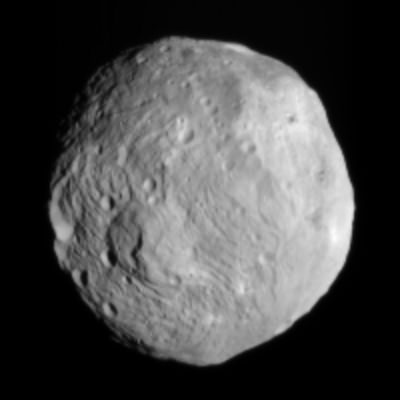
NASA’s Dawn spacecraft took the new photo of the giant asteroid Vesta on July 17 – enhanced version shown above – less than 2 days after making space history as the first probe ever to enter orbit about an object in the main Asteroid Belt. The team also released their first 3 D image of Vesta. Read my orbital capture story here and see the original NASA image below.
“I think it is truly thrilling to be turning what was little more than a fuzzy blob for two centuries into a fascinating alien world,” said Dawn Chief Engineer Marc Rayman in a new post orbit interview with Universe Today.
Vesta is 330 miles (530 kilometers) in diameter and the second most massive object in the Asteroid Belt between Mars and Jupiter.
“And the closer Dawn gets to Vesta, the more exotic and intriguing the pictures become !,” added Rayman.
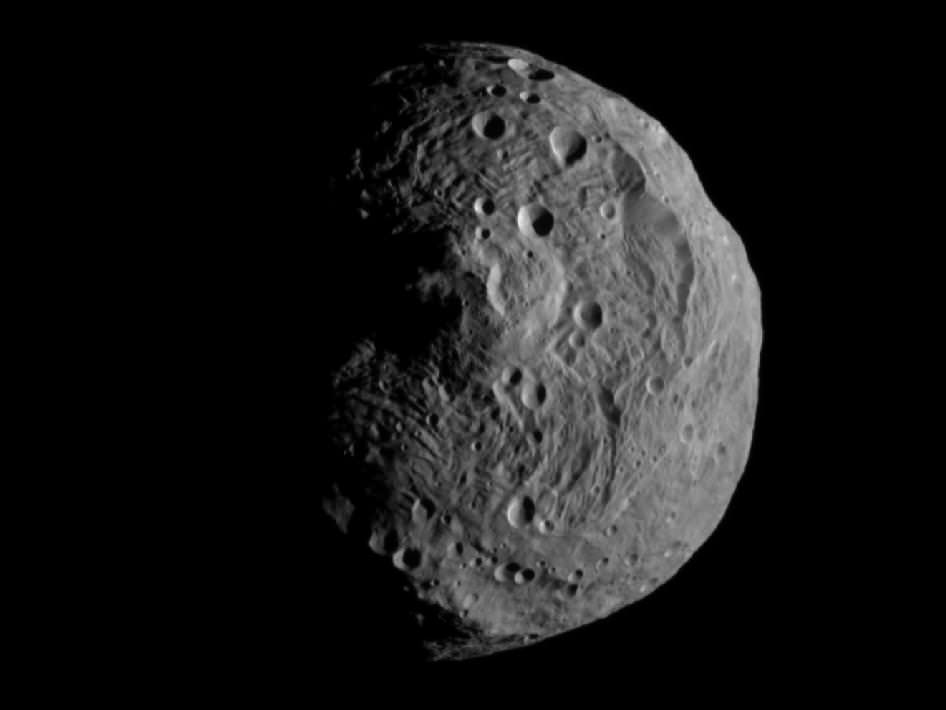
NASA's Dawn spacecraft obtained this image with its framing camera on July 17, 2011. It was taken from a distance of about 9,500 miles (15,000 kilometers) away from the protoplanet Vesta. Each pixel in the image corresponds to roughly 0.88 miles (1.4 kilometers). Credit: NASA/JPL-Caltech/UCLA/MPS/DLR/IDA
Enhanced image above
Dawn was captured into orbit at an altitude of 9,900 miles (16,000 km) at 1 a.m. EDT on July 16 according to Rayman, of the Jet Propulsion Lab in Pasadena, Calif. and is now slowly descending over the next few weeks.
“The spacecraft remains healthy, and our spiral down to Vesta is going well,” Rayman told me.
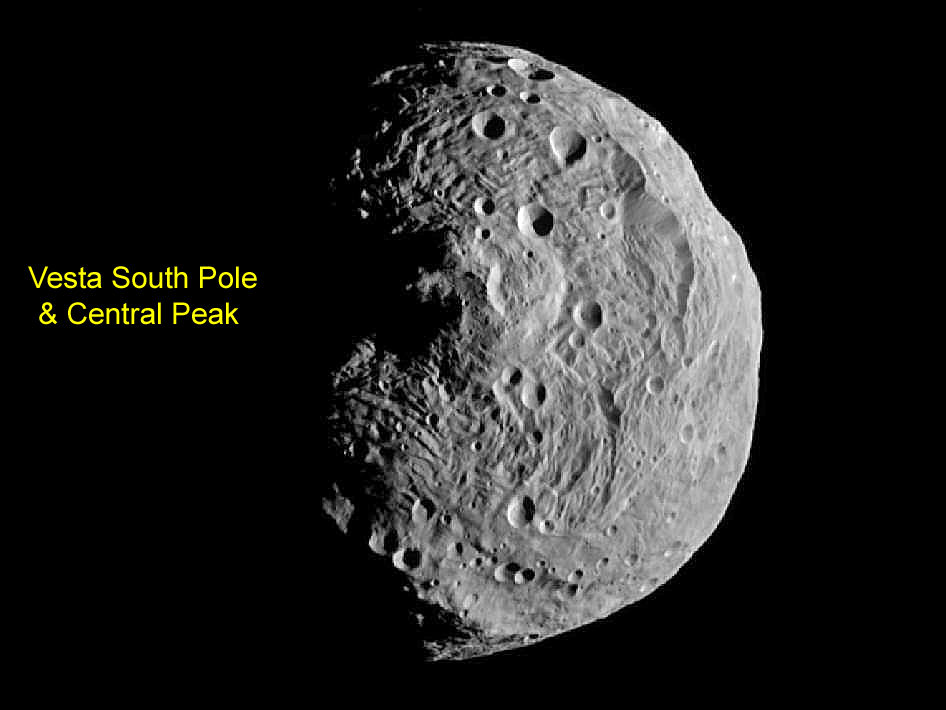
The new photo from orbit is nearly centered on the south pole which suffered a devastation cosmic collision eons ago. That blast sent huge plumes of ejecta streaming out, including towards Earth. About 5% of all known meteorites stem from Vesta.
“The south pole is a bulging feature in the images,” said Prof. Chris Russll, Dawn’s Science Principal Investigator of UCLA in an interview.
“The pole is not centered on this feature but is close to it. We have not finalized our determination of the pole but are close to a ‘final’ answer. We are not making interpretations at this point because the greater resolution that is coming will make all today’s speculations moot,” Russell stated.
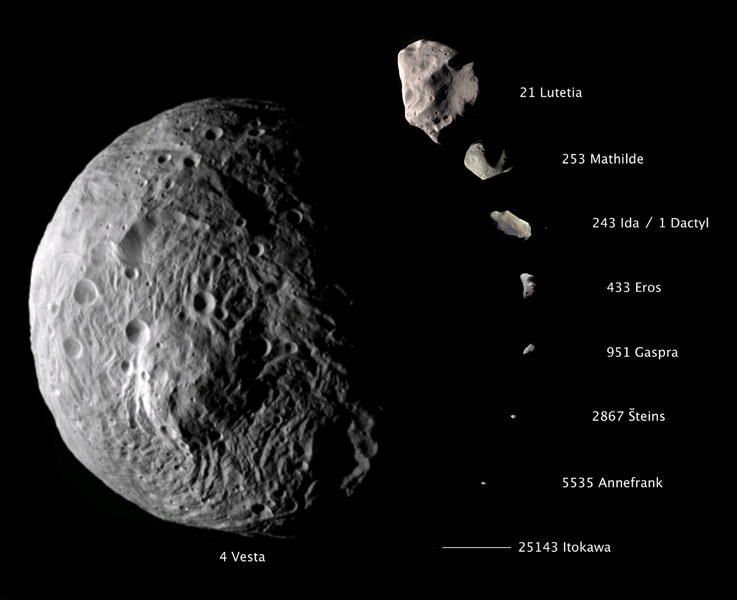
This composite image shows the comparative sizes of nine asteroids visited by Earthly spaceships. Up until now, Lutetia, with a diameter of 81 miles (130 kilometers), was the largest asteroid visited by a spacecraft, which occurred during a flyby. Vesta, which is also considered a protoplanet because it's a large body that almost became a planet, dwarfs all other small bodies in this image, with its diameter sizing up at approximately 330 miles (530 kilometers). Credit: NASA/JPL-Caltech/JAXA/ESA
By early August, Dawn will have gently been nudged into its initial science observation orbit at an altitude of approximately 1700 miles above the scarred surface of newly discovered mountains, craters, grooves, scarps and more.
During the approach phase, the Dawn team will accomplish multiple tasks with its onboard systems and three science instruments; including the search for possible moons, observing Vesta’s physical properties and obtaining calibration data.
But don’t expect a continuous stream of new pictures, according to Russell.
“We will not have a steady stream of images until we are in one of our
three science phases,” Russell told me. “When we are in transit from one place to another we thrust, stop, turn, image, turn, transmit, turn, thrust, and several days later repeat. All time spent not thrusting is time taken away from science later.”
“The next image is scheduled to be snapped on Saturday July 23.”
We will learn a lot more at the next press conference scheduled to take place on Monday August 1 from JPL.
Dawn will spend one year orbiting around Vesta and collecting high resolution mapping images, determining the chemical composition and measuring its gravity field. Then it will fire its ion thrusters to propel the probe to a second destination, the dwarf planet Ceres, arriving in February 2015.
The Asteroid Belt is one of the last unexplored regions of our solar system.
“We are beginning the study of arguably the oldest extant primordial surface in the solar system,” elaborated Russell in a NASA statement. “This region of space has been ignored for far too long. So far, the images received to date reveal a complex surface that seems to have preserved some of the earliest events in Vesta’s history, as well as logging the onslaught that Vesta has suffered in the intervening eons.”
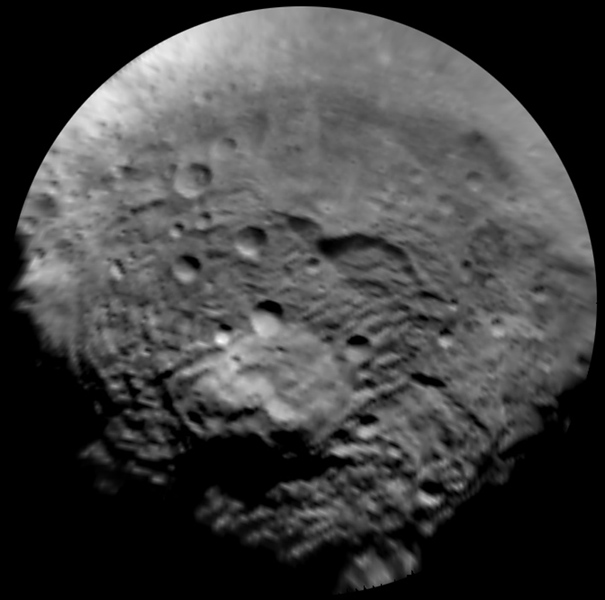

This anaglyph image of the south polar region of the asteroid Vesta was put together from two clear filter images, taken on July 9, 2011 by the framing camera instrument aboard NASA's Dawn spacecraft. Each pixel in this image corresponds to roughly 2.2 miles (3.5 kilometers). The anaglyph image shows the rough topography in the south polar area, the large mountain, impact craters, grooves, and steep scarps in three dimensions. The diameter of Vesta is about 330 miles (530 kilometers). Use red-green (or red-blue) glasses to view in 3-D. NASA/JPL-Caltech/UCLA/MPS/DLR/IDA
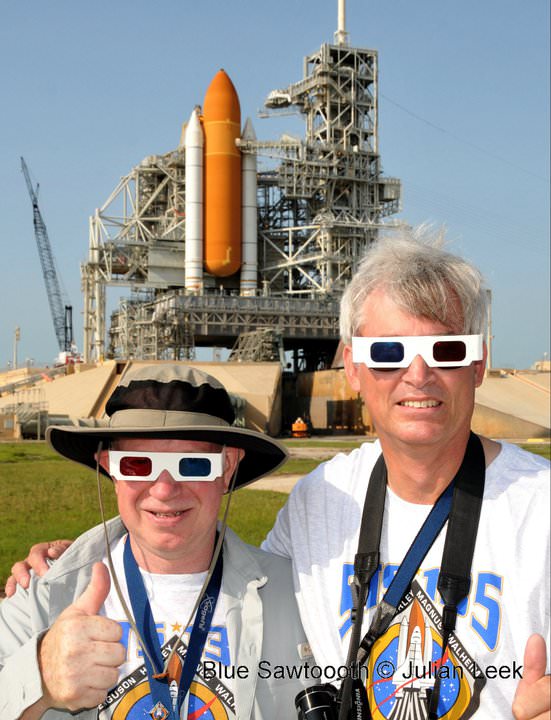
STS-135 twins show the right and wrong way to wear nifty 3-D glasses. Remember; red on the left (Ken Kremer – at right & Mike Barrett – at left, wrong) – backdropped by Space Shuttle Atlantis at the base of Launch Pad 39A at the Kennedy Space Center. Credit: Julian Leek
Read my prior features about Dawn
Dawn Exceeds Wildest Expectations as First Ever Spacecraft to Orbit a Protoplanet – Vesta
Dawn Closing in on Asteroid Vesta as Views Exceed Hubble
Dawn Begins Approach to Asteroid Vesta and Snaps First Images
Revolutionary Dawn Closing in on Asteroid Vesta with Opened Eyes