MESSENGER Unveiling Mercurys Hidden Secrets

Spectacular view of the Degas crater from MESSENGER in Mercury orbit. This high-resolution view of Degas crater was obtained as a targeted observation (90 m/pixel). Impact melt coats its floor, and as the melt cooled and shrank, it formed the cracks observed across the crater. For context, Mariner 10’s view of Degas is shown at left. Degas is 52 km in diameter and is centered at 37.1° N, 232.8° E. Credit: NASA/The Johns Hopkins University Applied Physics Laboratory/Carnegie Institution of Washington

[/caption]
NASA’s MESSENGER probe to Mercury, the scorched, innermost planet of our solar system, is sending back so much startling and revolutionary data and crystal clear images that the results are forcing scientists to toss out previously cherished theories and formulate new ones even as the results continues to pour in. And the mission has barely begun to explore Mercury’s inner secrets, exterior surface and atmospheric environment.

MESSENGER became the first spacecraft ever to orbit planet Mercury on March 18, 2011 and has just completed the first quarter of its planned one year long mission – that’s the equivalent of one Mercury year.

MESSENGER has collected a treasure trove of new data from the seven instruments onboard yielding a scientific bonanza; these include extensive global imagery, measurements of the planet’s surface chemical composition, topographic evidence for significant amounts of water ice, magnetic field and interactions with the solar wind, reported the science team at a press conference at NASA Headquarters.
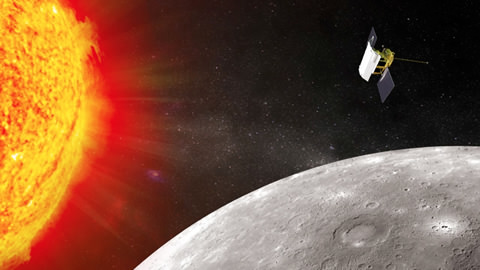
Schematic illustration of the operation of MESSENGER's X-ray Spectrometer (XRS). When X-rays emitted from the Sun’s corona strike the planet, they can induce X-ray fluorescence from atoms at the surface. Detection of these fluorescent X-rays by the XRS allows determination of the surface chemical composition. Credit: NASA/The Johns Hopkins University Applied Physics Laboratory/Carnegie Institution of Washington

“We are delighted to share the findings of the first 25% of our year long mission,” said MESSENGER principal investigator Sean Solomon of the Carnegie Institution of Washington at a press briefing for reporters. “We receive new data back almost every day.”

“MESSENGER has snapped over 20,000 images to date,” said Solomon, at up to 10 meters per pixel. The probe has also taken over two million laser-ranging topographic observations, discovered vast volcanic plains, measured the abundances of many key elements and confirmed that bursts of energetic particles in Mercury’s magnetosphere result from the interaction of the planets magnetic field with the solar wind.

“We are assembling a global overview of the nature and workings of Mercury for the first time.”

“We had many ideas about Mercury that were incomplete or ill-formed, from earlier flyby data,” explained Solomon. “Many of our older theories are being cast aside into the dust bin as new observations from new orbital data lead to new insights. Our primary mission has another three Mercury years to run, and we can expect more surprises as our solar system’s innermost planet reveals its long-held secrets.”
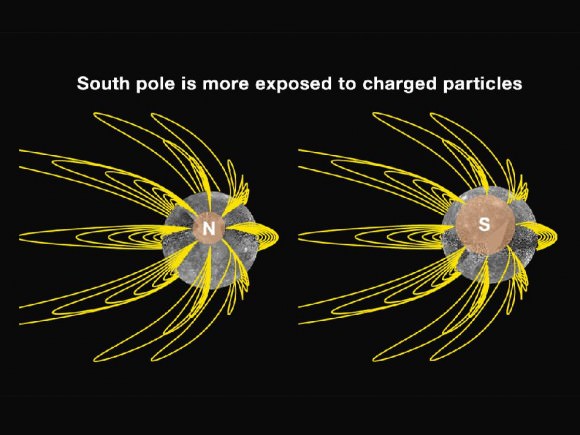
Magnetic field lines differ at Mercury's north and south poles As a result of the north-south asymmetry in Mercury's internal magnetic field, the geometry of magnetic field lines is different in Mercury's north and south polar regions. In particular, the magnetic "polar cap" where field lines are open to the interplanetary medium is much larger near the south pole. This geometry implies that the south polar region is much more exposed than in the north to charged particles heated and accelerated by solar wind–magnetosphere interactions. The impact of those charged particles onto Mercury's surface contributes both to the generation of the planet's tenuous atmosphere and to the "space weathering" of surface materials, both of which should have a north-south asymmetry given the different magnetic field configurations at the two poles. Image Credit: NASA/Johns Hopkins University Applied Physics Laboratory/Carnegie Institution of Washington

NASA’s Mariner 10 was the only previous robotic probe to explore Mercury, during three flyby’s back in the mid-1970’s early in the space age.

MESSENGER was launched in 2004 and the mission goal is to produce the first global scientific observations of Mercury and piece together the puzzle of how Mercury fits in with the origin and evolution of our solar system.

There was very little prior imaging coverage of Mercury’s northern polar region.

“We’ve now filled in many of the gaps,” said Messenger scientist Brett Denevi of Johns Hopkins University’s Applied Physics Laboratory (APL). “We now see large smooth plains that are thought to be volcanic in origin.”

“Now we’re seeing for the first time their full extent, which is around 4 million square kilometers (1.54 million square miles). That’s about half the size of the continental United States.”
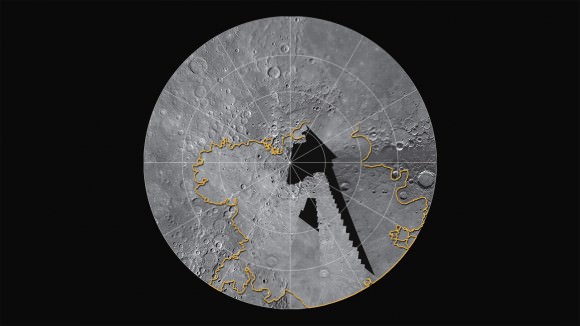
MESSENGER is currently filling in coverage of Mercury’s north polar region, which was seen only partially during the Mariner 10 and MESSENGER flybys. Flyby images indicated that smooth plains were likely important in Mercury’s northernmost regions. MESSENGER's orbital images show that the plains are among the largest expanses of volcanic deposits on Mercury, with thicknesses of several kilometers in many places. The estimated extent of these plains is outlined in yellow. This mosaic is a combination of flyby and orbital coverage in a polar stereographic projection showing latitudes from 50° to 90° N. The longitude at the 6 o'clock position is 0°. Credit: NASA/The Johns Hopkins University Applied Physics Laboratory/Carnegie Institution of Washington

“We see all kinds of evidence for volcanism and tectonic deformation of the plains from orbit where we can look straight down,” added Denevi. “In the new images we see ghost craters from pre-existing impact craters that were later covered over by lava.’

Color images of the whole planet – with a resolution of about 1 kilometer per pixel – tell the researchers about the chemical composition and rock types on Mercury’s surface.

“We don’t know the composition yet.”

“We are very excited to study these huge volcanic deposits near the north pole with the implications for the evolution of Mercury’s crust and how it formed,” said Denevi.

“Targeted new high resolution imaging is helping us see landforms unlike anything we’ve seen before on Mercury or the moon.”
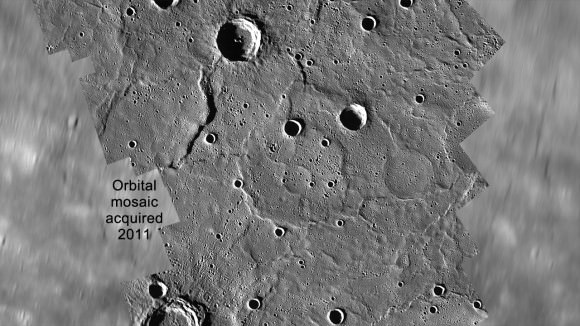
MESSENGER’s orbital images have been overlaid on an image from the second flyby shown in Image 1.2a. Even for previously imaged portions of the surface, orbital observations reveal a new level of detail. This region is part of the extensive northern plains, and evidence for a volcanic origin can now be seen. Several examples of “ghost” craters, preexisting craters that were buried by the emplacement of the plains, are seen near the center of the mosaic. Credit: NASA/The Johns Hopkins University Applied Physics Laboratory/Carnegie Institution of Washington

Determining whether Mercury harbors caches of polar water ice is another one of the many questions the MESSENGER science team hopes to answer.

Two decades ago, Earth-based radar images showed deposits thought to consist of water ice near Mercury’s north and south poles. Researchers postulated a theory that these icy deposits are preserved on the cold, permanently shadowed floors of high-latitude impact craters, similar to those on Earth’s moon.

Early results from topographic measurements are promising.

“The very first scientific test of that hypothesis using Messenger data from orbit has passed with flying colors.”

“The area of possible polar water ice is quite a bit larger than on the moon,” said Solomon. “Its probably meters or more in depth based on radar measurements.”

“And we may have the irony that the planet closest to the sun may have more water ice at its poles than even our own moon.”

“Stay tuned. As this mission evolves, we will be relying on the geochemical and remote sensing instruments which take time to collect observations. The neutron and gamma ray spectrometers have the ability to tell us the identity of these icy materials,” said Solomon.
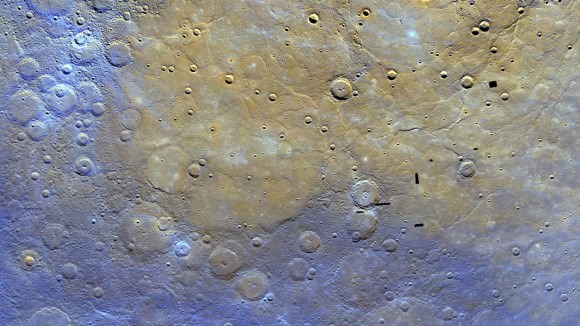
The same scene as that in Image 1.3a is shown after the application of a statistical method that highlights differences among the eight color filters, making variations in color and composition easier to discern. Credit: NASA/The Johns Hopkins University Applied Physics Laboratory/Carnegie Institution of Washington
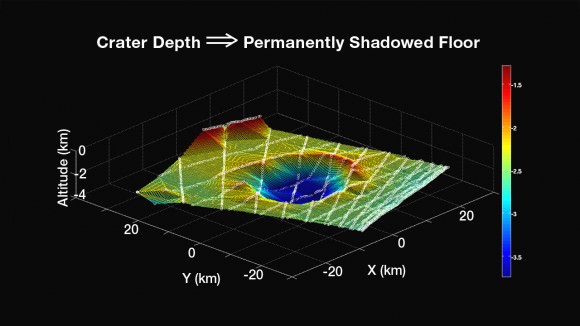
This topographic contour map was constructed from the several MLA profiles (lines of white circles) that pass through and near the crater circled in Image 3.4. The color scale at right is in km, and north is at the 4 o’clock position. Calculations show that the topography of the crater is consistent with the prediction that the southernmost portion of the crater floor is in permanent shadow. Credit: NASA/The Johns Hopkins University Applied Physics Laboratory/Carnegie Institution of Washington
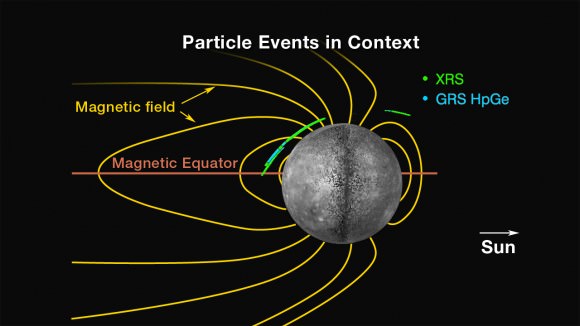
A cross-section of Mercury’s magnetosphere (in the noon-midnight plane, i.e., the plane containing the planet-Sun line and Mercury’s spin axis) provides context for the energetic electron events observed to date with the MESSENGER XRS and GRS high-purity germanium (HpGe) detectors. The Sun is toward the right; dark yellow lines indicate representative magnetic field lines. Blue and green lines trace the regions along MESSENGER's orbit from April 2 to April 10 during which energetic electrons were detected and MESSENGER's orbit was within ± 5° of the noon-midnight plane. The presence of events on the dayside, their lack in the southern hemisphere, and their frequency of occurrence at middle northern latitudes over all longitudes point to a more complex picture of magnetospheric activity than found at Earth. Credit: NASA/The Johns Hopkins University Applied Physics Laboratory/Carnegie Institution of Washington

Sun Celebrates Solstice With Flare (and a CME)

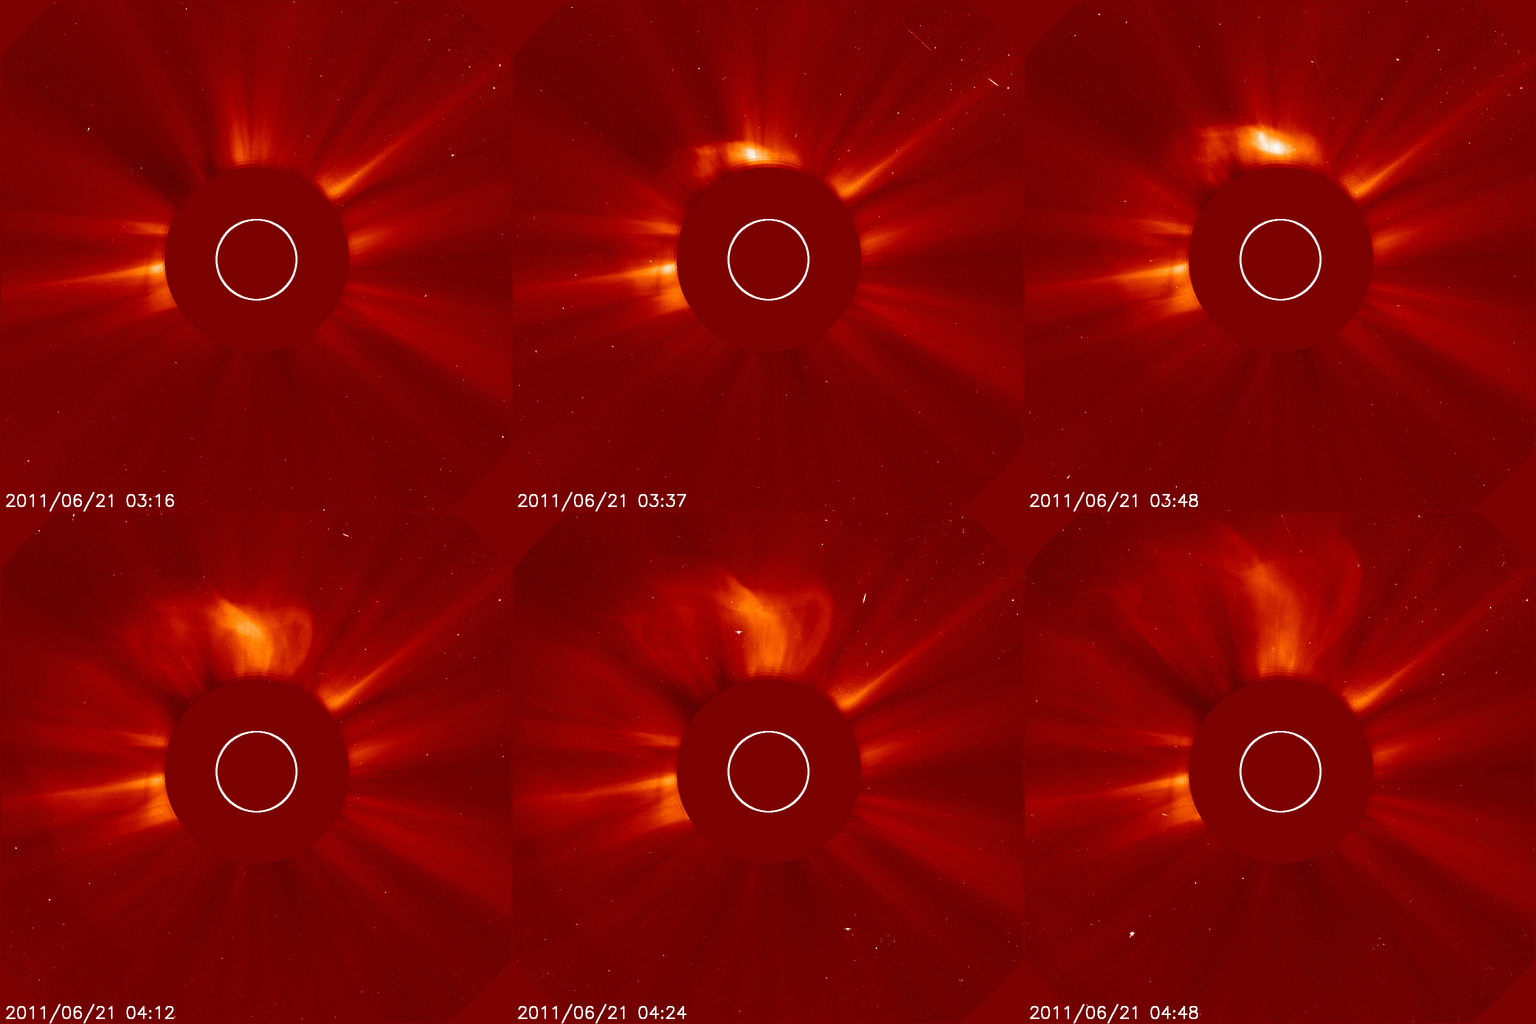
The Halo coronal mass ejection (CME) as viewed by the Solar and Heliospheric Observatory coronograph on June 21, 2011. Credit: NASA/SOHO

[/caption]

Late in the evening on June 20, 2011 the Sun emitted a long lasting C7.7 class flare (a relatively small flare) that peaked around 11:25p.m. EDT. The flare was associated with a coronal mass ejection that bloomed off the sun at 11:09p.m. EDT (0412 UT).

Spaceweather.com reports that according to analysts at the Goddard Space Flight Center Space Weather Lab, the CME left the sun traveling 800 km/s and it will reach Earth on June 23rd at 23:22 UT (plus or minus 7 hours). A very cool 3D heliospheric model (below) shows the cloud sweeping past our planet. The impact is expected to trigger a G2-class geomagnetic storm.

High-latitude sky watchers should be alert for auroras on June 23rd and 24. The season favors southern hemisphere observers, where skies are darker for longer due to the winter solstice.

These 3D Heliospheric animated models, developed by the Community Coordinated Modeling Center based at the Goddard Space Flight Center, show how the CME cloud might appear as it sweeps past Earth. Credit: NASA/CCMC

Update: SDO posted this video of the event:

Sources: NASA, Spaceweather.com

New Comet Approaching!

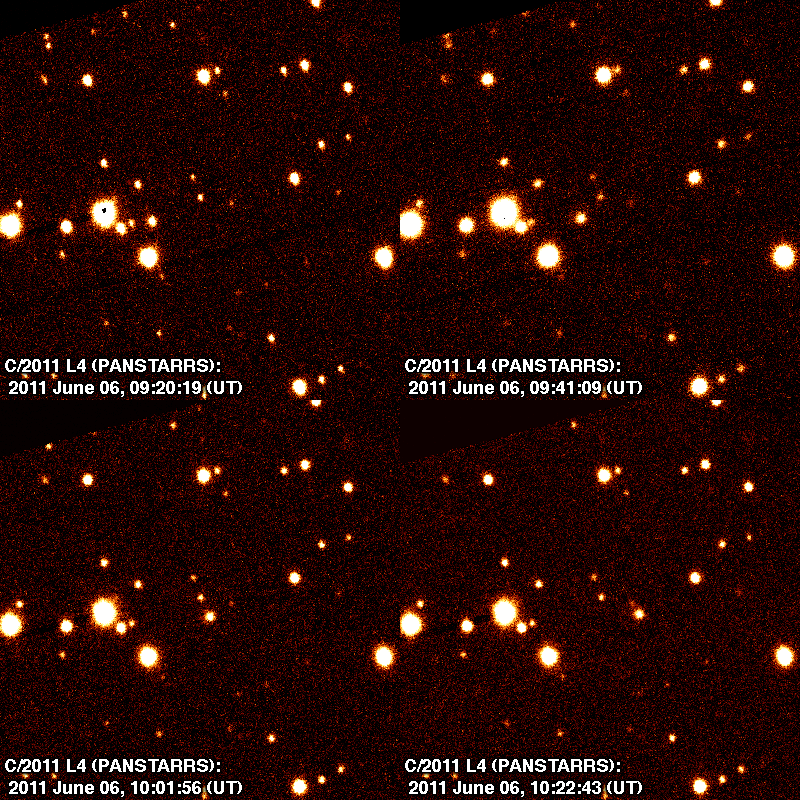
Animation showing the comet moving against the background of stars. Images taken at the Pan-STARRS 1 Telescope on the night of June 5-6, 2011. Hawaii time is 10 hours earlier than Universal Time (UT). Credit: Henry Hsieh, PS1SC

[/caption]

Pan-STARRS… Doesn’t that conjure up an image of a faceless stranger whispering in the dark, passing their hand over a clear sky and leaving a glittering trail? Pan-STARRS… Take the second star on the left and go straight on ’til morning. Pan-STARRS… Regardless of my flights of fancy, Pan-STARRS is a telescopic reality and its home is Mount Haleakala, Hawaii. The Panoramic Survey Telescope and Rapid Response System is renowned for its wide-field imaging capabilities – and its mission to alert planet Earth of potentially dangerous objects approaching. Now the most recent discovery is a comet which may be visible to the naked eye in early 2013.

Discovered on the night of June 5-6 using the Pan-STARRS 1 telescope, the moving rogue was confirmed to be a comet on the following night by astronomer Richard Wainscoat and graduate student Marco Micheli using the Canada-France-Hawaii Telescope on Mauna Kea. The Oort Cloud visitor quickly had its orbit calculated by the Harvard Minor Planet Center and shows it will be visiting in our solar system within about 30 million miles (50 million km) of the Sun in early 2013. While that’s about the same distance as the Sol / Mercury factor, the comet will not encounter Earth… just give us a good show.

Wainscoat said, “The comet has an orbit that is close to parabolic, meaning that this may be the first time it will ever come close to the sun, and that it may never return.” Just like our stranger in the dark, eh?

Will this new comet named C/2011 L4 (PANSTARRS) create a spectacle? It’s not easy to judge. While it is expected to be brightest in February or March 2013, it depends on how much ice it contains as to how bright it will become. Another factor is positioning. Since it will be low to the west at sunset, sky brightness may also make it difficult to observe. Right now C/2011 L4 is about 700 million miles (1.2 billion km) from the Sun, placing it beyond the orbit of Jupiter and only able to be spotted using a large telescope and imaging equipment. It will take several months of observation for more accurate assessments, but astronomers are cautious since many predictions can end up being a cometary dud. There’s no doubt it will be here – but there’s always uncertainties as to how bright it will be.

In the mean time, we’ll take Pan-STARRS whispering word for it… and believe.

Original Story Source: Institute for Astronomy / University of Hawaii.

Astronaut Mark Kelly Retires from NASA

Gabrielle Giffords and Mark Kelly, in an image on Giffords' campaign website.

[/caption]

Astronaut Mark Kelly, commander of the recent STS-134 shuttle mission and husband of Rep. Gabrielle Giffords, announced today via Facebook that he is retiring from NASA and the US Navy to spend time with his wife. Other sources say the two will write a memoir together.

“This was not an easy decision,” he wrote on his Facebook page. “Public service has been more than a job for me and my family. My parents are retired police officers. And my wife Gabrielle proudly serves in the U.S. House of Representatives.”

Kelly said that his decision to retire was not at all about questioning the future of NASA, but he feels a need to spend time with his wife and family.

“As life takes unexpected turns we frequently come to a crossroads,” Kelly wrote. “I am at this point today. Gabrielle is working hard every day on her mission of recovery. I want to be by her side. Stepping aside from my work in the Navy and at NASA will allow me to be with her and with my two daughters. I love them all very much and there is no doubt that we will move forward together. After some time off, I will look at new opportunities and am hopeful that one day I will again serve our country.”

Despite persistent rumors on the internet, Kelly has said he has no intentions of seeking public office and is “absolutely” convinced his wife will return to political life.

Rep. Giffords was shot in the head in January, 2011 in Tucson at an event she was hosting for residents of her Congressional district. Six people died and 13 were injured. She was recently released from a rehabilitation hospital in Houston.

Kelly’s retirement from NASA and the Navy, where he has served for 25 years, is effective Oct. 1. He has flown in space four times. According to ABC news, he and his wife said they have a deal with Scribner’s publishers for a joint memoir.

Sources: Facebook, ABC, Arizona Daily Star

Help Scientists Decide on Which KBOs the New Horizons Spacecraft Will Visit

How would you like to help choose an additional destination or two for a spacecraft heading to the outer solar system? A new citizen science project from the Zooniverse — called Ice Hunters — will allow the public to help discover a potential new, icy follow-on destination for NASA’s New Horizons spacecraft, which is currently en route to make the first flyby of the Pluto system. However, after it zooms past Pluto, the spacecraft will have the capability to explore other Kuiper Belt Objects. But, the destination has yet to be chosen. That’s where you can help.

“Projects like this make the public part of modern space exploration,” said Dr. Pamela Gay. “The New Horizon’s mission was launched knowing we’d have to discover the object it would visit after Pluto. Now is the time to make that discovery and thanks to IceHunters, anyone can be that discoverer.”

With Ice Hunters, the public can help scientists search through specially-obtained deep telescopic images for currently unknown objects in the Kuiper Belt. While the images you’ll be perusing in Ice Hunters won’t be the beautiful astronomical images seen in the Galaxy Zoo classification of galaxies or the Moon Zoo images of the Moon, the science rewards in Ice Hunters will be spectacular.

And there’s more: there’s also the potential for discovering variable stars and asteroids.

What’s cool is that you’ll be searching for KBO’s and potential dwarf planets in much the same way that Clyde Tombaugh found Pluto: comparing images of the same region of the Kuiper Belt and looking for objects that move or vary in brightness.

“The New Horizons project is breaking new ground in many ways,” said New Horizons Principal Investigator Alan Stern. “We’re flying by a new kind of planet and we’ll be making the most distant encounters with planetary bodies in the history of space exploration, and now we’re employing citizen science to help find our potential extended mission flyby targets, perhaps a billion kilometers farther than even distant Pluto and its moons. We’re very excited to be working with Zooniverse and breaking this new kind of ground. We hope the public will be excited to join in with us and with Zooniverse to make a little history of their own by discovering our next flyby target after Pluto.”

Somewhere, on the outer edges of the solar system an icy body lurks undiscovered, orbiting on a path that will just happen to carry it toward a potential rendezvous with the New Horizons spacecraft.

New Horizons will flyby Pluto in 2015, and there will be enough gas in the spacecraft’s tank to fly toward at least one and possibly two Kuiper Belt Objects in the distant outer solar system. The expected date of the KBO flyby will be between 2016 and 2020, depending on the object chosen and its distance from Pluto.

Your mission, should you choose to accept, is to find the most interesting KBO possible for New Horizons to visit. If that object can be found , it will become the most distant object ever visited by a spacecraft from Earth.

The Kuiper Belt is a region of the outer solar system, extending past Neptune, (from 30AU) out to nearly twice Neptune’s orbit (out to roughly 55AU), which contains icy bodies in a variety of different sizes up to thousands of kilometers across. The first KBO other than Pluto was only discovered in 1992, and the KBO population is still not well mapped. Ice Hunters will do its part to study one small slice of the Kuiper Belt as it looks for an object along New Horizon’s trajectory after its Pluto flyby.

Using some of the largest telescopes in the world, scientists have imaged that region, producing millions of pictures for that could contain images of the rare objects that are orbiting toward just the right location, along with many other small worlds on different trajectories.

In “difference” images, which are created by subtracting observations taken at two different times, scientists can mostly (but not entirely) remove the light from constant sources like stars and galaxies. Left behind are the things that move or vary in brightness, which is what the users of IceHunters will be looking for. Since the stars never subtract off perfectly, the images appear messy, and computers can’t be trained to find objects as effectively as people can.

“When you’re looking for something special in masses of messy, real-world data, sometimes there’s no substitute for the human eye, and Zooniverse Ice Hunters will put thousands of eyes to work on this important job,” said John Spencer of Southwest Research Institute, a member of the New Horizons science team who is coordinating the search effort.

Just as other Zooniverse projects have easy-to-use websites, IceHunters.org is no different. “Using just about any modern web-browser, users can circle potential KBOs and mark with a star the locations of asteroids,” said web developer Cory Lehan from Southern Illinois University Edwardsville, who has participated in several Zooniverse web designs. “The website is filled with examples to help get people started. Anyone should be able to take part – No Flash required.”

So check out Ice Hunters and start discovering today!

You can follow Universe Today senior editor Nancy Atkinson on Twitter: @Nancy_A. Follow Universe Today for the latest space and astronomy news on Twitter @universetoday and on Facebook.

Slowing Down Stars

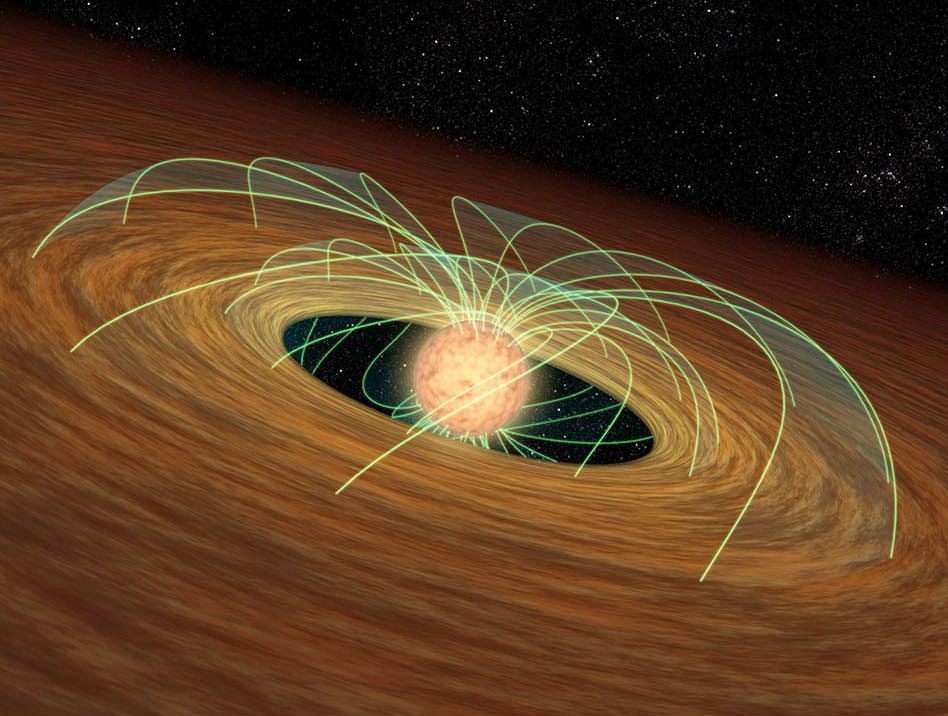
Forming Star's Magnetic Field Interacting With Disc Credit: NASA/JPL-Caltech/R. Hurt (SSC).

[/caption]

One of the long standing challenges in stellar astronomy, is explaining why stars rotate so slowly. Given their large masses, as they collapsed to form, they should spin up to the point of flying apart, preventing them from ever reaching the point that they could ignite fusion. To explain this rotational braking, astronomers have invoked an interaction between the forming star’s magnetic field, and forming accretion disc. This interaction would slow the star allowing for further collapse to take place. This explanation is now over 40 years old, but how has it held up as it has aged?

One of the greatest challenges to testing this theory is for it to make predictions that are directly testable. Until very recently, astronomers were unable to directly observe circumstellar discs around newly formed stars. In order to get around this, astronomers have used statistical surveys, looking for the presence of these discs indirectly. Since dust discs will be warmed by the forming star, systems with these discs will have extra emission in the infrared portion of the spectra. According to the magnetic braking theory, young stars with discs should rotate more slowly than those without. This prediction was confirmed in 1993 by a team of astronomers led by Suzan Edwards at the University of Massachusetts, Amherst. Numerous other studies confirmed these general findings but added a further layer to the picture; stars are slowed by their discs to a period of ~8 days, but as the discs dissipate, the stars continue to collapse, spinning up to a period of 1-2 days.

Another interesting finding from these studies is that the effects seem to be most pronounced for stars of higher mass. When similar studies were conducted on young stars in the Orion and Eagle nebulae, researchers found that there was no sharp distinction between stars with or without disks for low mass stars. Findings such as these have caused astronomers to begin questioning how universal the magnetic disc braking is.

One of the other pieces of information with which astronomers could work was the realization around 1970 that there was a sharp divide in rotational speeds between high mass stars and lower mass ones at around the F spectral class. This phenomenon had been anticipated nearly a decade earlier when Evry Schatzman proposed that the stellar wind would interact with the star’s own magnetic field to create drag. Since these later spectral class stars tended to have more active magnetic fields, the braking effect would be more important for these stars.

Thus astronomers now had two effects which could serve to slow rotation rates of stars. Given the firm theoretical and observational evidence for each, they were both likely “right”, so the question became which was dominant in which circumstance. This question is one with which astronomers are still struggling.

To help answer the question, astronomers will need to gather a better understanding of how much each effect is at work in individual stars instead of simply large population surveys, but doing so is tricky. The main method employed to examine disc locking is to examine whether the inner edge of the disc is similar to the radius at which an object in a Keplarian orbit would have a similar angular velocity to the star. If so, it would imply that the star is fully locked with the disc’s inner edge. However, measuring these two values is easier said than done. To compare the values, astronomers must construct thousands of potential star/disc models against which to compare the observations.

In one recent paper astronomers used this technique on IC 348, a young open cluster. Their analysis showed that ~70% of stars were magnetically locked with the disc. However, the remaining 30% were suspected to have inner disc radii beyond the reach of the magnetic field and thus, unavailable for disc braking. However, these results are somewhat ambiguous. While the strong number of stars tied to their discs does support the disc braking as an important component of the rotational evolution of the stars, it does not distinguish whether it is presently a dominant feature. As previously stated, many of the stars could be in the process of evaporating the discs, allowing the star to again spin-up. It is also not clear if the 30% of stars without evidence of disc locking were locked in the past.

Research like this is only one piece to a larger puzzle. Although the details of it aren’t fully fleshed out, it is readily apparent that these magnetic braking effects, both with discs and stellar winds, play a significant effect on slowing the angular speed of stars. This runs completely contrary to the frequent Creationist claim that “[t]here is no know [sic] mechanical process which could accomplinsh [sic] this transfer of momentum”.

The ATLAS3D Project: Calling A Different Tune

Image Credit: NASA and ESA

[/caption]

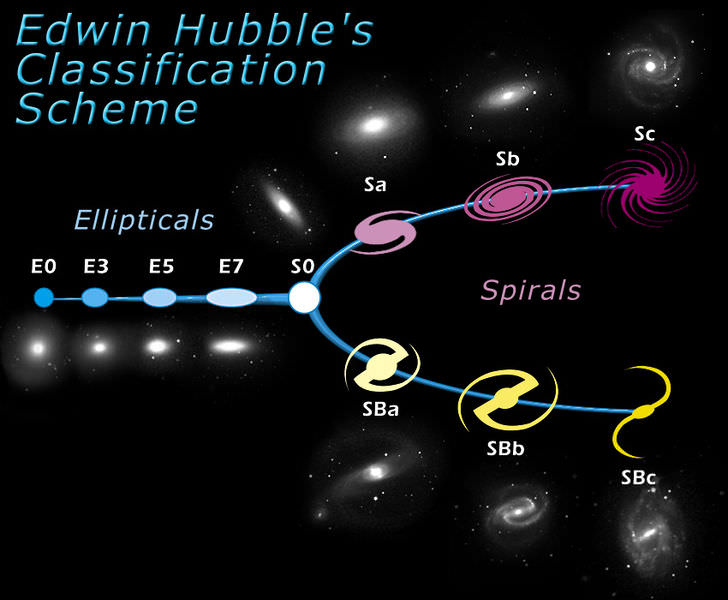
In 1926, astronomer Edwin Hubble gave us our first basic galaxy classification scenario – the Hubble Sequence. Using photographic plates, Hubble derived a simplistic system based on three visually known structures: elipitical, spiral and lenticular. This sequence, when plotted out, gave the appearance of a common object and eventually became known as the “Hubble Tuning Fork” (as seen above). For many decades, this served as a standard. Now the ATLAS3D Project is calling a different tune…

Just who is the pied piper in this merry band? The ATLAS3D project is a multiwavelength survey combined with a theoretical modelling effort. The observations it takes spans from the radio to the millimetre and optical. It provides multicolor imaging, as well as two-dimensional kinematics of the atomic, molecular and ionized gases, together with the kinematics and population of the stars, Where does it dance? Only around a carefully selected, volume-limited sample of 260 early-type galaxies.

Heading up the project is a team of 25 astronomers from Europe and Northern America, including ASTRON astronomers Morganti, Oosterloo, and Serra – and all with a mission – to update and revise our understanding of galactic evolution. Employing the SAURON spectrograph on the 4.2-meter William Herschel Telescope on La Palma, the team was able to distinguish stellar movement in the pre-determined galactic candidates. These new assessments show that spheroid galaxies belong to the spiral galaxy classification. How did they come to that conclusion? The largest portion of spheroids – or early types – are basically the same family as spirals and evolve along a similar line. But with ATLAS3D findings, we’re looking at new concepts.

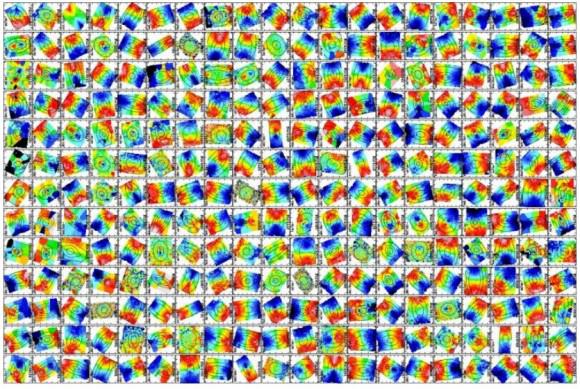
Maps of the observed velocity of the stars in the volume-limited sample of 260 early-type galaxies of the ATLAS3D survey. Red/blue colours indicate stars moving away/towards us respectively. Fast rotating and disk-like galaxies are characterized by two large and symmetric red/blue peaks at the two sides of the centre. This figure shows that this class of objects constitutes the vast majority of the sample. Credit: ATLAS3D Project

We’re seeing beyond the optical (photographic plates) which founded Hubble’s original diagram – where once galaxies were separated by their distinct characteristics such as rapid rotators rich in stars and gas – or as slowly moving, gas-poor models. Up until now, it was also next to impossible to distinguish sparse “face-on” structure from edge-on spheroids. With the aid of kinematic data astronomers can “see” rotation – allowing observation of all galaxy types from any angle.

“Slow and fast rotators tend to be classified as ellipticals and lenticulars, respectively, but the contamination is strong enough to affect results solely based on such a scheme: 20 per cent of all fast rotators are classified as ellipticals, and more importantly 66 per cent of all ellipticals in the ATLAS3D sample are fast rotators.” says the team. “Our complete sample of 260 ETGs leads to a new criterion to disentangle fast and slow rotators which now includes a dependency on the apparent ellipticity. It separates the two classes significantly better than the previous prescription.”

While it will take many years and many more observations to sort out all the new data, it would seem that our current understanding of galactic evolution just might need a “tune up”.

Oringinal Story Source: ASTRON.

June 21 ATV Re-Entry: A Man-Made Fireball In The Sky

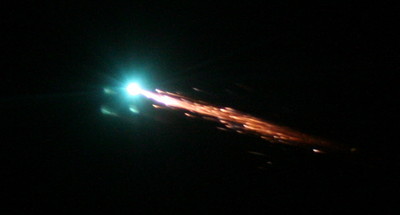
ATV re-entry. Credit: ESA

[/caption]

The Johannes Kepler ATV (Automated Transfer Vehicle) has undocked from the International Space station and will re- enter Earth’s atmosphere on June 21st ending its mission in fiery destruction.

The ATV has been docked with the ISS since February, where it delivered supplies, acted as a giant waste disposal and boosted the orbit of the International Space Station with its engines.

The X-wing ATV delivered approximately 7 tonnes of supplies to the station and will be leaving with 1,200kg of waste bags, including unwanted hardware.

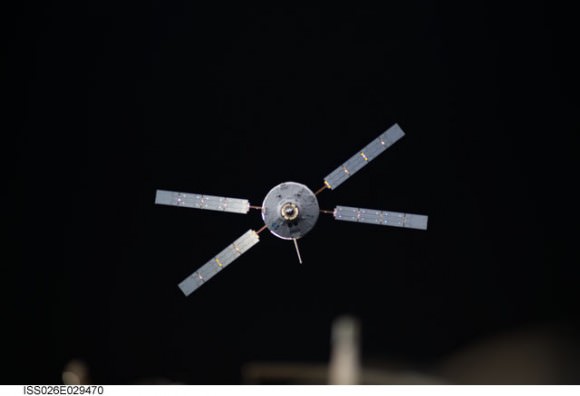
The Johannes Kepler ATV-2 approaches the International Space Station. Docking of the two spacecraft occurred on Feb. 24, 2011. Credit: NASA

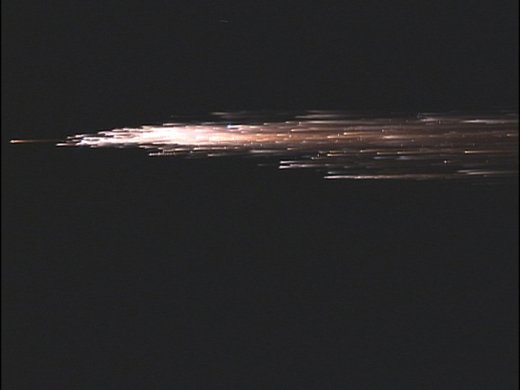
On June 21st at 17:07 GMT the craft will fire its engines and begin its suicide mission, tumbling and burning up as a bright manmade fireball over the Pacific Ocean. Any leftover debris will strike the surface of the Pacific ocean at 20:50 GMT.

During the ATV’s re-entry and destruction there will be a prototype onboard flight recorder (Black Box) transmitting data to Iridium satellites, as some aspects of a controlled destructive entry are still not well known.

ESA says that this area is used for controlled reentries of spacecraft because it is uninhabited and outside shipping lanes and airplane routes. Extensive analysis by ESA specialists will ensure that the trajectory stays within safe limits.

There still are some chances to see the ISS and Johannes Kepler ATV passing over tonight, but if you in a location where you can see the south Pacific skies starting at about 20:00 GMT, keep an eye out for a glorious manmade fireball.

A shower of debris results as the ATV continues its plunge through the atmosphere. Credit: ESA

Read more about the re-entry at ESA.

Hello, Helene!

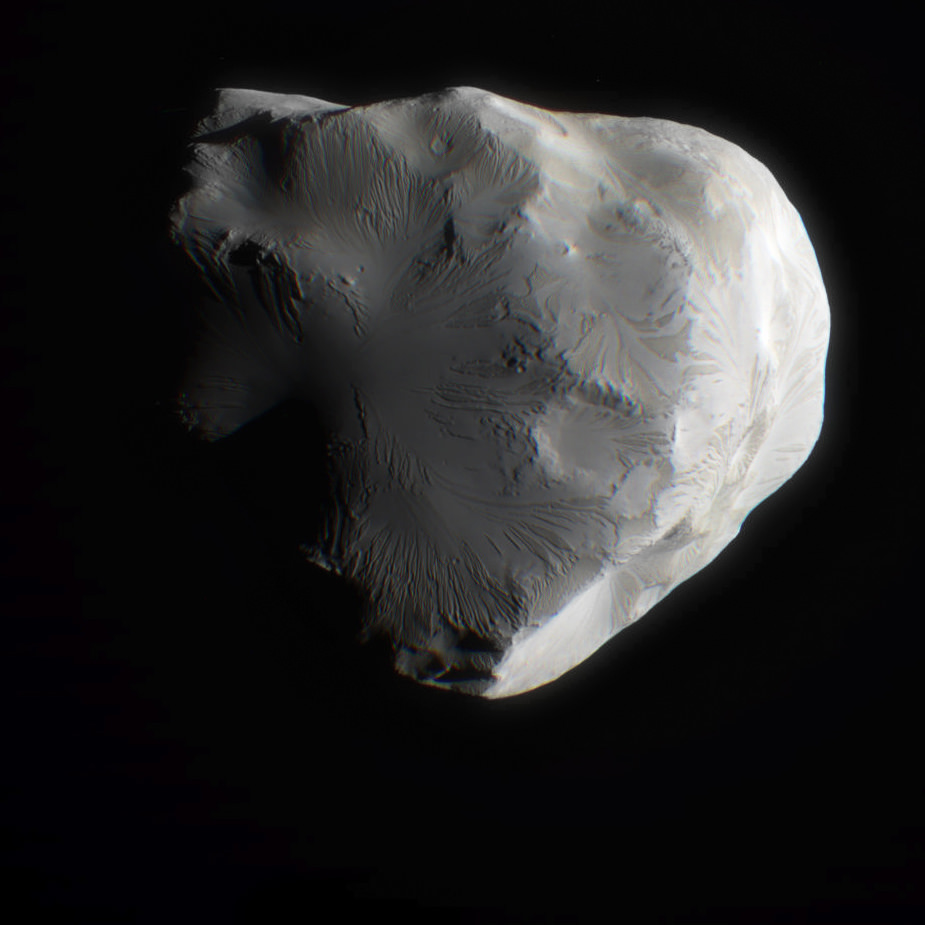
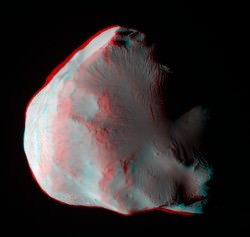
Color composite of Helene from June 18, 2011 flyby. NASA / JPL / SSI / J. Major

[/caption]

On June 18, 2011, the Cassini spacecraft performed a flyby of Saturn’s moon Helene. Passing at a distance of 6,968 km (4,330 miles) it was Cassini’s second-closest flyby of the icy little moon.

The image above is a color composite made from raw images taken with Cassini’s red, green and blue visible light filters. There’s a bit of a blur because the moon shifted position in the frames slightly between images, but I think it captures some of the subtle color variations of lighting and surface composition very nicely!

3D anaglyph of Helene assembled by Patrick Rutherford.

At right is a 3D anaglyph view of Helene made by Patrick Rutherford from Cassini’s original raw images … if you have a pair of red/blue glasses, check it out!

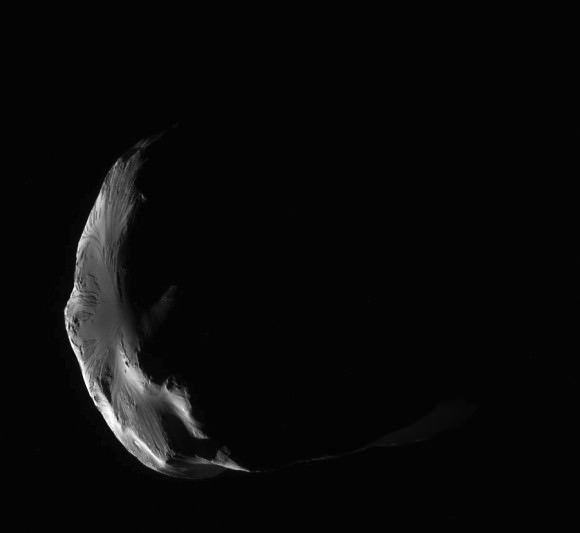
Cassini passed from Helene’s night side to its sunlit side. This flyby will enable scientists to create a map of Helene so they can better understand the moon’s history and gully-like features seen on previous flybys.

(When Cassini acquired the images, it was oriented such that Helene’s north pole was facing downwards. I rotated the image above to reflect north as up.)

Helene orbits Saturn at the considerable distance of 234,505 miles (377,400 km). Irregularly-shaped, it measures 22 x 19 x 18.6 miles (36 x 32 x 30 km).

Helene is a “Trojan” moon of the much larger Dione – so called because it orbits Saturn within the path of Dione, 60º ahead of it. (Its little sister Trojan, 3-mile-wide Polydeuces, trails Dione at the rear 60º mark.) The Homeric term comes from the behavioral resemblance to the Trojan asteroids which orbit the Sun within Jupiter’s path…again, 60º in front and behind. These orbital positions are known as Lagrangian points (L4 and L5, respectively.)

Read more on the Cassini mission site here.

An irregular crescent: Cassini's flyby of Helene on June 18, 2011.

Images: NASA / JPL / Space Science Institute.

The longest day – Summer Solstice 21st June 2011

Solstice Sunset Credit:Adrian West

[/caption]

June 21st, 2011 is Summer Solstice – the longest day of the year.

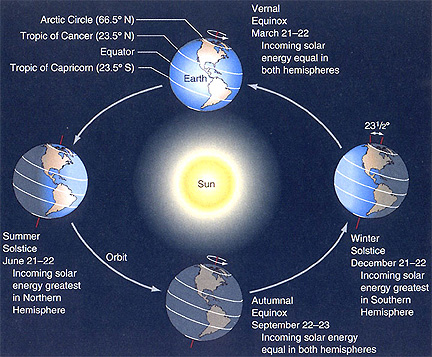
This is the time when the Sun is at its highest or most northerly point in the sky in the Northern Hemisphere and when we receive the most hours of daylight. If you live in the Southern Hemisphere it is the reverse, so you will be having “Winter Solstice.”

Also known as “Midsummer” the Summer Solstice gets its name from the Latin for sol (sun) and sistere (to stand still). The Sun reaches its most Northerly point and momentarily stands still before starting its journey South in the sky again until it reaches its most Southerly point “Winter Solstice”, before repeating the cycle. This is basically how we get our seasons.

It’s not actually the Sun that moves North or South over the seasons although it may appear so. It’s the Earths axial tilt that causes the Sun to change position in the sky as the Earth orbits the Sun throughout the year.

Why Are There Seasons
The angle of the Sun and the Earth's seasons. Image credit: NASA

Summer Solstice/ Midsummer is steeped in ancient folklore especially in Northern Europe with the most famous place directly related to it being Stonehenge, where the sun has been worshiped for thousands of years.

Stonehenge Credit: bistrochic.net

The Sun reaches its most Northerly point in the sky at 17:16 UTC momentarily and from that point forward starts to make its way South. This means the days will get shorter and shorter until Winter Solstice in December.