
This isn’t exactly space news, but here’s a behind-the-scenes video interview with me and Think Traffic’s Corbett Barr. It’s about how I run Universe Today, what I’ve done over the last few years to increase the traffic and number of subscribers, and the software company I co-founded to let other webmasters to the same thing.
Observing Challenge: A Gathering of Galaxies – Hickson 44
[/caption]
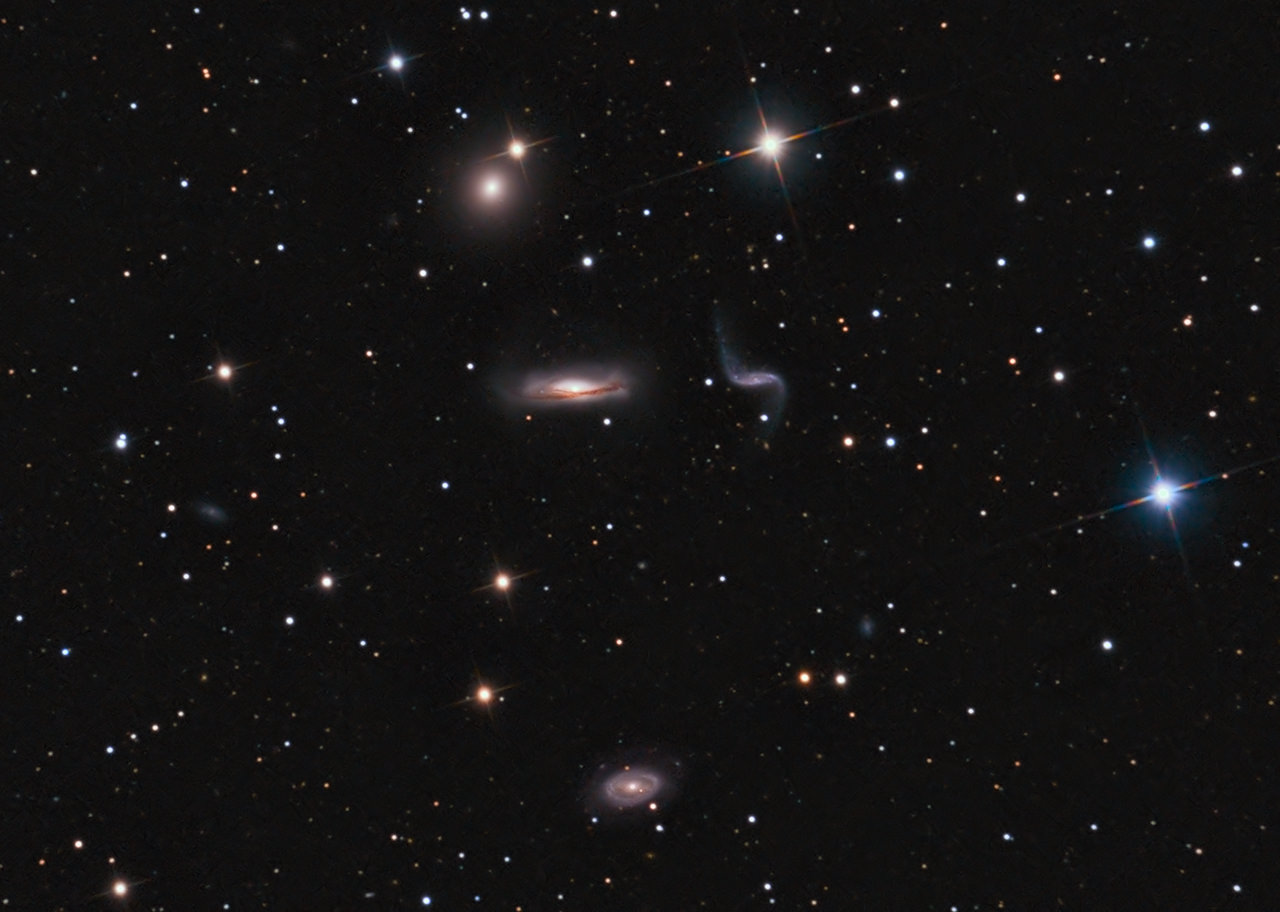
If you turn your telescope towards Leo, you just might discover a group of galaxies which reside close to our own Milky Way – Hickson Compact Group 44. At only 60 million light years away, this diverse and interesting collection has quite a story to tell!
Some three decades ago, Canadian astronomer, Paul Hickson set about the task of completing a list of 100 galaxies clusters. But, they couldn’t be just any set of galaxies – they had to be isolated, compact and within a limited magnitude range. His purpose was to study them for unusual redshifts among their members – and to improve our knowledge of galactic evolution. From his work came the theory that perhaps all well-known galaxies once emerged from such clusters and this hypothesis also contributed mightily to our understanding of dark matter as well. What Hickson left us with is a legacy of beautiful objects that challenge not only the telescope – but the mind as well.
In this photo done by Warren Keller, you will see from 11 o’clock: NGC 3193; 3190 and 3187 at center, and 3185 at 6 o’clock. A closer look reveals two tiny galaxies PGC (Principal Galaxies Catalog) 2806871 near 8 o’clock and PGC 86788 near 5 o’clock. As you can see, this group is an interesting collection of galaxy types – from barred spiral to elliptical in structure… close enough to share material as they gravitationally interact.
While some of you may recognize the three principle players in this galactic act as the “Leo Trio”, take a closer look at barred spiral NGC 3190. It was first discovered by Sir William Herschel in 1784 and was home to two supernova events in 2002. Lurking at its heart is an active galactic nucleus (AGN), home to a super-massive black hole. While the discovery of the rare Type Ia supernova was unusual enough, adding a second similar supernova event occurring simultaneously made this galactic action even more rare. Two young x-ray emitting events, set against a record breaking amount of obscuring dust!
Perhaps the interaction with nearby NGC 3187 is the root cause? It is, after all, evolving. Studies indicate an evolutionary sequence for Hickson compact groups in which the amount of diffuse light increases with the dynamical evolution of the group. “Compact groups are associations of a few galaxies in which the environment plays an important role in galaxy evolution.” says J. A. L. Aguerri (et al). “The low group velocity dispersion favors tidal interactions and mergers, which may bring stars from galaxies to the diffuse intragroup light. Numerical simulations of galaxy clusters in hierarchical cosmologies show that the amount of the diffuse light increases with the dynamical evolution of the cluster.”
While this group of galaxies is evolving and interacting together across vast distances, you can collect them all in the same eyepiece view found about halfway between Gamma and Zeta Leonis (RA: 10h18m00.4s Dec: +21°48’44”). They are by no means easy, the faintest of which is magnitude 13, but it can be accomplished with a minimum of a 150mm telescope under dark, clear skies.
Remember, the beauty is in the challenge… and the discovery!
Mars’ Underground Atmosphere
[/caption]
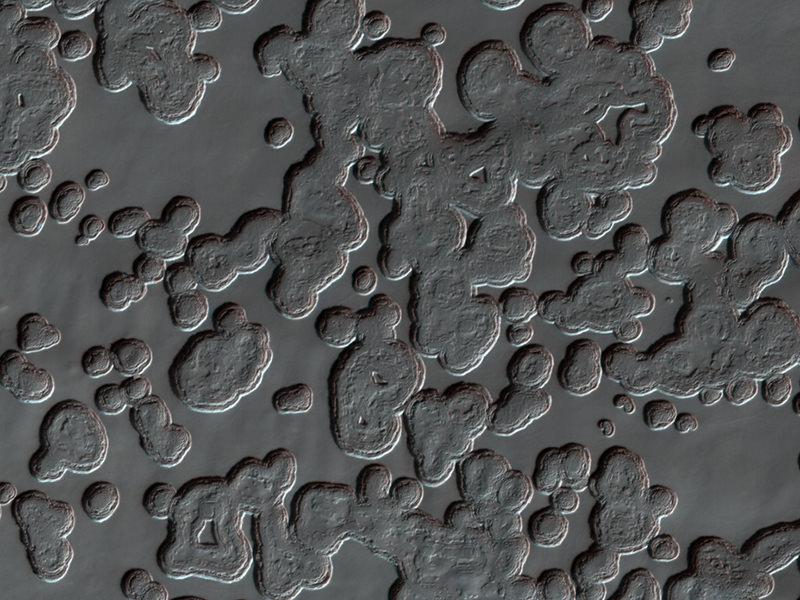
Scientists have spotted an underground reservoir near Mars’ south pole the size of Lake Superior… except that this lake is filled with frozen carbon dioxide – a.k.a. “dry ice”!
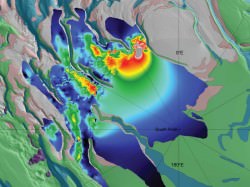
A recent report by scientists at the Southwest Research Institute in Boulder, CO reveals variations in Mars’ axial tilt can change how much carbon dioxide gets released into the atmosphere, affecting factors from the stability of water on its surface to the power and frequency of dust storms.
The Mars Reconnaissance Orbiter’s ground-penetrating Shallow Radar identified a subsurface deposit of frozen material, confirmed as carbon dioxide ice by its radar signature and visual correlation to the surface pitting seen above. As the polar surface warms during the Martian spring, underground CO2 deposits evaporate (or “sublime”) leaving behind round depressions in the frozen ground. (This has been aptly dubbed “swiss cheese terrain” by researchers on the HiRISE imaging team.)
While scientists were aware of seasonal CO2 ice layers atop the water ice this new discovery brings to light nearly 30 times more frozen CO2 than was previously believed to exist. In fact this particular deposit alone contains 80% the amount of CO2 currently present in the planet’s entire atmosphere.
The importance of this finding is how the carbon dioxide ultimately affects the global Martian climate as it freezes and thaws. When the CO2 is frozen and locked away in subsurface deposits like this, it’s not free to enter the atmosphere and do what CO2 does best: warm the planet… as well as increase atmospheric pressure. This means that liquid water cannot last as readily on the surface since it will either freeze or boil away. Also with less air pressure the strength of wind is decreased, so dust storms are less frequent and less severe.
When factored in with the axial tilt difference – and thus variations in the amount of sunlight hitting the poles – researchers’ models show that Mars’ average atmospheric pressure may at times be 75% higher than it is today.
These shifts in the orientation of the Red Planet’s axis occur on 100,000-year intervals… long by human standards but geologically very frequent. Mars may have had liquid water existing on its surface fairly recently!

Although this may sound that Mars has had its own share of global warming due to CO2 emissions in its history, it must be remembered that Mars and Earth have very different atmospheric compositions. Earth’s atmosphere is much thicker and denser than Mars’, so even when doubling its CO2 content Mars’ atmosphere is still too thin and dry to create a strong greenhouse effect… especially considering that the polar caps on Mars increase cooling more than additional CO2 in the atmosphere raises global temperature. Without oceans and atmosphere to collect and distribute heat, the effect of any warming quickly radiates out into space…and eventually the planet swings back into a freeze-dried state.
“Unlike Earth, which has a thick, moist atmosphere that produces a strong greenhouse effect, Mars’ atmosphere is too thin and dry to produce as strong a greenhouse effect as Earth’s, even when you double its carbon-dioxide content.”
– Robert Haberle, planetary scientist at NASA’s Ames Research Center
Read the full news release on the NASA Missions site.
Image credit: NASA / JPL / University of Arizona
Did the Early Universe Have Just One Dimension?
[/caption]
From a University of Buffalo press release:
Did the early universe have just one spatial dimension? That’s the mind-boggling concept at the heart of a theory that physicist Dejan Stojkovic from the University at Buffalo and colleagues proposed in 2010. They suggested that the early universe — which exploded from a single point and was very, very small at first — was one-dimensional (like a straight line) before expanding to include two dimensions (like a plane) and then three (like the world in which we live today).
The theory, if valid, would address important problems in particle physics.
Now, in a new paper in Physical Review Letters, Stojkovic and Loyola Marymount University physicist Jonas Mureika describe a test that could prove or disprove the “vanishing dimensions” hypothesis.
Because it takes time for light and other waves to travel to Earth, telescopes peering out into space can, essentially, look back into time as they probe the universe’s outer reaches.
Gravitational waves can’t exist in one- or two-dimensional space. So Stojkovic and Mureika have reasoned that the Laser Interferometer Space Antenna (LISA), a planned international gravitational observatory, should not detect any gravitational waves emanating from the lower-dimensional epochs of the early universe.
Stojkovic, an assistant professor of physics, says the theory of evolving dimensions represents a radical shift from the way we think about the cosmos — about how our universe came to be.
The core idea is that the dimensionality of space depends on the size of the space we’re observing, with smaller spaces associated with fewer dimensions. That means that a fourth dimension will open up — if it hasn’t already — as the universe continues to expand.
The theory also suggests that space has fewer dimensions at very high energies of the kind associated with the early, post-big bang universe.
If Stojkovic and his colleagues are right, they will be helping to address fundamental problems with the standard model of particle physics, including the following:
The incompatibility between quantum mechanics and general relativity. Quantum mechanics and general relativity are mathematical frameworks that describe the physics of the universe. Quantum mechanics is good at describing the universe at very small scales, while relativity is good at describing the universe at large scales. Currently, the two theories are considered incompatible; but if the universe, at its smallest levels, had fewer dimensions, mathematical discrepancies between the two frameworks would disappear.
Physicists have observed that the expansion of the universe is speeding up, and they don’t know why. The addition of new dimensions as the universe grows would explain this acceleration. (Stojkovic says a fourth dimension may have already opened at large, cosmological scales.)
The standard model of particle physics predicts the existence of an as yet undiscovered elementary particle called the Higgs boson. For equations in the standard model to accurately describe the observed physics of the real world, however, researchers must artificially adjust the mass of the Higgs boson for interactions between particles that take place at high energies. If space has fewer dimensions at high energies, the need for this kind of “tuning” disappears.
“What we’re proposing here is a shift in paradigm,” Stojkovic said. “Physicists have struggled with the same problems for 10, 20, 30 years, and straight-forward extensions of the existing ideas are unlikely to solve them.”
“We have to take into account the possibility that something is systematically wrong with our ideas,” he continued. “We need something radical and new, and this is something radical and new.”
Because the planned deployment of LISA is still years away, it may be a long time before Stojkovic and his colleagues are able to test their ideas this way.
However, some experimental evidence already points to the possible existence of lower-dimensional space.
Specifically, scientists have observed that the main energy flux of cosmic ray particles with energies exceeding 1 teraelectron volt — the kind of high energy associated with the very early universe — are aligned along a two-dimensional plane.
If high energies do correspond with lower-dimensional space, as the “vanishing dimensions” theory proposes, researchers working with the Large Hadron Collider particle accelerator in Europe should see planar scattering at such energies.
Stojkovic says the observation of such events would be “a very exciting, independent test of our proposed ideas.”
Sources: EurekAlert, Physical Review Letters.
Off to Florida for the Shuttle Launch
[/caption]
It might surprise you to know that I’ve never been to a rocket launch. Even though I’ve been publishing Universe Today for over 11 years, and written thousands of articles about space and astronomy, covering every aspect of the space industry, I’ve never actually experienced it first hand.
It’s the blessing and the curse of the internet, I guess. I started Universe Today in my spare time, from my house in Vancouver because it was possible. With myself as the journalist (and publisher), I didn’t need anyone’s permission to just start reporting. Thanks to the internet, I could reach an audience of thousands, and eventually millions – for free. And somehow it turned into a career. I was able to bring in enough advertising revenue to cover my salary, and even bring on other writers. But I’ve always been so busy handling the business/webmastering side of Universe Today that I’ve never taken the time to go to Florida and report on a rocket launch for myself.
Well, that’s about to change. On April 29th, 2011, the space shuttle Endeavour is going to blast off for the last time, delivering the Alpha Magnetic Spectrometer and an ExPRESS Logistics Carrier to the International Space Station. And I’m going to be covering the story, live, from the Kennedy Space Center, together with Jason and Ken.
This mission has a personal angle as well. It was just over 30 years ago, on April 12th, 1981 when the space shuttle launched for the first time – STS-1. My father was always a fan of space exploration, and he woke me up early that morning so we could watch the launch of Columbia together on our tiny black-and-white television. I remember that day vividly, and it was one of the turning points of my life. I can trace my entire career in space journalism right back to that April morning.
I’ve always put off making the epic journey from Vancouver Island to Cape Canaveral, but I just couldn’t put it off any longer. I had to do this one personally. See you in Florida.
Lockheed Accelerates Orion to Achieve 2013 launch and potential 2016 Manned Lunar Flyby
[/caption]
KENNEDY SPACE CENTER – Despite utilizing just half the work force originally planned and cutting back further on the original test program, Lockheed Martin is now accelerating the Orion Multi-Purpose Crew Vehicle (MPCV) launch schedule and aiming to achieve an Earth orbital flight by 2013 and a human crewed flight as early as 2016. The first Orion crew cabin has been built and construction of the second spacecraft has begun.
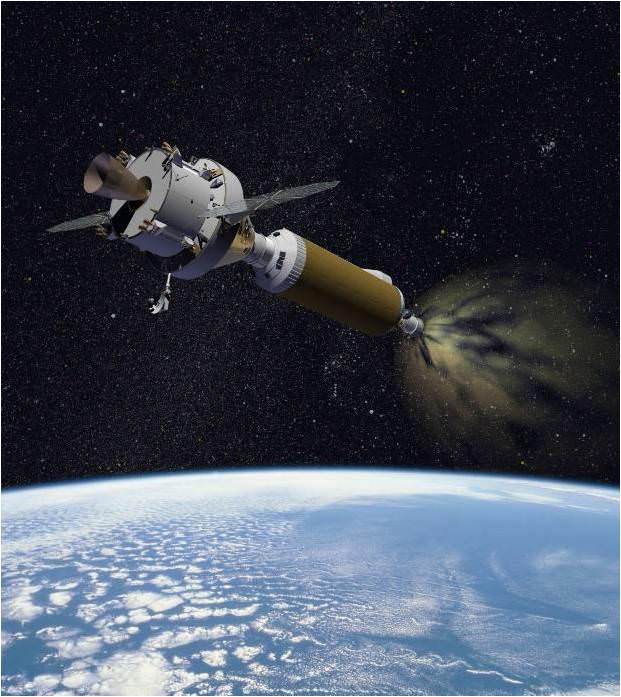
What’s more is that a bold “manned mission beyond low Earth orbit and even a lunar fly by is possible in 2016 if NASA’s new heavy lift rocket is developed in time,” says John Karas, vice president of Lockheed Martin’s Human Space Flight programs, in an exclusive interview with Universe Today. A bipartisan majority in Congress recently approved funding for the Heavy lift booster and mandated that the first flight occur in 2016.
“In order to go to the moon, we need NASA’s new heavy lifter,” Karas explained. Orion was designed with the capability to fly human crews to low Earth orbit (LEO) and the International Space Station, as well as beyond to deep space, the Moon, Asteroids, Lagrange Points and Mars.
Orion is NASA’s next generation crew vehicle and is intended to someday replace the Space Shuttle program, which will be fully retired just three months from now.
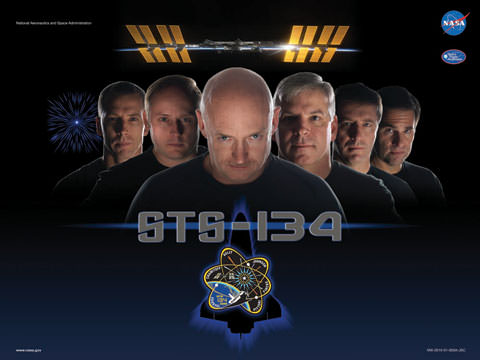
The second to last shuttle flight – STS 134 – is slated for launch this week on April 29 and President Obama and the entire First Family will attend.
Lockheed Martin is the prime contractor for Orion under a multi-year contract awarded by NASA in 2006.
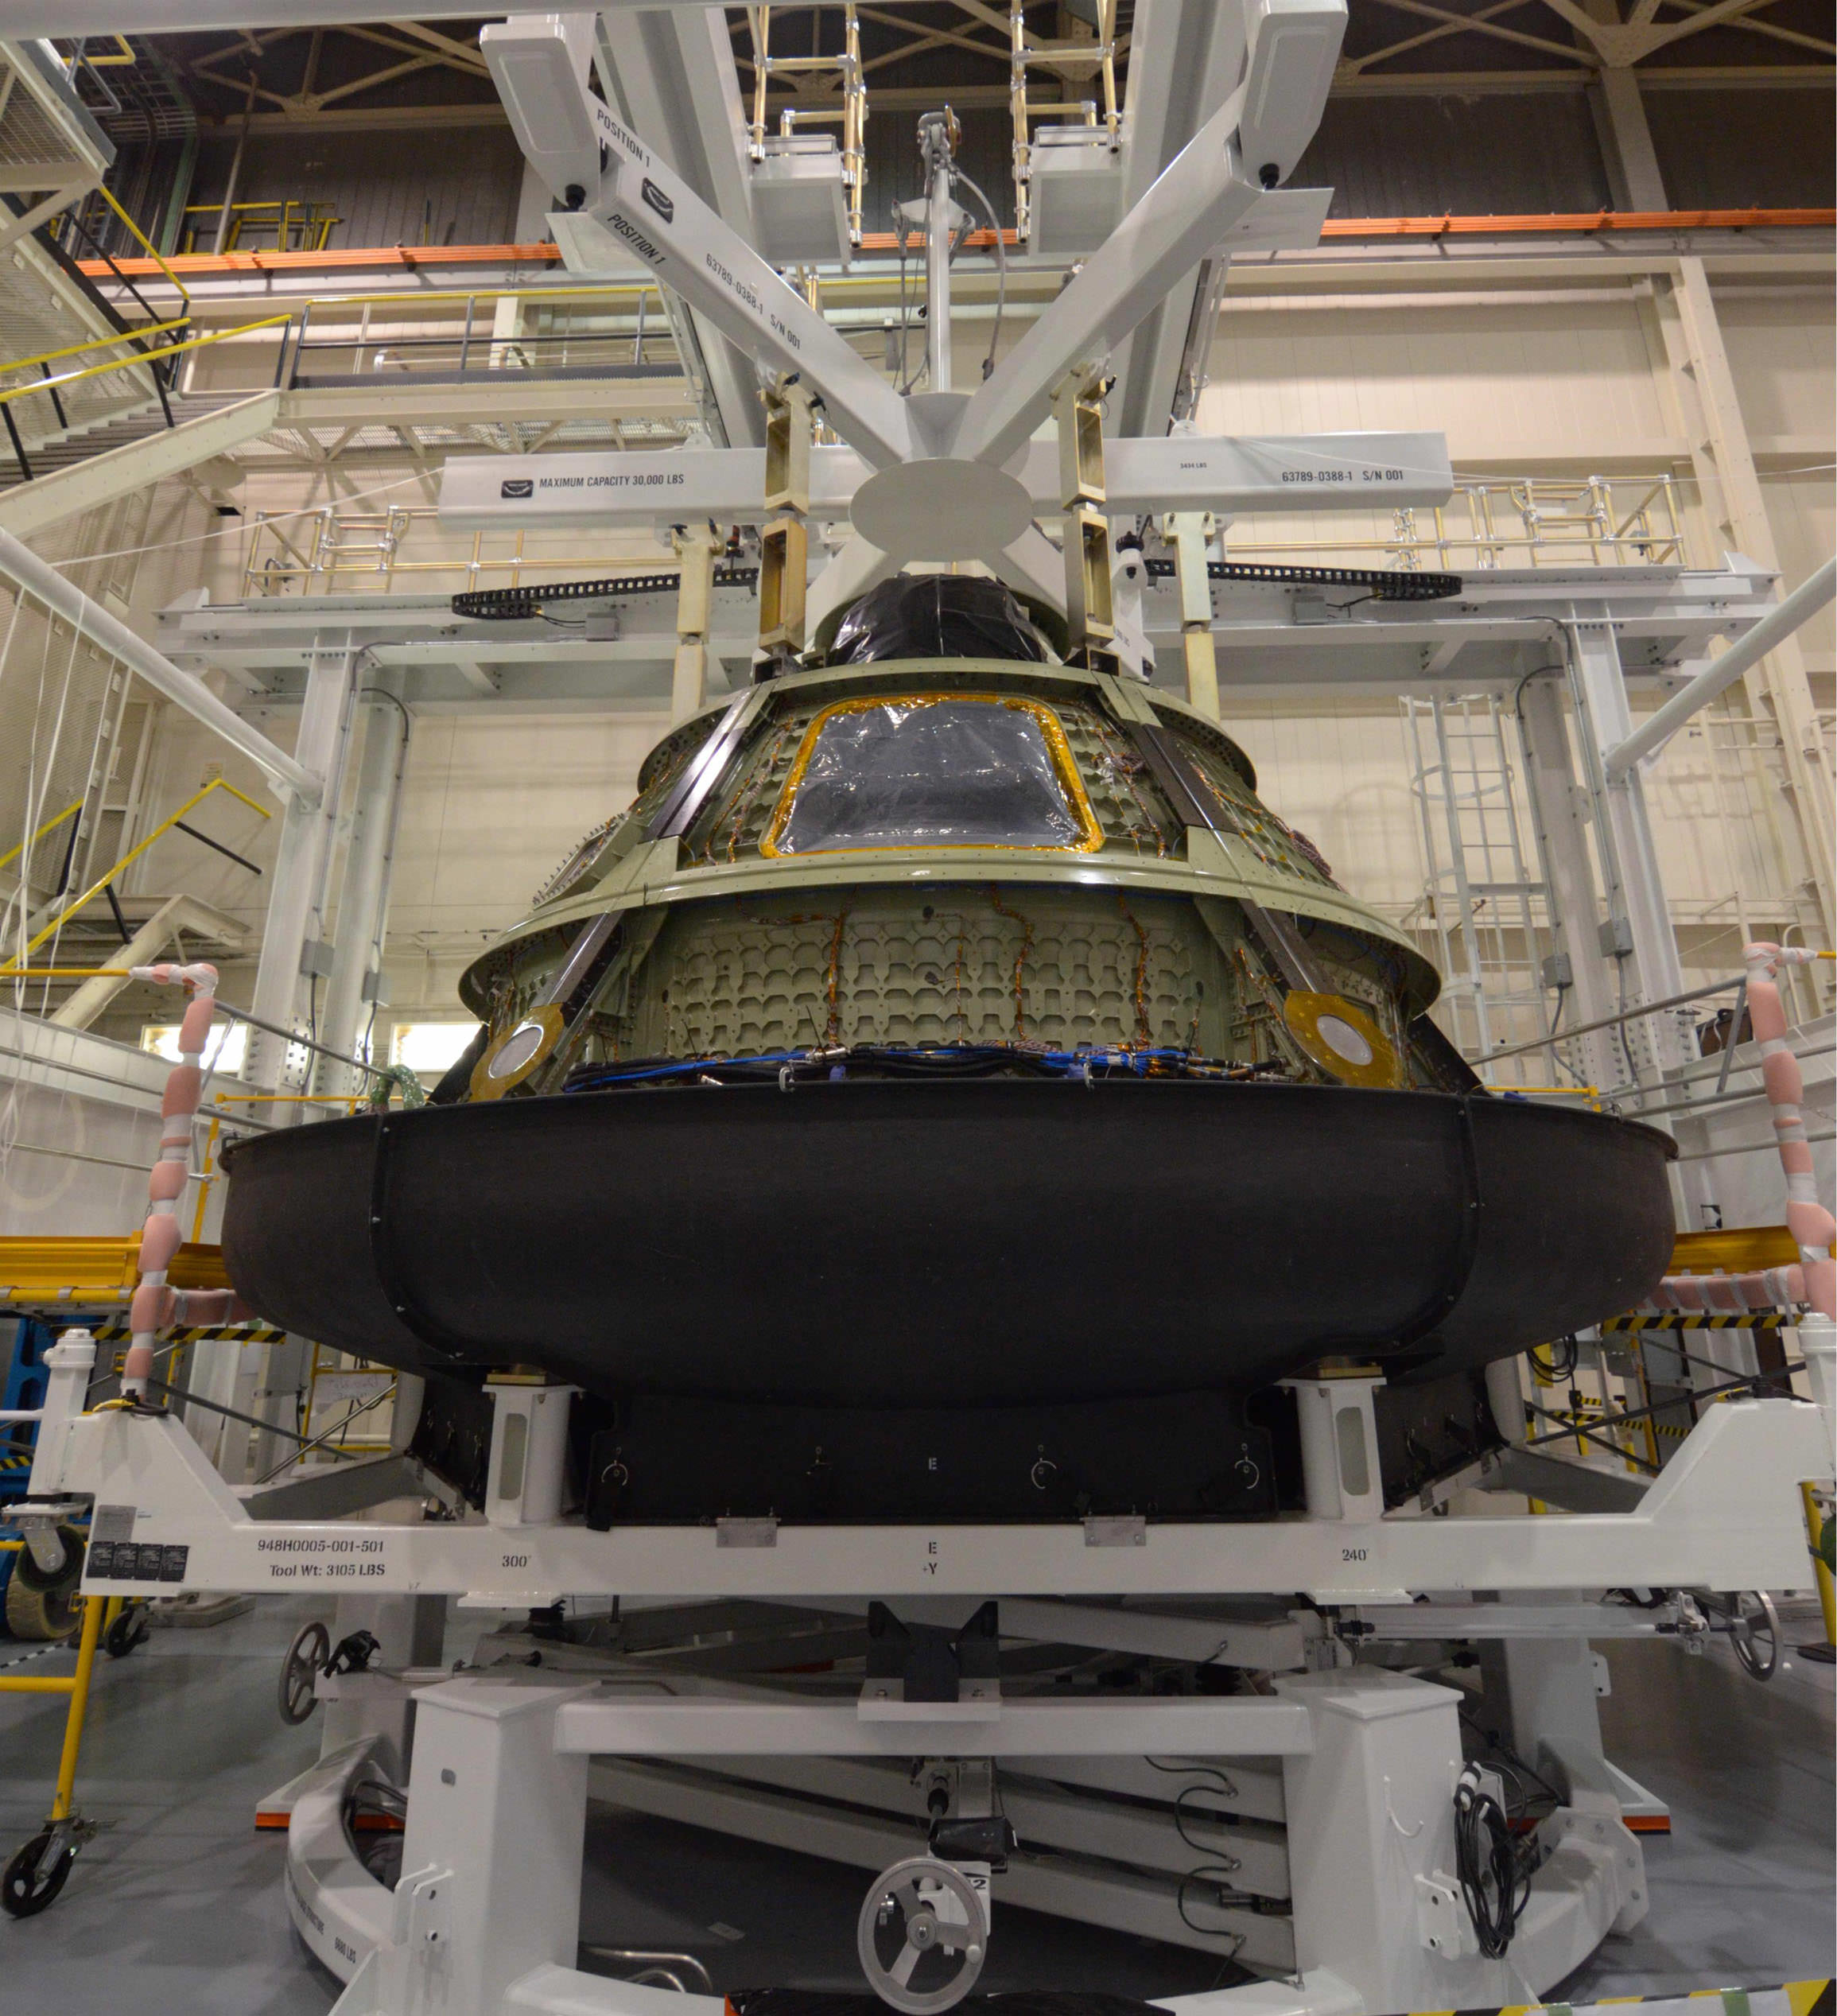
Orion crew module during recent installation of back shell panel at Lockheed Martin’s Vertical Test Facility in Denver, Colorado. Credit: NASA
Karas told me that the streamlined test program would involve flying one Orion mission per year – of increasing complexity – from 2013 to 2016. “Lockheed Martin is working with NASA to determine what are the right launch vehicles and the right missions.”
American astronauts could return to the moon in 5 years after a more than 40 year long hiatus.
“Right now we are building a brand new crew cabin for the first Orion mission; OFT-1. But everything depends on the budget.”
“For the inaugural Orion test flight in 2013 NASA is considering a Delta IV Heavy booster rocket,” Karas said. “The Atlas V is not powerful enough to send the whole 50,000 pound spacecraft into orbit. With an Atlas we could only launch an Orion crew module. You would have to have delete the Service Module (SM) and /or other subsystems.”
“Orion would be lofted some 7,000 miles out, and then sent back for Earth reentry to simulate something close to lunar velocity, around 80% or so. So we would definitely be testing the deep space environment. Therefore the test flight would be a lot more involved than just a simple Earth orbital reentry.
“For the first Orion mission, we will put as much capability on it as possible depending on the budget,” Karas amplified. “But it’s unlikely to have solar arrays without a few hundred million more bucks. The capability is money limited.”
“The 2014 flight could be a high altitude abort test or perhaps something else.”
“Then a full up unmanned test flight would follow in 2015,” Karas explained.
“If we have a heavy lifter, the 2016 flight with the first human crew could be a deep space mission or a lunar fly by lasting more than a week.”
Lockheed has already constructed the initial Orion crew vehicle – known as the first article or Ground Test Article (GTA). The Orion GTA first article was built at NASA’s Michoud Assembly Facility (MAF) in New Orleans, LA where I inspected it after the structural framework was welded into one piece.
Following the installation of mass and volume simulators and a successful series of pressure tests, the first article was then shipped in February this year to the company’s new state-of-the-art Space Operation Simulation Center (SOSC) located in Denver, Colorado.
“At Denver, we are going to finish the assembly of the first article by July of this year so it looks like a spacecraft – adding the doors, windows, thermal tiles and more,” Karas said. “Then it undergoes rigorous acoustics tests until September – known as Shake and Bake – to simulate all aspects of the harsh environment of deep space.”
The next step after that was to send it to NASA Langley for intensive water drop landing tests. But that plan may well change Karas told me.
“The first article – or GTA – is flight worthy. So we don’t want to break the spacecraft during the water landing tests. In the newly revised plan it may be used on the 2nd Orion flight in 2014 instead of reserving it for ground tests only. It would fly with a service module, but not solar panels. The first article could even be the first flight vehicle if the program funding is insufficient.”
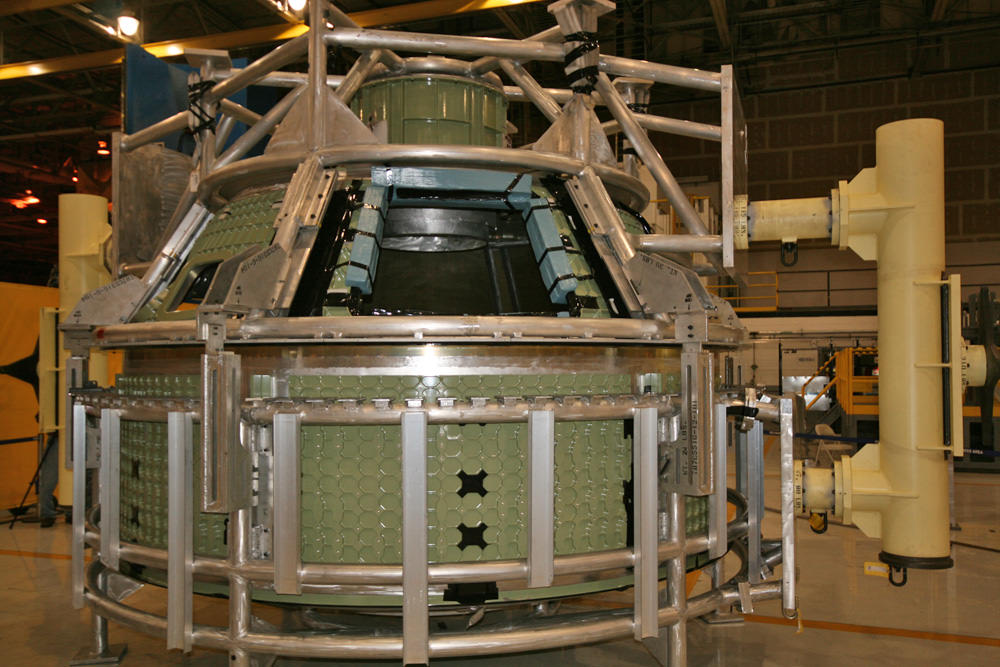
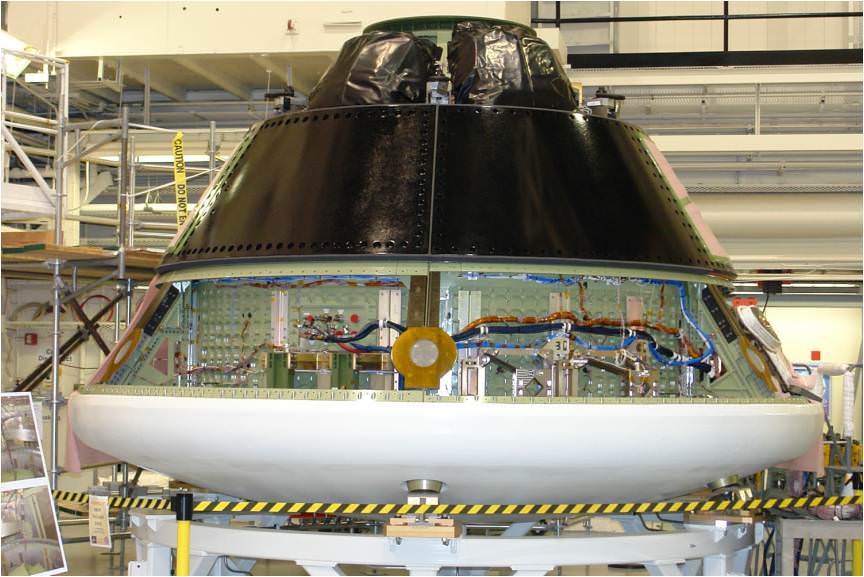
Orion cabin view with astronaut crew hatch and window openings at NASA Michoud Assembly Facility, New Orleans, LA is now undergoing testing and integration at Lockheed’s new state-of-the-art Space Operation Simulation Center (SOSC) in Denver, Colorado. Credit: Ken Kremer
“We have only half the budget for Orion that was planned earlier by NASA,” Karas stated.
“1500 less people are working on Orion since 1 year ago from the start to the end of 2010 – and that number includes all the subcontractors. We had to lay off a lot of people, including some folks we intended to hire.”
“MAF is now focused on building the composite structures of the first Service Module with about 200 people. That’s about half of what should have been about 400 folks. The earlier work at Michoud (MAF) focused on the metallic structures of the cabin for the first article,” said Karas.
To a large degree, launching astronauts to deep space is more a matter of sheer political will power then solving technical issues. And it all comes down to the bucks.
If NASA’s Heavy lifter is not available an alternative scenario with other expendable rockets would have to be developed to achieve the escape velocity required to send a crew of astronauts to the Moon.
Lockheed Martin has independently proposed a stepping stone approach that would send astronauts in Orion spacecraft to challenging deep space targets such as the Moon, and elsewhere such as Asteroids, Lagrange points and Mars that have never been done before and which I’ll feature in upcoming articles.
“Exploration missions that are affordable and sustainable will inevitably lead to technological innovation, to scientific discovery, and to public inspiration and spark an interest in STEM careers that can help the United States counter the overwhelming numerical disadvantage in college graduates it faces in these disciplines in developing third-world nations,’ says Karas.
Read my recent Orion and Shuttle articles:
NASAs First Orion Capsule and New Space Operations Center Unveiled
NASAs First Orion Capsule Ships for Crucial Deep Space Tests
President Obama to Attend Endeavour’s Last Launch on April 29
Shuttle Endeavour Photo Special: On Top of Pad 39A for Final Flight
‘In Flight’ Shuttle Orbiter retirement display planned by Kennedy Space Center Visitor Complex
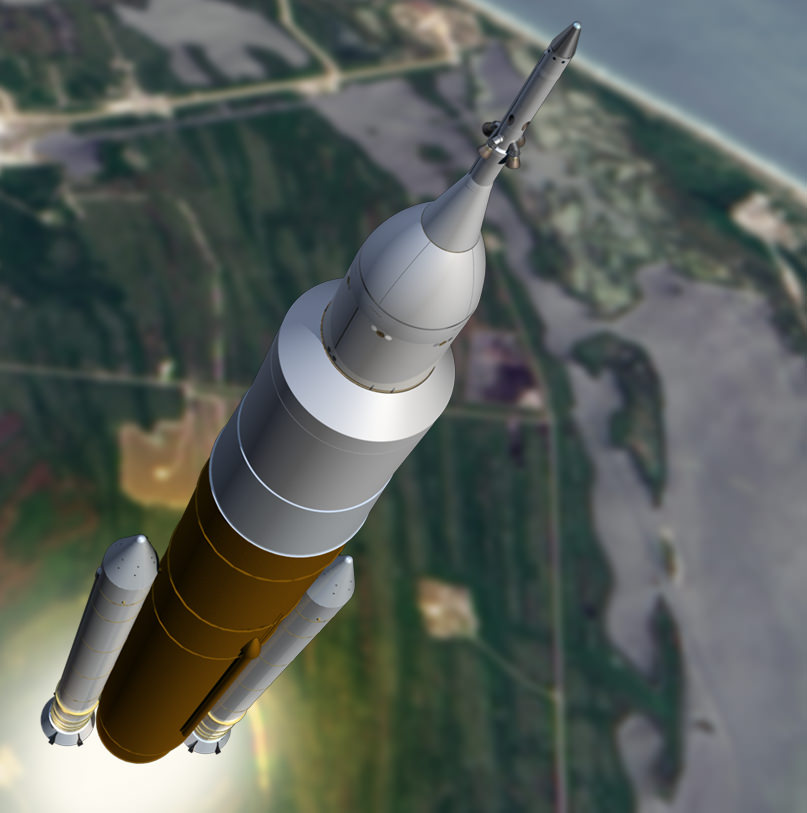
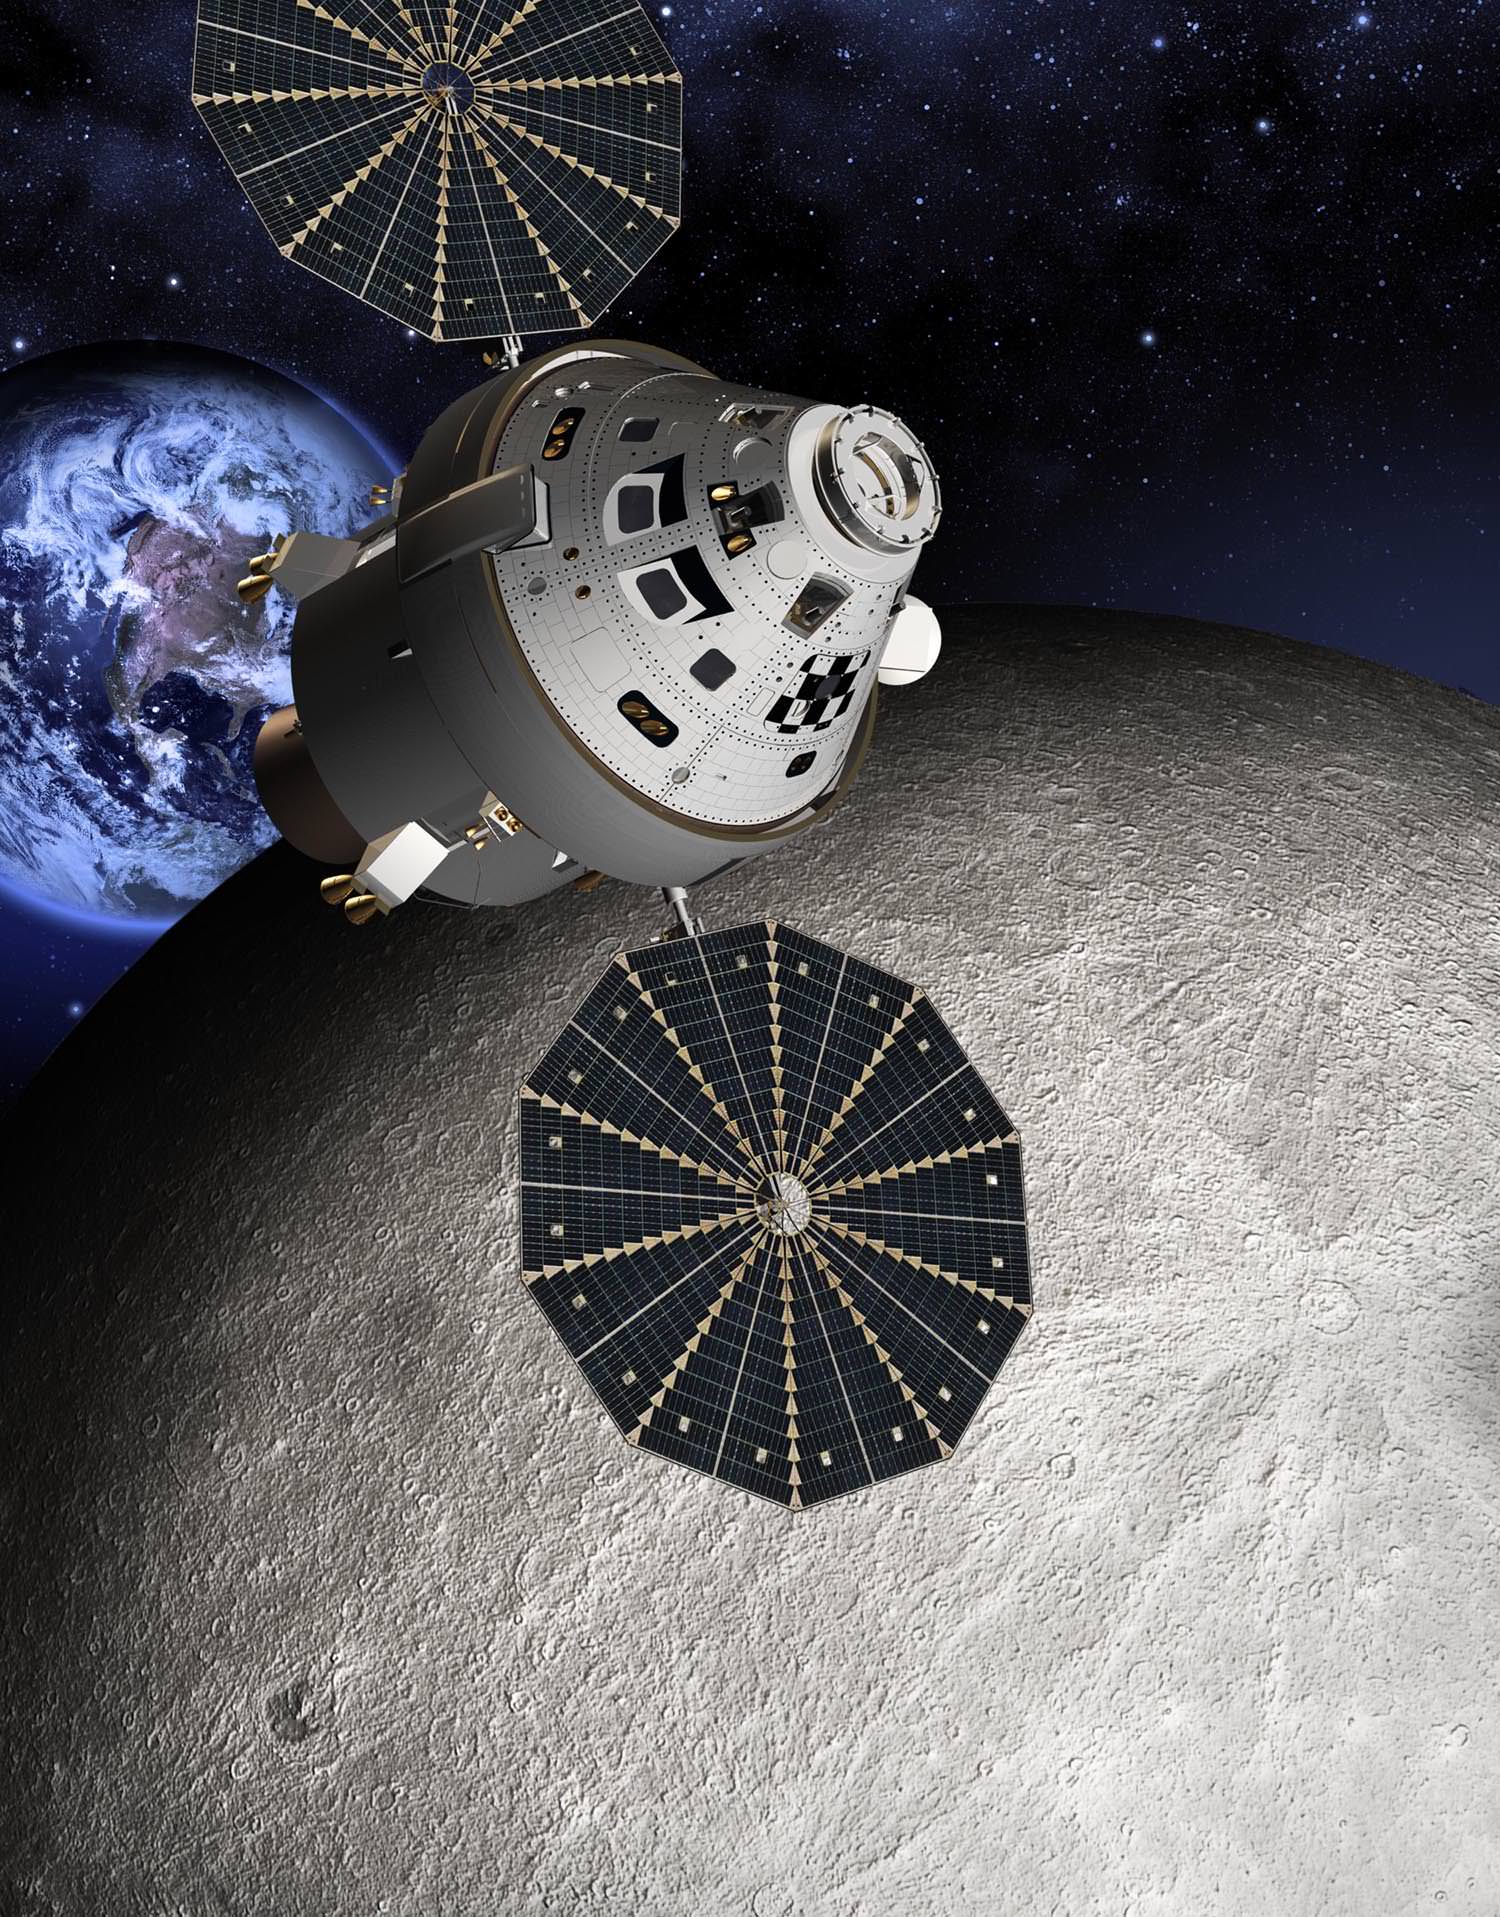
Orion could launch on a lunar flyby mission in 2016 atop NASA’s new Heavy lift booster from the Kennedy Space Center. Credit: Lockheed Martin.
Planets Party In The Morning April 28-May 1
[/caption]
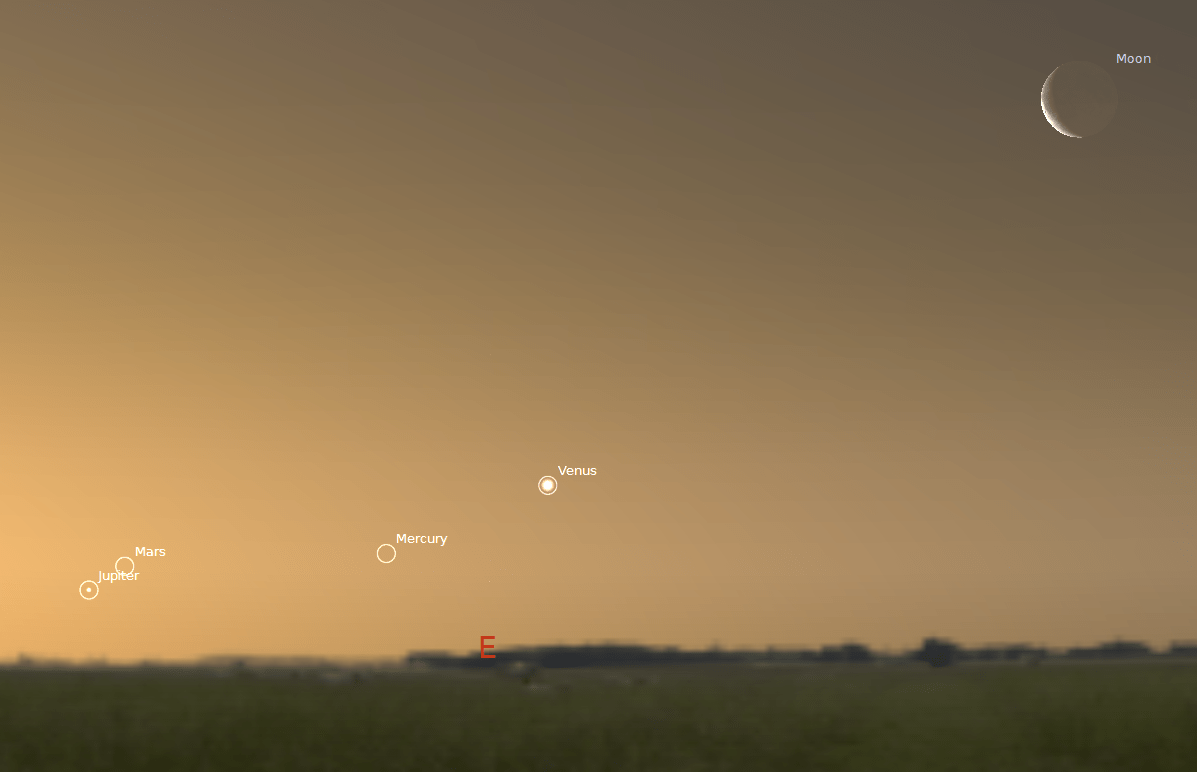
Set your alarm clocks for an early treat about a half an hour before sunrise on Thursday April 28 through Sunday, May 1, 2011, as there will be a planetary delight in store! Go out and with either a pair of binoculars, a small telescope, or just use your naked eyes and find an unobscured view of the Eastern horizon to see a conjunction (objects near each other in the sky) of the planets Jupiter, Mars, Venus and Mercury, below and to the left of the thin crescent moon.
Bright Venus will be easy to spot first, then Mercury followed by Jupiter. The real challenge is to find Mars which will be very close to Jupiter. See the above diagram for help on where each object is located.
If you are unlucky on the first morning, try again the following day for a chance to see this rare planetary occurrence.
While observing this close to the Sun take care and never look at the sun directly with your eyes and never through an optical instrument, as this will permanently damage your eyesight or blind you!
Only special purpose made solar telescopes and filters are safe for viewing the sun.
Russia Has Concerns for SpaceX Safety for Docking to ISS
[/caption]
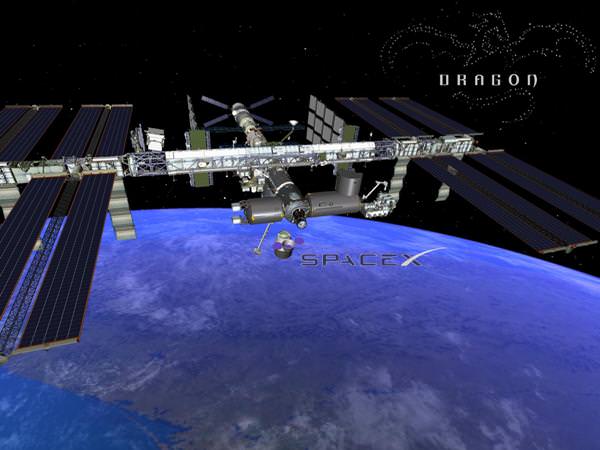
While a test of SpaceX’s Dragon spacecraft docking capabilities with the International Space Station is tentatively scheduled for December, 2011, Russia has said it will not allow a SpaceX vehicle to dock with the ISS unless its safety is fully tested. “We will not issue docking permission unless the necessary level of reliability and safety is proven,” said Alexei Krasov, head of the human spaceflight department of Roscosmos. “So far we have no proof that those spacecraft duly comply with the accepted norms of spaceflight safety.”
NASA has not yet commented on the statement by Krasov, which was reported by the Russian media.
SpaceX has requested NASA to authorize the docking in December after another test flight of the Dragon sometime this summer. As it stands now, approximately twelve cargo resupply flights are planned by SpaceX through 2015, and SpaceX CEO has said he would like to start crewed flights by 2016.
Some critics are viewing Russia’s objections as having little to do with safety and more to do with the monopoly it will have for access to the ISS once the space shuttle program concludes later this summer. Russia has raised its going rates for ferrying US astronauts to the space station on the Soyuz space craft and for bringing cargo with the Progress craft resupply ship.
Source: Space Travel
Budget Woes Put SETI’s Allen Telescope Array into “Hibernation”
[/caption]
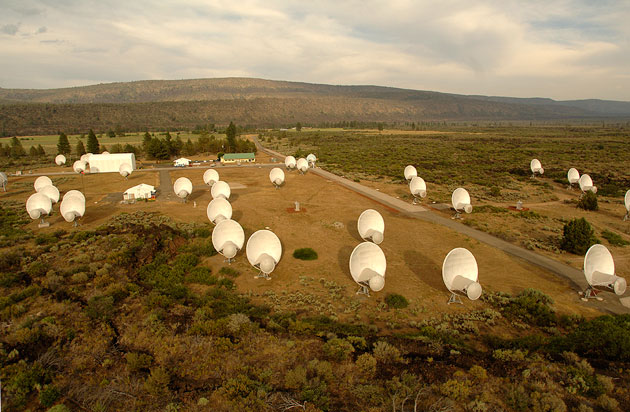
SETI, the Search for Extraterrestrial Intelligence has suffered a big blow. The primary alien search engine –the Allen Telescope Array (ATA) in northern California — has been shut down due to budget woes. In a letter last week, the CEO of the SETI Institute, Tom Pierson told donors that in the ATA has been put into “hibernation,” — a safe mode of sorts, where “the equipment is unavailable for normal observations and is being maintained in a safe state by a significantly reduced staff.”
The ATA has been in hibernation since April 15, with the equipment put in a safe configuration so that it stays ready to be turned back on should the SETI Institute find new sources of funding.
While the ATA is not the only radio telescope that can be used for SETI searches, it was the observatory that was primarily used for that task, and now SETI researchers will have to borrow time on telescopes where “competition for observing time can be fierce or piggyback their searches on other ongoing observations,” according to John Matson, writing for Scientific American.
The ATA was operating with 42 antennas, and was scheduled to expand gradually to 350 six-meter radio antennas to listen for possible radio emissions from any faraway civilizations that might exist elsewhere in the galaxy. But after the first $50 million phase was completed in 2007, additions to the array were delayed due to lack of funding.
NASA had funded some of the early SETI projects, but Congress canceled any NASA contributions in 1993. The nonprofit SETI Institute, founded in 1984, relies mainly on private donations to support its research. Microsoft co-founder Paul Allen, had contributed $25 million to the first phase, with donations and grants funding the rest.
According to astronomer Franck Marchis, who works for the SETI Institute and the University of California, Berkeley – which is responsible for operating the ATA, “the financial state of the observatory degraded significantly over the past 2 years with the loss of various sources of funding (NSF, California state) at UC Berkeley” forcing UC Berkeley to withdraw from the SETI project. And, as Marchis wrote on his blog, “because the project is mainly funded through private donors, the economic recession had a huge impact and delayed significantly the expansion of the array impacting the overall project.”
In his letter, Pierson said that NSF funding has been reduced to approximately one-tenth of what it formerly gave to SETI. “This is compounded by growing State of California budget shortfalls that have severely reduced the amount of state funds available to the Radio Astronomy Lab.”
ATA operations cost about $1.5 million per year, Pierson said, and the SETI science campaign at ATA costs another $1 million annually.
Pierson said that the SETI Institute has been working for more than two years to find additional funding, such as providing assistance to the US Air Force in tracking orbital debris. The SETI Institute is also currently working on a fundraising campaign to raise $5 million so that the ATA can be used to focus on the potentially habitable planets found by the Kepler telescope.
For anyone who is interested in donating SETI, and in particular the ATA and their search of signals from the Kepler database of planets, see this website.
Sources: Scientific American, Cosmic Diary, SETI Institute
Is Winking Near-Earth Asteroid GP59 Really the Missing Apollo 13 Panel?
[/caption]
Is the recently discovered “winking” asteroid – GP59 – really the missing panel from the ill-fated Apollo 13 mission? According to the latest internet buzz, it could be as possible as Mars being as large as the full Moon…
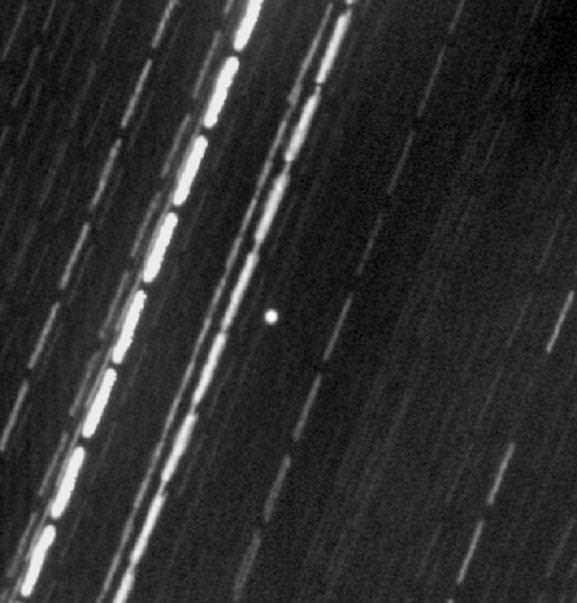
With the recent anniversary of the Apollo 13 disaster conveniently coinciding with the discovery of “winking” near-Earth asteroid GP59, anxious theorists are ready to believe they are one and the same. Thanks to the asteroid’s rapid tumble and quick magnitude changes, it’s no small wonder that it would appear on the surface to be so. Just take a look at this GP59 Video done by Joe Brimacombe and you’ll see why.
With discoveries of artifacts continually found on Earth, such as missing pieces of the Titanic, it wouldn’t take a great leap of faith to believe we might have recovered one in space as well – even the panel that blew away from Apollo 13. However, we need to take a look at that equation times four – the 4 panels that protected the LM during launch – the Spacecraft Lunar Module Adapter (SLA) panels. Says Marshall Eubanks, ” In the Saturn V launches, the SLA panels were ejected, with separation velocity of about 2 meters / second. They were 6.4 meters tall, about 3 meters wide at the apex, made of a 0.043 meters thick aluminum honeycomb, plus about 1 mm of cork and paint, and so have a very low mass-area ratio. If 2011 GP59 is an SLA panel, then it should have 3 clones with very similar orbits.”
With today’s huge advances in amateur telescopes, there remains a possiblity – however small – that we may someday recover objects like these. “I could see a situation in which a panel was spinning around its short axis, with that axis tilted a bit toward the Sun, so that there would be a systematic pressure accelerating or decelerating it. (Sort of like what the fans of spin-stabilized solar sails hope to do.) The problem would be that over a full orbit around the Sun, the net acceleration would cancel out.” says Bill Gray. “The bottom line remains: there is no particularly good reason to think there’s a connection between these panels and 2011 GP59. (Even if the panels were big enough to match the observed brightness of 2011 GP59, which they aren’t.) If the panels are ever recovered, they’re apt to be in much more Earth-like orbits. With 36 of them out there, the odds seem decent that we’ll see one of them someday.”
But don’t hold your breath when it comes to GP59… it is what it is… a tumbling, oblong asteroid roughly 47 meters in diameter. “Usually, when we see an asteroid strobe on and off like that, it means that the body is elongated and we are viewing it broadside along its long axis first, and then on its narrow end as it rotates ,” said Don Yeomans, manager of NASA’s Near-Earth Object Program Office at the Jet Propulsion Laboratory in Pasadena, Calif. “GP59 is approximately 50 meters [240 feet] long, and we think its period of rotation is about seven-and-a-half minutes. This makes the object’s brightness change every four minutes or so.”
And our hearts skip a beat just thinking of the possiblities…