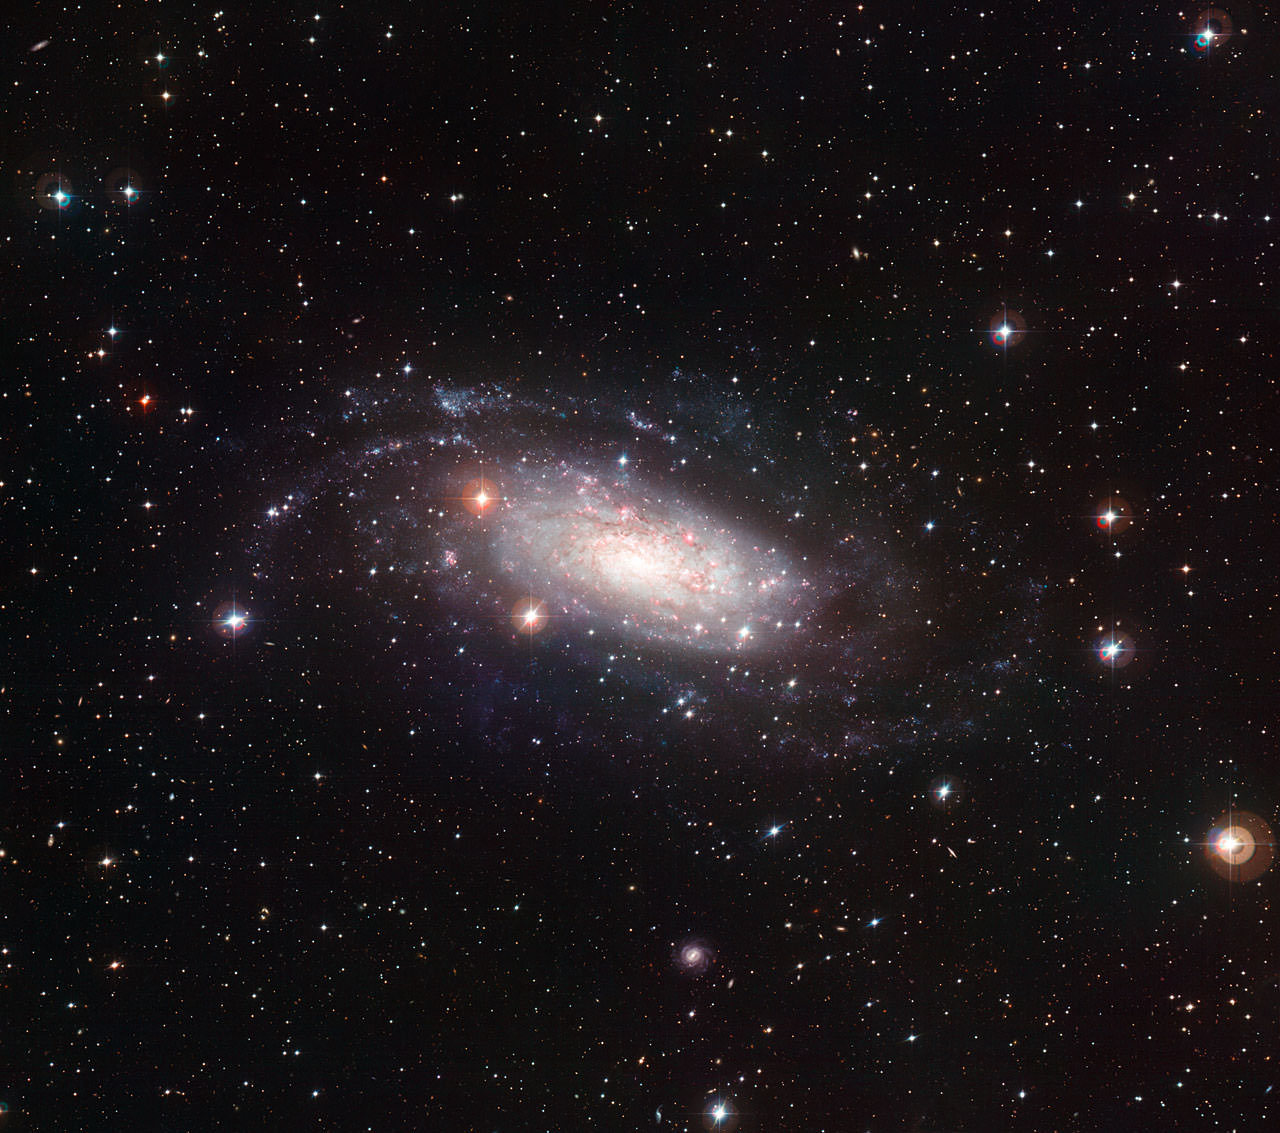
Magnetic Fields on O-Class Stars

Star classifications. Image credit: Kieff

[/caption]

The primary method by which astronomers can measure magnetic field strength on stars is the Zeeman effect. This effect is the splitting of spectral lines into two due to the magnetic field’s effect on the quantum structure of the orbitals. For massive O-class stars, their spectra are largely featureless in the visual portion of the spectra due to an insufficient number of atoms with electrons in the necessary orbitals to undergo transitions which can produce visual spectral lines. Thus, determining whether or not these stars have magnetic fields has been a unique challenge. A new paper from researchers at the University of Amsterdam, led by Roald Schnerr, looks for evidence of these fields in the form of synchrotron radiation.

Synchrotron radiation is a form of light produced when relativistic, charged particles move through a magnetic field. The light emitted can be generated in any portion of the spectra from radio to gamma rays, depending on the strength of the field. Astronomically, this was first detected in 1956 by Geoffrey Burbidge in the jets of M87 and has since been used to explain emission in planetary magnetospheres, supernovae, near black holes, and around pulsars.

This form of energy distinguishes itself from other forms of light in two main fashions. The first is that it is highly polarized. This property is generated by the electric and magnetic components always being in the same planes and can be studied with filters that only allow light with its fields in appropriate planes to pass. The second is that the radiation created is “non-thermal”. In other words, it doesn’t match the distribution of wavelengths generated by a blackbody.

Models of massive, O-class stars suggest they should contain magnetic fields. Some evidence has seemed to confirm this. Previous studies have also shown that the stellar winds from some of these stars varies with timescales similar to the rotation rates of the stars which could be interpreted as winds being slowed on some faces by the magnetic field as it swept by.

Schnerr’s team attempted to bolster the evidence for magnetic fields by detecting the non-thermal radiation from these stars. The team selected 5 stars which have been shown to have strongly variable winds, some with cyclic variations and used the Westerbork Synthesis Radio Telescope, in the Netherlands to search for non-blackbody signals. The radio range was selected due to the predicted magnetic field strength.

Ultimately, only three of the five selected targets could be observed with the chosen telescope and only one of those, ξ Persei, showed evidence of a non-thermal spectrum. But while this strengthens the case for magnetic fields on the star, it raises another question: From where do the relativistic particles originate? Although O-class stars have strong stellar winds, their speeds are well studied and well below the necessary velocity.

One clue could come from the fact that ξ Persei is a “runaway star”. These stars have velocities and plunge through the interstellar medium at 30-200 km/sec. The team suggests that a bow shock created by this motion could result in sufficiently high velocities. Whether or not ξ Per has such a bow shock is something that could be determined with additional observations.

While this research provides some interesting clues to the nature of these magnetic fields on these stars, it still relies on a small sample. This technique can certainly be expanded to a larger number of stars in the future and may help astronomers better constrain their models of stellar workings.

Astronomy Without A Telescope – The Edge of Greatness

The foamy cosmic web – at this scale we run out of superlatives to describe the large scale structure of the universe.

[/caption]

The so-called End of Greatness is where you give up trying to find more superlatives to describe large scale objects in the universe. Currently the Sloan Great Wall – a roughly organised collection of galactic superclusters partitioning one great void from another great void – is about where most cosmologists draw the line.

Beyond the End of Greatness, it’s best just to consider the universe as a holistic entity – and at this scale we consider it isotropic and homogenous, which we need to do to make our current cosmology math work. But at the very edge of greatness, we find the cosmic web.

The cosmic web is not a thing we can directly observe since its 3d structure is derived from red shift data to indicate the relative distance of galaxies, as well as their apparent position in the sky. When you pull all this together, the resulting 3d structure seems like a complex web of galactic cluster filaments interconnecting at supercluster nodes and interspersed by huge voids. These voids are bubble-like – so that we talk about structures like the Sloan Great Wall, as being the outer surface of such a bubble. And we also talk about the whole cosmic web being ‘foamy’.

It is speculated that the great voids or bubbles, around which the cosmic web seems to be organised, formed out of tiny dips in the primordial energy density (which can be seen in the cosmic microwave background), although a convincing correlation remains to be demonstrated.

The two degree field (2df) galaxy redshift survey – which used an instrument with a field of view of two degrees, although the survey covered 1500 square degrees of sky in two directions. The wedge shape results from the 3d nature of the data - where there are more galaxies the farther out you look, within one region of the sky. The foamy bubbles of the cosmic web are visible. Credit: The Australian Astronomical Observatory.

As is well recorded, the Andromeda Galaxy is probably on a collision course with the Milky Way and they may collide in about 4.5 billion years. So, not every galaxy in the universe is rushing away from every other galaxy in the universe – it’s just a general tendency. Each galaxy has its own proper motion in space-time, which it is likely to continue to follow despite the underlying expansion of the universe.

It may be that much of the growing separation between galaxies is a result of expansion of the void bubbles, rather than equal expansion everywhere. It’s as though once gravity loses its grip between distant structures – expansion (or dark energy, if you like) takes over and that gap begins to expand unchecked – while elsewhere, clusters and superclusters of galaxies still manage to hold together. This scenario remains consistent with Edwin Hubble’s finding that the large majority of galaxies are rushing away from us, even if they are not all equally rushing away from each other.

van de Weygaert et al are investigating the cosmic web from the perspective of topology – a branch of geometry which looks at spatial properties which are preserved in objects undergoing deformation. This approach seems ideal to model the evolving large scale structure of an expanding universe.

The paper below represents an early step in this work, but shows that a cosmic web structure can be loosely modelled by assuming that all data points (i.e. galaxies) move outwards from the central point of the void they lie most proximal to. This rule creates alpha shapes, which are generalised surfaces that can be built over data points – and the outcome is a mathematically modelled foamy-looking cosmic web.

Further reading: van de Weygaert et al. Alpha Shape Topology of the Cosmic Web.

M33’s “Object-X”

Often times, objects that are unremarkable in one portion of the spectra, can often be vivid in others. In M33, the Triangulum Galaxy, a star that’s barely visible in the optical, stands out as the second brightest source (and single brightest single star) in the mid-infrared. This unusual star has been the target of a recent study, led by Rubab Khan at the Ohio State University and may help astronomers to understand an unusual supernova from 2008.

The supernova 2008S occurred February first in NGC 6946, the Fireworks Galaxy. Since it happened in a galaxy that is relatively nearby, astronomers seized the opportunity to explore the progenitor star in archival images. Yet images from the Large Binocular Telescope and other optical observatories could not find a star that could be identified as a parent. Instead, the detection of the star responsible came from Spitzer, an infrared observatory. Observations from this instrument indicated that the star responsible may have been unexpectedly low mass for such a powerful explosion leading other astronomers to question whether or not SN 2008S was a true supernova, or merely an impostor in the form of an eruption of a Luminous Blue Variable (LBV), which tend to be more massive stars and would be in stark contradiction to the Spitzer findings.

Yet, regardless of the nature of the nature of SN 2008S, teams all seemed to agree that the progenitor had only been detected in the infrared because it was veiled by a thick curtain of dust. So to help better understand this class of dusty stars, astronomers have been working to uncover more of them, against which they can test their hypotheses.

To find these objects, astronomers have been searching the infrared portion of the spectrum for objects that are exceptionally bright yet lack optical counterparts. The brightest of the stellar sources in M33 features faint star in the red portion of the optical spectrum from the Local Group Galaxies Survey published in 2007, but no star at all in archival records with similar limiting magnitudes from 1949 and 1991. The authors of the new study have dubbed this odd source, Object-X.

The team rules out the possibility that the object could be a young stellar object (YSO), blocked by a thick dust disc along the line of sight, noting that models of even the thickest dust discs still predict more light to be scattered back along the line of sight. Instead, the team concludes that Object-X must be a self-obscured star that has undergone relatively recent mass loss which has cooled to form either graphite or silicate dust. Depending on which type of dust is predominant, the team was able to fit the data to two wildly different temperatures for the star: either 5000 K for graphite, or 20,000 K for the silicate. In all cases, the predicted mass for the central star was always greater than 30 solar masses.

In general, there are two mechanisms by which a star can eject material to form such a curtain. The first is through stellar winds, which increase as the star enters the red giant phase, swelling up and lowering the force of gravity near the surface. The second is “impulsive mass ejections” in which stars shudder and throw mass off that way. A classical example of this is Eta Carinae. The team predicts from the features they found, that Object-X is most likely a cool hypergiant. The fact that the star was completely obscured until very recently hints that the mass loss is not constant (as stellar wind), but patchy, coming from frequent eruptions. As the shell of dust expands, the star should reemerge in the optical, becoming visible again in the next few decades.

Tearing Apart Apollo 11 Inaccuracies

The movie trailer for Transformers 3 came out over a week ago, and seeing it is a facepalm moment for any true human spaceflight follower, fan, aficionado, or historian. I mean really, — and yes, I know this is a movie — but how could they portray what they call “a generation’s greatest achievement” so inaccurately? I originally decided I wasn’t going to post it, because it basically re-writes history and I can only imagine how the conspiracy theorists will run with this. Plus getting this kind of thing into the public mindset, I fear, will be another “Capricorn 1” moment where people construe the movie as proof that NASA is hiding things. But Robert Pearlman over at collectSPACE posted an article today, basically tearing apart the trailer, discussing every inaccuracy in detail. So watch the trailer, above, and then go check out Robert’s article — its great.

And then, while you’re at it, go read Robert Krulwich’s article on NPR’s website, where he gets a unusually lengthy response from Neil Armstrong about what really happened on the Apollo 11 moon walk, and why it was so short.

Convex Lens

Convex Lens

As every child is sure to find out at some point in their life, lenses can be an endless source of fun. They can be used for everything from examining small objects and type to focusing the sun’s rays. In the latter case, hopefully they choose to be humanitarian and burn things like paper and grass rather than ants! But the fact remains, a Convex Lens is the source of this scientific marvel. Typically made of glass or transparent plastic, a convex lens has at least one surface that curves outward like the exterior of a sphere. Of all lenses, it is the most common given its many uses.

A convex lens is also known as a converging lens. A converging lens is a lens that converges rays of light that are traveling parallel to its principal axis. They can be identified by their shape which is relatively thick across the middle and thin at the upper and lower edges. The edges are curved outward rather than inward. As light approaches the lens, the rays are parallel. As each ray reaches the glass surface, it refracts according to the effective angle of incidence at that point of the lens. Since the surface is curved, different rays of light will refract to different degrees; the outermost rays will refract the most. This runs contrary to what occurs when a divergent lens (otherwise known as concave, biconcave or plano-concave) is employed. In this case, light is refracted away from the axis and outward.

Lenses are classified by the curvature of the two optical surfaces. If the lens is biconvex or plano-convex, the lens is called positive or converging. Most convex lenses fall into this category. A lens is biconvex (or double convex, or just convex) if both surfaces are convex. These types of lenses are used in the manufacture of magnifying glasses. If both surfaces have the same radius of curvature, the lens is known as an equiconvex biconvex. If one of the surfaces is flat, the lens is plano-convex (or plano-concave depending on the curvature of the other surface). A lens with one convex and one concave side is convex-concave or meniscus. These lenses are used in the manufacture of corrective lenses.

For an illustrated example of how images are formed with a convex lens, click here.

We have written many articles about lenses for Universe Today. Here’s an article about the concave lens, and here’s an article about telescope lens.

If you’d like more info on convex lens, check out these articles from The Physics Classroom and Wikipedia.

We’ve also recorded an episode of Astronomy Cast all about the Telescope. Listen here, Episode 33: Choosing and Using a Telescope.

Sources:
http://en.wikipedia.org/wiki/Lens_(optics)
http://homepage.mac.com/cbakken/obookshelf/cvreal.html
http://www.play-hookey.com/optics/lens_convex.html
http://www.answers.com/topic/convex-lens-1
http://www.physicsclassroom.com/class/refrn/u14l5a.cfm
http://www.tutorvista.com/content/science/science-ii/refraction-light/formation-convex.php

Conservation of Mass

Conservation of Mass
Conservation of Mass. Image Credit: www.efm.leeds.ac.uk

[/caption]While it may offend anyone currently trying to lose that holiday weight, it is a classic physical law that in a closed system, mass can neither be created nor destroyed. Feeling discouraged yet? Well, don’t! Strictly speaking, this law does NOT mean you can’t drop pounds, just that within an isolated system (which your body is not) mass cannot be created/destroyed, although it may be rearranged in space, and changed into different types of particles. This law is known as the Conversation of Mass, otherwise known as the principal of mass/matter conservation. More specifically, the law states that the mass of an isolated system cannot be changed as a result of processes acting inside the system. This implies that for any chemical process in a closed system, the mass of the reactants must equal the mass of the products. The law is considered “classical” in that it does not take into consideration more recent physical laws, such as special relativity or quantum mechanics, but still applies in many contexts.

This law is rooted in classical Greek philosophy, which states that “nothing can come from nothing”, often stated in its Latin form: ex nihlionihlio fit. The basic premise here, first espoused by Empedocles (ca. 490–430 BCE), is that no new matter can come into existence where none was present before. It was further elaborated on by Epicurus, Parmenedes, and a number of Indian and Arab philosophers. However, it was not until the 18th century with Antoine Lavoisier that it graduated from the field of cosmology and became a scientific law. Lavoisier was the first to clearly outlined it in his seminal work TraitéÉlémentaire de Chimie (Elementary Treatise on Chemistry) in 1789.

Historically, the conservation of mass and weight was obscure for millennia because of the buoyant effect of the Earth’s atmosphere on the weight of gases. In addition, when a substance burns, mass appears to be lost since ashes weight less than the original substance. These effects were not understood until careful experiments in which chemical reactions such as rusting were performed in sealed glass ampules, whereby it was found that the chemical reaction did not change the weight of the sealed container. Once understood, the conservation of mass was of great importance in changing alchemy to modern chemistry. When chemists realized that substances never disappeared from measurement with the scales (once buoyancy effects were held constant, or had otherwise been accounted for), they could for the first time embark on quantitative studies of the transformations of substances.

The historical concept of both matter and mass conservation is widely used in many fields such as chemistry, mechanics, and fluid dynamics. In relativity, the mass-energy equivalence theorem states that mass conservation is equivalent to energy conservation, which is the first law of thermodynamics.

We have written many articles about the conservation of mass for Universe Today. Here’s an article about nuclear fusion, and here’s an article about the atom.

If you’d like more info on the law of conservation of mass, check out these articles from NASA Glenn Research Center and Engineering Toolbox.

We’ve also recorded an entire episode of Astronomy Cast all about the Atom. Listen here, Episode 164: Inside the Atom.

Sources:
http://en.wikipedia.org/wiki/Conservation_of_mass
http://www.grc.nasa.gov/WWW/K-12/airplane/mass.html
http://en.wikipedia.org/wiki/Nothing_comes_from_nothing
http://en.wikipedia.org/wiki/Antoine_Lavoisier
http://en.wikipedia.org/wiki/Jain_philosophy

Powerful Mars Orbiter Directs Opportunity to Clays and Hydrated Minerals

This map indicates geological units in the region of Mars around a smaller area where Opportunity has driven from early 2004 through late 2010. The blue-coded unit encompassing most of the southern half of the mapped region is ancient cratered terrain. In the northern region, it is overlain by younger sediments of the Meridiani Plains, punctuated by the even younger Bopulu impact. At Endeavour Crater, in the upper right near the gold line of Opportunity's traverse, ancient cratered terrain is exposed around the crater rim. Locations where orbital observations have detected clay minerals are indicated at the western edge of Endeavour and at two locations in the southern portion of the map. The mineral mapping was done by Sandra Wiseman and Ray Arvidson of Washington Universty in St. Louis based on observations by the Compact Reconnaissance Imaging Spectrometer for Mars (CRISM) on NASA's Mars Reconnaissance Orbiter.

[/caption]

NASA is using its powerful science surveyor orbiting more than 241 kilometers above Mars to target the surface explorations of the long lived Opportunity rover to compelling science targets on the ground. Opportunity is currently on a long term trek to the giant crater named Endeavour, some 22 kilometers in diameter, which shows significant signatures of clays and water bearing sulfate minerals which formed in the presence of flowing liquid water billions of years ago.

An armada of orbiters and rovers from Earth are carrying out a coordinated attack plan to unlock the mysteries of the red planet, foremost being to determine whether life ever arose on Mars.

On Dec. 15 (Sol 2450), Opportunity arrived at Santa Maria crater which is just 6 km distant from the western rim of Endeavour. Over the past 2 years, the rover has traversed more than two thirds of the 19 km distance from Victoria crater -her last big target – to Endeavour.

High resolution spectral and imaging mappers aboard NASA’s Mars Reconnaissance Orbiter (MRO) are enabling researchers on the rover team to prioritize targets and strategically guide Opportunity to the most fruitful locations for scientific investigations.

The on board CRISM mapping spectrometer has detected clay minerals, or phyllosilicates, at multiple locations around Endeavour crater including the western rim closest to Opportunity. CRISM is the acronym for Compact Reconnaissance Imaging Spectrometer for Mars. Images from MRO’s HiRISE camera are utilized to scout out the safest and most efficient route. See maps above and below.

“This is the first time mineral detections from orbit are being used in tactical decisions about where to drive on Mars,” said Ray Arvidson of Washington University in St. Louis. Arvidson is the deputy principal investigator for the Spirit and Opportunity rovers and a co-investigator for CRISM.

Clay minerals are a very exciting scientific find because they can form in more neutral and much less acidic aqueous environments which are more conducive to the possibility for the formation of life. They have never before been studied up close by science instruments on a landed mission.

Opportunity may soon get a quick taste of water bearing sulfate minerals at Santa Maria because spectral data from CRISM suggest the presence of sulfate deposits at the southeast rim of the crater. Opportunity has previously investigated these sulfate minerals at other locations along her circuitous traverse route – but which she discovered without the help of orbital assets.

“We’ve just pulled up to the rim of Santa Maria, and the workload is very high,” Steve Squyres informed me. Squyres, of Cornell University, is the Principal Scientific Investigator for NASA’s Spirit and Opportunity Mars rovers.

Opportunity drove to within about 5 meters of the crater rim on Dec. 16 (Sol 2451). JPL Mars rover driver Scott Maxwell tweeted this message ; “Today’s NAVCAM mosaic of Santa Maria Crater. Woo-hoo! Glorious and beautiful!” and this twitpic

Orbital Observations at Santa Maria Crater.
Opportunity just arrived at the western side of Santa Maria Crater, some 90 meters wide, on 15 December 2010. Researchers are using data collected by a powerful mineral mapping spectrometer (CRISM) aboard NASA’s Mars Reconnaissance Orbiter (MRO) to direct the route which Opportunity is traversing on Mars during the long term journey to Endeavour crater. Spectral observations recorded by CRISM indicates the presence of water-bearing sulfate minerals at the location shown by the red dot on the southeast rim crater whereas the crater floor at the blue dot does not. This image was taken by the the High Resolution Imaging Science Experiment (HiRISE) camera also on MRO. Credit: NASA/JPL-Caltech/Univ. of Arizona

The rover will conduct an extensive science campaign at Santa Maria by driving to different spots over the next several weeks and gathering data to compare observations on the ground to those from CRISM in orbit.

Opportunity Navcam camera view of Santa Maria Crater just 5 m from the rim on Sol 2451, Dec. 16, 2010. Click to enlarge

Santa Maria crater appears to be relatively fresh and steep walled and was likely created by a meteor strike only a few million years ago. Endeavour is an ancient crater with a discontinuous rim that is heavily eroded at many points. By exploring craters, scientists can look back in time and decipher earlier geologic periods in Mars history.

Scientists believe that the clay minerals stem from an earlier time period in Martian history and that the sulfate deposits formed later. Mars has experiences many episodes of wet environments at diverse locations in the past and climate-change cycles persist into the present era.

After the upcoming Solar Conjunction in February 2011, Opportunity will depart eastwards for the last leg of the long march to Endeavour. She heads for a rim fragment dubbed Cape York which spectral data show is surrounded by exposures of water bearing minerals. Cape York is not yet visible in the long distance images because it lies to low. See maps below.

Thereafter, Opportunity alters direction and turns south towards her next goal –
Cape Tribulation – which is even more enticing to researchers because CRISM has detected exposures of the clay minerals formed in the milder environments more favorable to life. Cape Tribulation has been clearly visible in rover images already taken months ago in early 2010.

Opportunity could reach Endeavour sometime in 2011 if she can continue to survive the harsh environment of Mars and drive at her current accelerated pace. Opportunity arrived at Mars in January 2004 for a planned 90 day mission. The rover has far surpassed all expectations and will soon celebrate 7 earth years of continuous operations on the red planet. Virtually all the data from Spirit and Opportunity are relayed back to Earth via NASA’s Mars Odyssey orbiter.


Opportunity used its panoramic camera in a super-resolution technique to record this view of the horizon on Sol 2298 (July 11, 2010) which shows the western rim of Endeavour Crater, including the highest ridge informally named “Cape Tribulation”. CRISM data revealed exposures of clay minerals at Cape Tribulation.

Opportunity’s Path on Mars Through Sol 2436
The red line shows where Opportunity has driven from the place where it landed in January 2004 — inside Eagle Crater, at the upper left end of the track — to where it reached on the 2,436th Martian day, or sol, of its work on Mars (Nov. 30, 2010). The map covers an area about 15 kilometers (9 miles) wide. North is at the top. Subsequent drives brought Opportunity to Santa Maria Crater, which is about 90 meters (295 feet) in diameter. After investigating Santa Maria the rover heads for Endeavour Crater. The western edge of 22-kilometer-wide (14-mile-wide) Endeavour is in the lower right corner of this map. Some sections of the discontinuous raised rim and nearby features are indicated with informal names on the map: rim segments “Cape York” and “Solander Point”; a low area between them called “Botany Bay”; “Antares” crater, which formed on sedimentary rocks where the rim was eroded down; and rim fragment “Cape Tribulation,” where orbital observations have detected clay minerals. The base map is a mosaic of images from the Context Camera on NASA’s Mars Reconnaissance Orbiter.

Astronomy Cast Ep. 209: Exotic Life

Is this arsenic based life?

We don’t like to cover news on Astronomy Cast, but sometimes there’s a news story that’s interesting, complicated, and rapidly unfolding – and it happens to cover an area that we haven’t talked much about. So today we thought we’d talk about the discovery of arsenic-based life, and exotic forms of life in general. Maybe we need to redefine our definition of life. Or maybe we just got introduced to some distant cousins.

Click here to download Episode 209: Exotic Life
Or subscribe to: astronomycast.com/podcast.xml with your podcatching software.

Episode 209 Show notes and transcript

Solving the Mystery of Dark Gamma Ray Bursts

Artists impression of a dark gamma-ray burst. Credit: ESO

[/caption]
Unraveling the mystery of Gamma Ray Bursts (GRBs) is a story filled with international intrigue, fantastic claims, serious back-tracking, and incremental improvements in our understanding of the true nature and implications of the most energetic, destructive forces in the Universe. New results from a team of scientists studying so-called “dark gamma-ray bursts” have firmly snapped a new piece into the GRB puzzle. This research is presented in a paper to appear in the journal Astronomy & Astrophysics on December 16, 2010.

The discovery of GRBs was an unexpected result of the American space program and the military keeping tabs on the Russians to verify compliance with a cold war nuclear test ban treaty. In order to be sure the Russians weren’t detonating nuclear weapons on the far side of the Moon, the 1960’s era Vela spacecraft were equipped with gamma ray detectors. The Moon might shield the obvious signature of x-rays from the far side, but gamma rays would penetrate right through the Moon and would be detectible by the Vela satellites.

By 1965, it became apparent that events which triggered the detectors but were clearly not signatures of nuclear detonations, so they were carefully, and secretly, filed away for future study. In 1972, astronomers were able to deduce the directions to the events with sufficient accuracy to rule out the Sun and Earth as sources. They came to the conclusion that these gamma-ray events were “of cosmic origin”. In 1973, this discovery was announced in the Astrophysical Journal.

This created quite stir in the astronomical community and dozens of papers on GRBs and their causes began appearing in the literature. Initially, most hypothesized the origin of these events came from within our own galaxy. Progress was painfully slow until the 1991 launch of the Compton Gamma Ray Observatory. This satellite provided crucial data indicating that the distribution of GRBs is not biased towards any particular direction in space, such as toward the galactic plane or the center of the Milky Way Galaxy. GRBs came from everywhere all around us. They are “cosmic” in origin. This was a big step in the right direction, but created more questions.

For decades, astronomers searched for a counterpart, any astronomical object coincident with a recently observed burst. But the lack of precision in the location of GRBs by the instruments of the day frustrated attempts to pin down the sources of these cosmic explosions. In 1997, BeppoSAX detected a GRB in x-rays shortly after an event and the optical after glow was detected 20 hours later by the William Herschel Telescope. Deep imaging was able to identify a faint, distant galaxy as the host of the GRB. Within a year the argument over the distances to GRBs was over. GRBs occur in extremely distant galaxies. Their association with supernovae and the deaths of very massive stars also gave clues to the nature of the systems that produce GRBs.

It wasn’t too long before the race to identify optical afterglows of GRBs heated up and new satellites helped pinpoint the locations of these after glows and their host galaxies. The Swift satellite, launched in 2004, is equipped with a very sensitive gamma ray detector as well as X-ray and optical telescopes, which can be rapidly slewed to observe afterglow emissions automatically following a burst, as well as send notification to a network of telescopes on the ground for quick follow up observations.

Today, astronomers recognize two classifications of GRBs, long duration events and short duration events. Short gamma-ray bursts are likely due to merging neutron stars and not associated with supernovae. Long-duration gamma-ray bursts (GRBs) are critical in understanding the physics of GRB explosions, the impact of GRBs on their surroundings, as well as the implications of GRBs on early star formation and the history and fate of the Universe.

While X-ray afterglows are usually detected for each GRB, some still refused to give up their optical afterglow. Originally, those GRBs with X-ray but without optical afterglows were coined “dark GRBs”. The definition of “dark gamma-ray burst” has been refined, by adding a time and brightness limit, and by calculating the total output of energy of the GRB.

This lack of an optical signature could have several origins. The afterglow could have an intrinsically low luminosity. In other words, there may just be bright GRBs and faint ones. Or the optical energy could be strongly absorbed by intervening material, either locally around the GRB or along the line-of-sight through the host galaxy. Another possibility is that the light could be at such a high redshift that blanketing and absorption by the intergalactic medium would prohibit detection in the R band frequently used to make these detections.

In the new study, astronomers combined Swift data with new observations made using GROND, a dedicated GRB follow-up instrument attached to the 2.2-metre MPG/ESO telescope at La Silla in Chile. GROND is an exceptional tool for the study of GRB afterglows. It can observe a burst within minutes of an alert coming from Swift, and it has the ability to observe through seven filters simultaneously, covering the visible and near-infrared parts of the spectrum.

By combining GROND data taken through these seven filters with Swift observations, astronomers were able to accurately determine the amount of light emitted by the afterglow at widely differing wavelengths, all the way from high energy X-rays to the near-infrared. They then used this data to directly measure the amount of obscuring dust between the GRB and observers on Earth. Thankfully, the team has found that dark GRBs don’t require exotic explanations.

What they found is that a significant proportion of bursts are dimmed to about 60–80 percent of their original intensity by obscuring dust. This effect is exaggerated for the very distant bursts, letting the observer see only 30–50 percent of the light. By proving this to be so, these astronomers have conclusively solved the puzzle of the missing optical afterglows. Dark gamma-ray bursts are simply those that have had their visible light completely stripped away before it reaches us.

Can Nearby Binary Star Systems Mimic Planets?

The vast majority of the known exoplanets have been discovered by the radial velocity method. This method employs the effects of a planet’s gentle tug on its parent star which is perceived as a “wobble” in the star’s motion. A new study, conducted by Morais and Correia, looks at whether this effect can be mimicked by another, distinctly non-planetary, source: Binary stars.

Conceptually, the idea is rather straightforward. A star of interest lies in a triple star system. It is the third member and in a larger orbit around a tight binary system. As the tight binary system orbits, there will be periods in which they line up with the star of interest giving a minutely greater pull before relaxing the pull later in their orbit. This remote tug would show a distinctly periodic effect very similar to the effects expected from an inferred planet.

The obvious question was how astronomers could miss the presence of binary stars, close enough to have a notable effect. The authors of the paper suggest that if the binary pair orbited sufficiently close, it would be unlikely that they could be resolved as a binary. Additionally, if one member were sufficiently faint (an M dwarf), it may not appear readily either. Both of these instances are plausible given that some three fourths of nearby main sequence stars are M class, and about half of all stars are in binary system.

Next, the team asked how important these effects may be. They considered the case of HD 18875, a binary system in which a distant star (A) has a 25.7 year period around a tight binary (Ba + Bb) that orbit each other with a period of 155 days. This system was noteworthy because a hot Jupiter planet was announced around the A star in 2005, but challenged in 2007 when another team could not repeat the observations.

The new study attempted to use their understanding and modeling of three body systems to see if the binary interaction could have produced the spurious signal. Using their model, they determined that the effects of the system itself would have produced effects similar to those of a planet of 4 Earth masses located at 0.38 AU. A planet of such mass is well below the limit of a hot Jupiter and the distance is somewhat larger than usual as well. Thus, the nearby B-binary could not have been responsible. Furthermore, such minute effects of this type are generally interpreted as “super-Earths” and have only become prevalent in observations in the past few years.

Thus, while the unconfirmed planet around HD 18875 A might not have been caused by the nearby binary, the work in this new paper has shown that effects of nearby binaries will become increasingly important as we start detecting radial velocities indicative of less and less massive planets.