The Sun had a fit and popped off two large events at once early today, Jan. 28, 2011. A filament on the left side became unstable and erupted, while an M-1 flare (mid-sized) and a coronal mass ejection on the right blasted into space. Neither event was headed towards Earth. This SDO movie, which is from Jan. 26-28, 2011, shows several other flashes and bursting from the active region on the right as well.
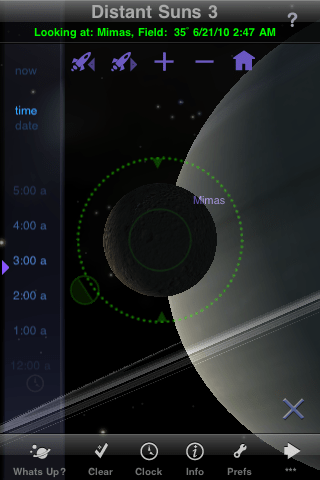
It’s time to unleash your inner astronaut! The Distant Suns app has been around awhile and is one of the more popular astronomy-related applications for iPhone and now the iPad. It was originally a program for the Commodore Amiga computer in 1987, but now takes advantage of the latest hand-held technology. Distant Suns is an app for both serious astronomers and beginners (its very user friendly) and includes a wealth of information about astronomical objects and fun “fly to” features. Creator Mike Smithwick has just put out a new updated version of Distant Suns (version 3.1.4) and has given Universe Today 15 (count ’em! 15!) of this latest version to give away. This app regularly sells for $9.99, so this is a great chance to own one of your very own.
Just send an email with the subject line of “Distant Suns App” in the subject line to [email protected] and we will randomly choose 15 winners. UPDATE: The winners have now all been notified, and this contest is over.
For more information about the features and capabilities of Distant Suns, see the video below, or see the Distant Suns website, or the Distant Suns iTunes store page.
Distant Suns has gotten a 5 Star review from from ituneappreview.com, and 5 stars in phoneapplicationlist.com, and here’s a glowing review from OtherWorldComputing.
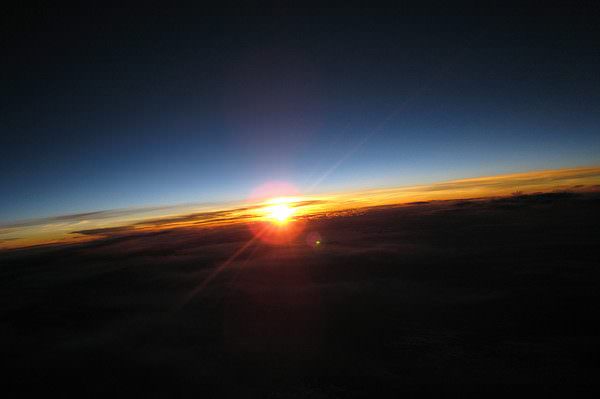
A sunrise from the edge of space. Credit: Project Soar
[/caption]
A college-age team of space and photography enthusiasts have created a fully reusable capsule that can travel autonomously to the edge of space using high altitude balloons. To date, their capsule, named PURSUIT has had four flights, reaching altitudes ranging from 24,000 to 36,500 meters (80,000 to 120,000 feet.) “We wanted to fly capsules to the edge of space and capture the most difficult imagery that other teams didn’t even bother trying,” said Project Soar team leader David Gonzales II. “Our capsules shoot high resolution stills and shoot HD video of their incredible journeys.”
Last fall, the team captured the stunning image above of a sunrise from space from about 25,000 meters above the Earth. “To our knowledge, Sunrise Soar II captured the highest resolution images of sunrise ever taken from the edge of space by a high altitude balloon flight,” Gonzales told Universe Today.
A sunrise above most of Earth's atmosphere. Credit: Project Soar
In images taken from over 36,000 meters, absent are the reddish sunrise colors that we see on Earth because of the atmosphere.
Their PURSUIT capsule cost about $500 to put together initially, but their total cost per flight is only $40.
The crew consists of twelve different students and recent graduates from various colleges. Gonzales said he formed Project Soar and put together the team as a hobby. The team hopes to do several more flights soon.
The Sunrise Soar team filling the balloon. Credit: Proejct Soar
See more images and videos, and read detailed reports about the team’s adventures at their Project Soar website.
Success! The Sunrise Soar retrieves their capsule. Credit: Project Soar
According to a new proposal, GPS satellites may be the key to finding dark matter. Credit: NASA
[/caption]
An artificial satellite is a marvel of technology and engineering. The only thing comparable to the feat in technological terms is the scientific know-how that goes into placing, and keeping, one in orbit around the Earth. Just consider what scientists need to understand in order to make this happen: first, there’s gravity, then a comprehensive knowledge of physics, and of course the nature of orbits themselves. So really, the question of How Satellites Stay in Orbit, is a multidisciplinary one that involves a great of technical and academic knowledge.
First, to understand how a satellite orbits the Earth, it is important to understand what orbit entails. Johann Kepler was the first to accurately describe the mathematical shape of the orbits of planets. Whereas the orbits of planets about the Sun and the Moon about the Earth were thought to be perfectly circular, Kepler stumbled onto the concept of elliptical orbits. In order for an object to stay in orbit around the Earth, it must have enough speed to retrace its path. This is as true of a natural satellite as it is of an artificial one. From Kepler’s discovery, scientists were also able to infer that the closer a satellite is to an object, the stronger the force of attraction, hence it must travel faster in order to maintain orbit.
Next comes an understanding of gravity itself. All objects possess a gravitational field, but it is only in the case of particularly large objects (i.e. planets) that this force is felt. In Earth’s case, the gravitational pull is calculated to 9.8 m/s2. However, that is a specific case at the surface of the planet. When calculating objects in orbit about the Earth, the formula v=(GM/R)1/2 applies, where v is velocity of the satellite, G is the gravitational constant, M is the mass of the planet, and R is the distance from the center of the Earth. Relying on this formula, we are able to see that the velocity required for orbit is equal to the square root of the distance from the object to the center of the Earth times the acceleration due to gravity at that distance. So if we wanted to put a satellite in a circular orbit at 500 km above the surface (what scientists would call a Low Earth Orbit LEO), it would need a speed of ((6.67 x 10-11 * 6.0 x 1024)/(6900000))1/2 or 7615.77 m/s. The greater the altitude, the less velocity is needed to maintain the orbit.
So really, a satellites ability to maintain its orbit comes down to a balance between two factors: its velocity (or the speed at which it would travel in a straight line), and the gravitational pull between the satellite and the planet it orbits. The higher the orbit, the less velocity is required. The nearer the orbit, the faster it must move to ensure that it does not fall back to Earth.
We have written many articles about satellites for Universe Today. Here’s an article about artificial satellites, and here’s an article about geosynchronous orbit.
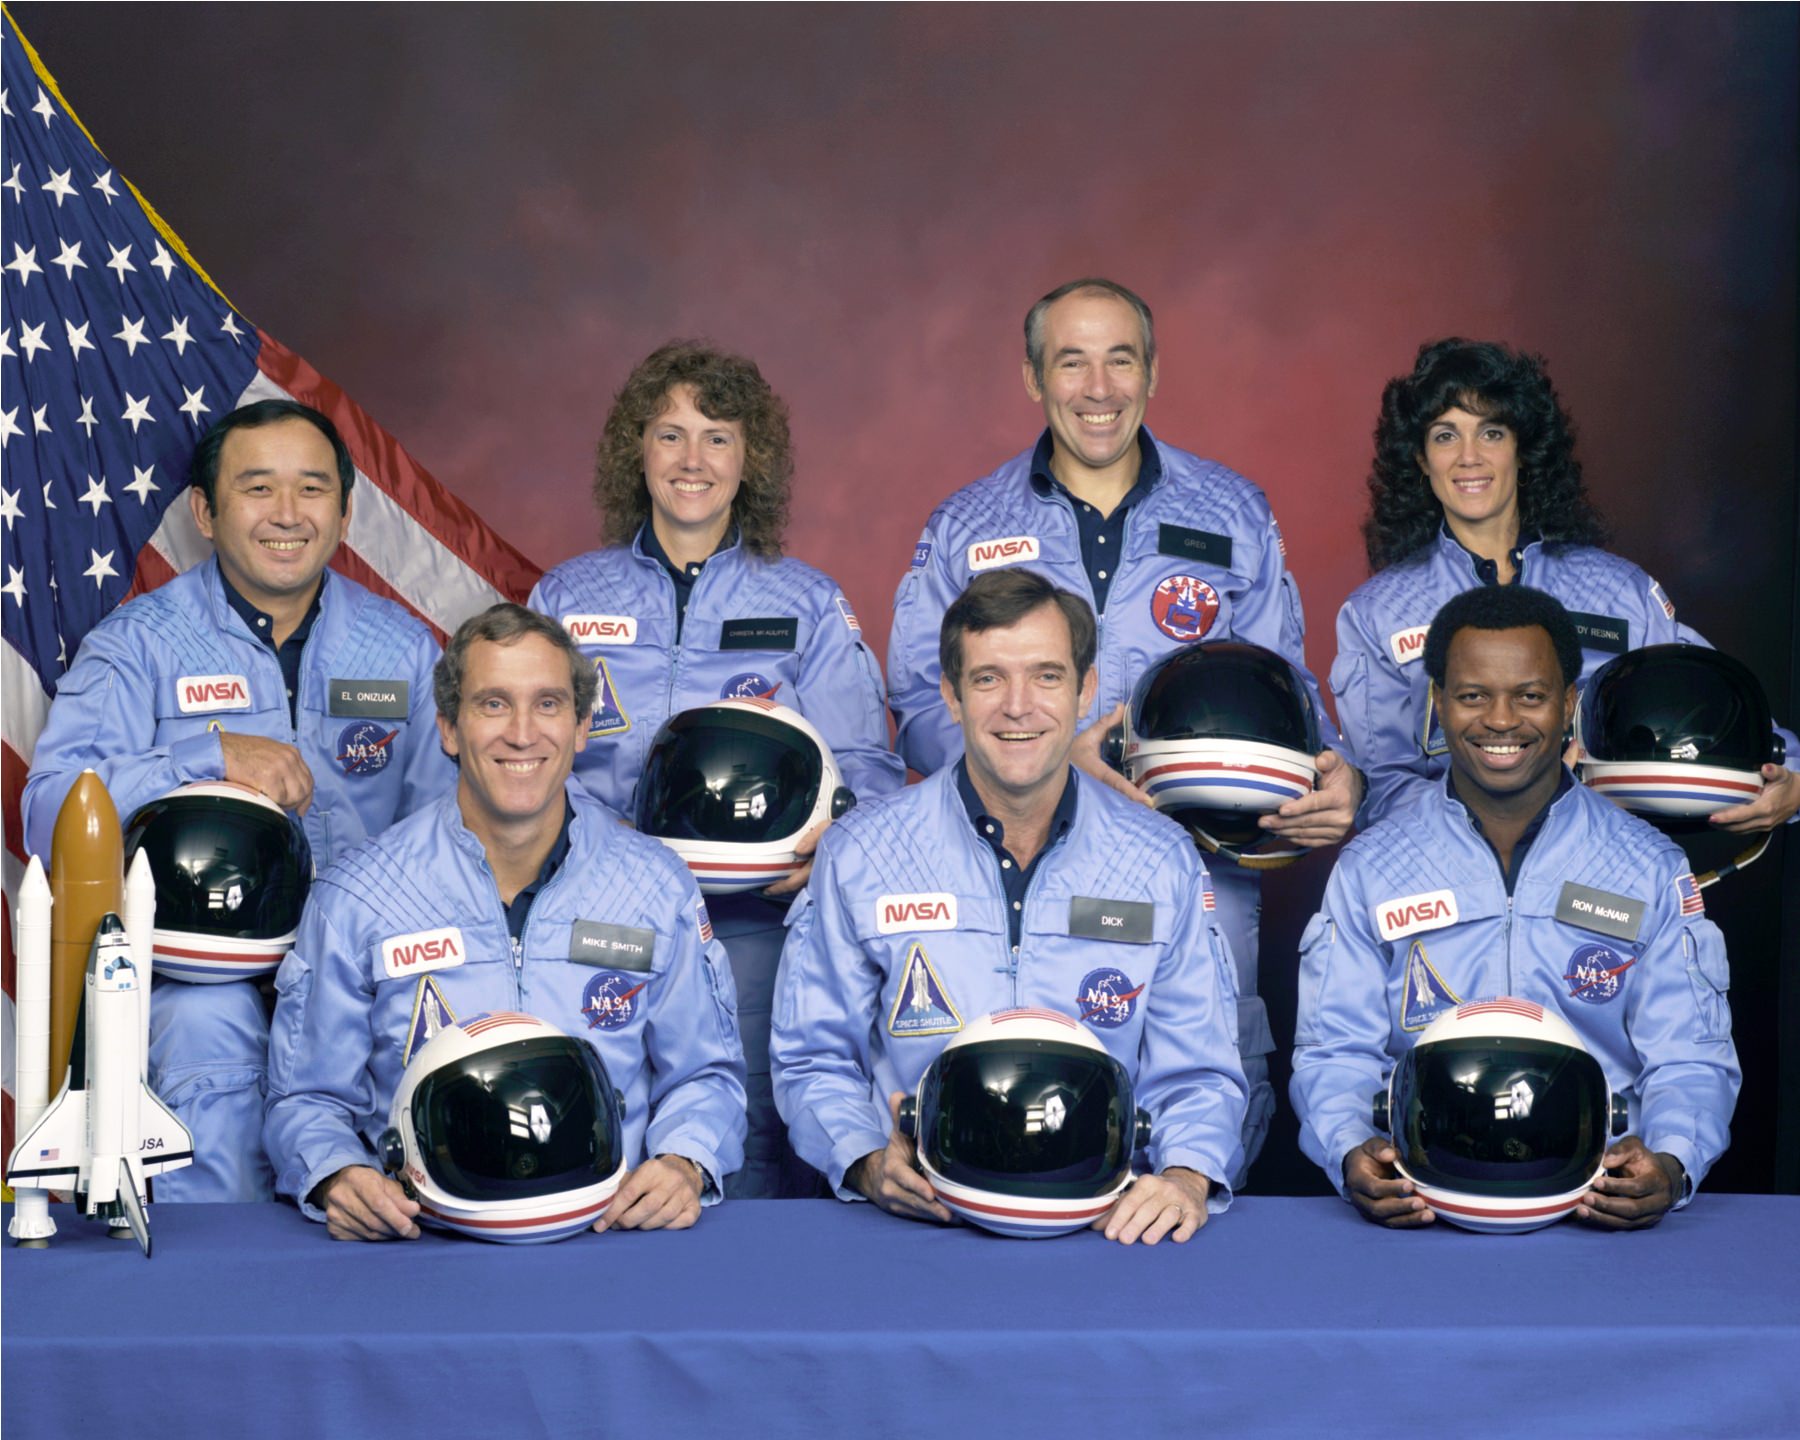
In remembrance of the Challenger accident 25 years ago today, several notable people have issued statements in memory of the Challenger crew, as well as the crews of Apollo 1 and Columbia. Below are a few; add your own, if you like, in the comments section.
Additionally, a high-quality documentary about the accident has been produced by SnagFilms, an online library of more than 2000 documentary films available to view for free. The film, which you can access below, is called “Catastrophic Failure.”
Statement by Steven J. McAuliffe on the 25th Anniversary of the Challenger Accident
“That people across the country steadfastly remember the crew members of Challenger is both comforting and inspirational to our family. Scott, Caroline and I very much appreciate the kind thoughts and continuous support we have received over the years.
Christa confidently and joyfully embraced life, no less than her friends and colleagues on Challenger, and no less than the crews of Columbia , Apollo 1, and all of those people who courageously follow their own paths every day. I know Christa would say that that is the most precious lesson – ordinary people can make extraordinary contributions when they remain true to themselves and enthusiastically pursue their own dreams wherever they may lead. Our family knows that generations of students and teachers will continue to share her love of learning and love of life, and will do great things for our world. We believe Christa would be especially pleased by, and proud of the Challenger Center for Space Science Education and its mission. The Challenger Center honors each crew member’s devotion to learning and exploration, touching the lives of over 400,000 students and 40,000 teachers each year. In that way, Challenger Center continues the teaching mission of all the crew members of STS-51-L.”
(About Steven J. McAuliffe: Originally from Massachusetts , Steven McAuliffe now lives in Concord , New Hampshire , where he serves as a Federal judge. He is the widower of Christa McAuliffe, NASA’s Teacher in Space candidate. Steve continues to serve as a Founding Director for Challenger Center for Space Science Education. He has two children, Scott and Caroline, and has remarried.)
The patches of the crews of Apollo 1, space shuttles Challenger and Columbia, in remembrance of those who have given their lives in the cause of exploration
US President Barack Obama on NASA’s Day of Remembrance (January 27, 2011)
“Fifty years ago, a young President facing mounting pressure at home propelled a fledgling space agency on a bold, new course that would push the frontiers of exploration to new heights. Today, on this Day of Remembrance when NASA reflects on the mighty sacrifices made to push those frontiers, America’s space agency is working to achieve even greater goals. NASA’s new 21st Century course will foster new industries that create jobs, pioneer technology innovation, and inspire a new generation of explorers through education – all while continuing its fundamental missions of exploring our home planet and the cosmos.
Throughout history, however, we have seen that achieving great things sometimes comes at great cost and we mourn the brave astronauts who made the ultimate sacrifice in support of NASA missions throughout the agency’s storied history. We pause to reflect on the tragic loss of the Apollo 1 crew, those who boarded the space shuttle Challenger in search of a brighter future, and the brave souls who perished on the space shuttle Columbia.
Though triumph and tragedy, each of us has benefited from their courage and devotion, and we honor their memory by dedicating ourselves to a better tomorrow. Despite the challenges before us today, let us commit ourselves and continue their valiant journey toward a more vibrant and secure future.”
NASA Administrator Charles Bolden participates in a wreath-laying ceremony as part of NASA's Day of Remembrance, Thursday, Jan. 27, 2011, at Arlington National Cemetery.NASA Administrator Charles Bolden lays a wreath at Arlington National Cemetery, as part of NASA's Day of Remembrance on Jan. 27, 2011. Credit: NASA/Bill Ingalls
Message from NASA Administrator Charlie Bolden: Day of Remembrance
“The last week of January every year brings us the opportunity to reflect on the sobering realities of our space exploration enterprise. Each time men and women board a spacecraft, their actions carry great risk along with the opportunity for great discoveries and the chance to push the envelope of our human achievement. Today, we honor the Apollo 1, Challenger and Columbia crews, as well as other members of the NASA family who lost their lives supporting NASA’s mission of exploration. We thank them and their families for their extraordinary sacrifices in the service of our nation.
This year marks the 25th anniversary of the loss of Challenger — a tragedy that caused us to completely re-think our systems and processes as we worked to make the shuttle safer. The nation will never forget Jan. 28, 1986, nor its indelible images. The astronauts in that crew were personal friends of mine, as were the astronauts aboard Columbia when it was lost. The Apollo I crew perished while I was studying at the Naval Academy, and I mourned their loss in the line of duty with the nation. These brave men and women will always be a part of us, and we are still building on their legacies.
NASA has learned hard lessons from each of our tragedies, and they are lessons that we will continue to keep at the forefront of our work as we continuously strive for a culture of safety that will help us avoid our past mistakes and heed warnings while corrective measures are possible. In memory of our colleagues, I ask the NASA Family once again to always make its opinions known and to be unafraid to speak up to those in authority, so that safety can always be our guiding principle and the sacrifices of our friends and colleagues will not be in vain.
On this Day of Remembrance, as we honor our fallen heroes with tributes and public ceremonies, I will take part in a wreath-laying ceremony at Arlington National Cemetery. Across the country, flags at NASA Headquarters and the NASA centers will be flown at half-mast in memory of our colleagues lost in the cause of exploration.
The legacy of those who have perished is present every day in our work and inspires generations of new space explorers. Every day, with each new challenge we overcome and every discovery we make, we honor these remarkable men and women. Please join me in working to fulfill their dreams for the future.”
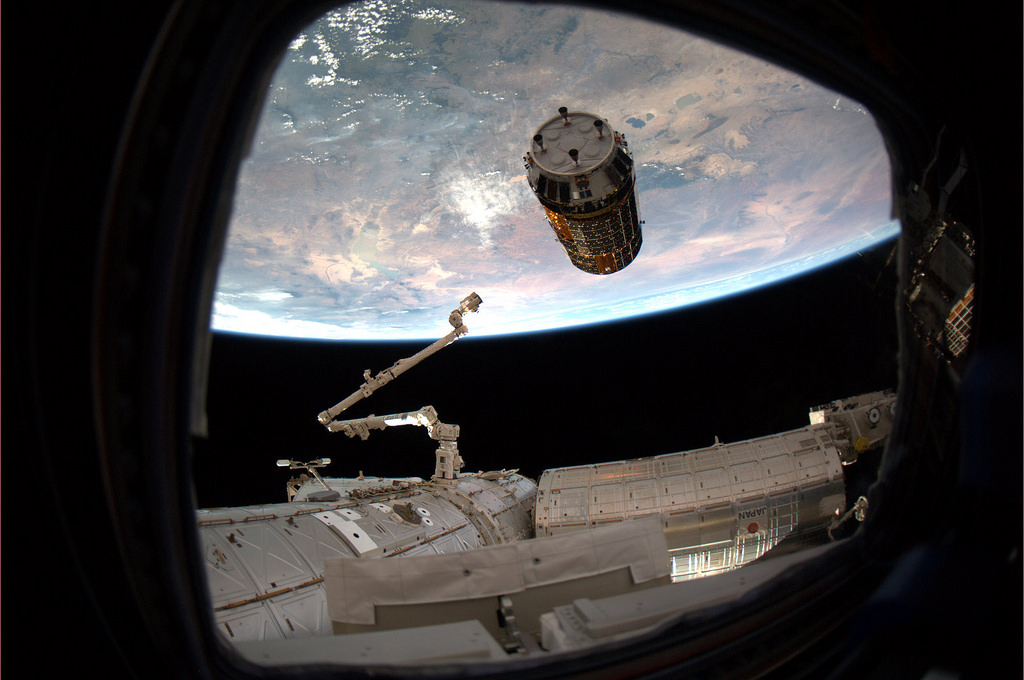
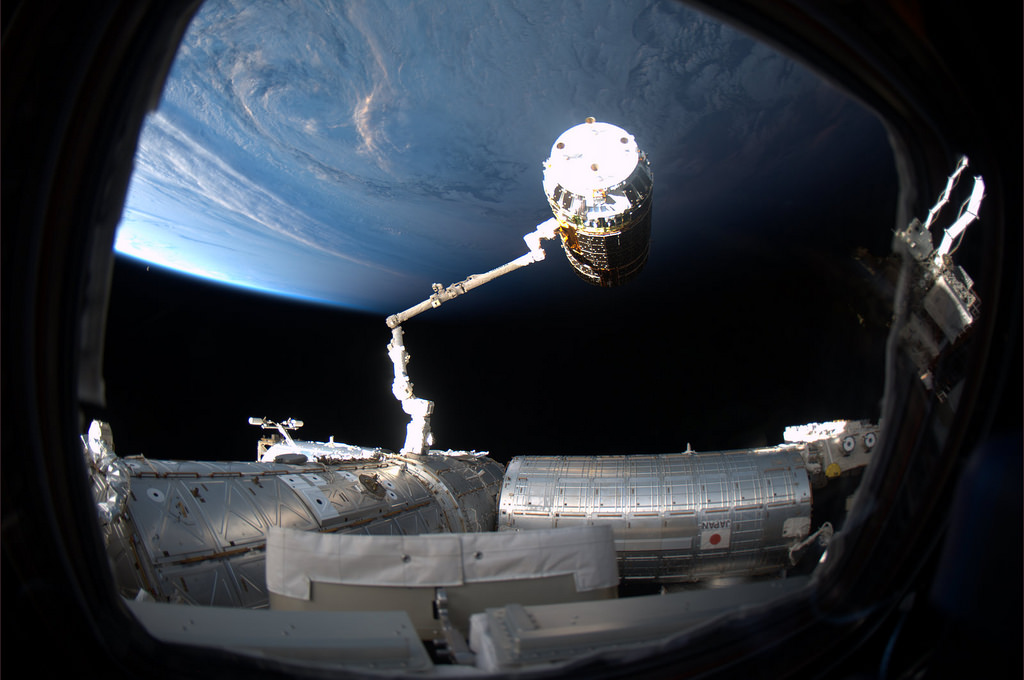
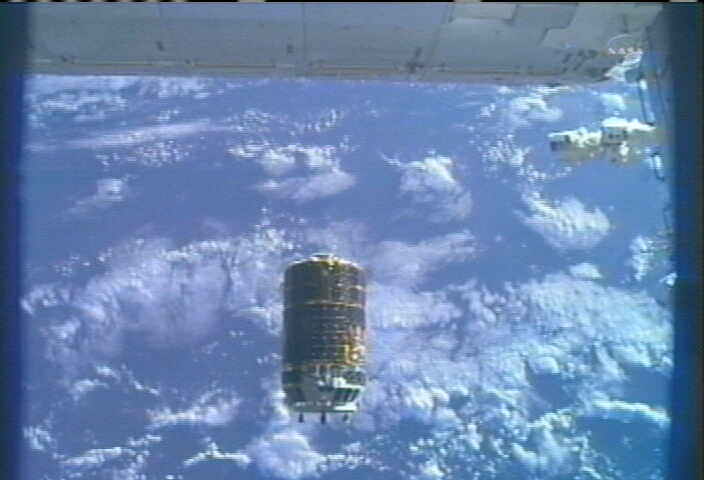
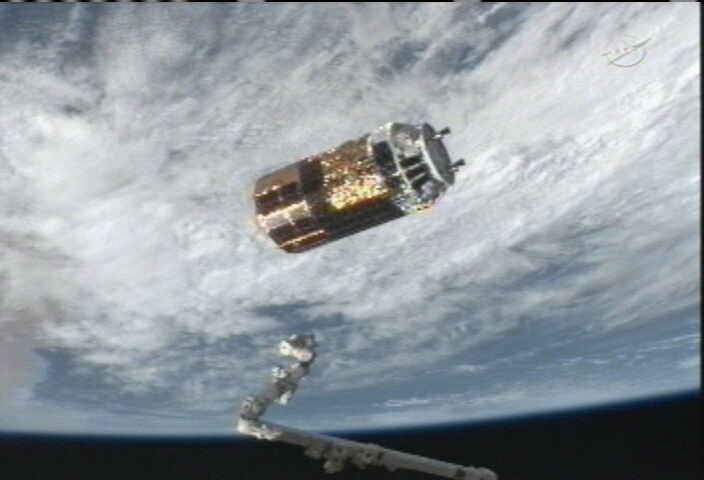
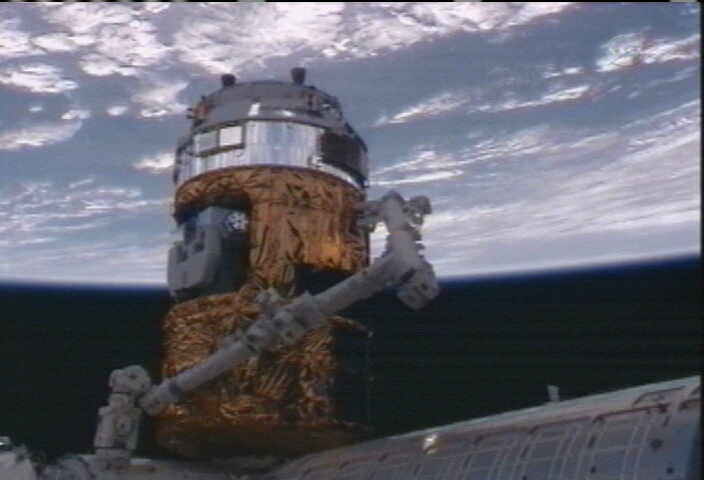
Japans Kounotori2 –or ‘White Stork’ – cargo carrier rendezvous with the International Space Station on Jan. 27, 2010. It was grappled by the ISS crew and firmly bolted to the station today. Credit: NASA/Paolo Nespoli
[/caption]
Japans critical new resupply spaceship – nicknamed Kounotori2, (HTV2) – was successfully berthed today (Jan. 27) at the International Space Station (ISS). Kounotori2 – which translates as ‘White Stork’ in Japanese – was grappled by the ISS crew and then manually nested to an Earth facing docking port on the Harmony module.
Kounotori2 was launched aboard a Japanese H-IIB rocket from the Tanegashima Space Center in southern Japan at 12:37 a.m. (2:27 p.m. Japan time) on Jan. 22 to begin a five day orbital chase of the station.
View the Video and a Photo album below of the rendezvous and docking sequence
The two ships became one as Astronaut Cady Coleman grappled the free flying ‘White Stork’ at 6:41 a.m. EST with the stations robotic arm while the vessels were flying in formation about 220 miles above the south Indian Ocean in an easterly direction.
“Grapple completed, Kounotori is grappled!”
Kounotori2 was grappled by ISS crewmate Cady Coleman at 6:41 a.m. EST with the stations robotic arm while flying about 220 miles above the south Indian Ocean. ISS Tweet and Twitpic Credit: NASA/Paolo Nespoli
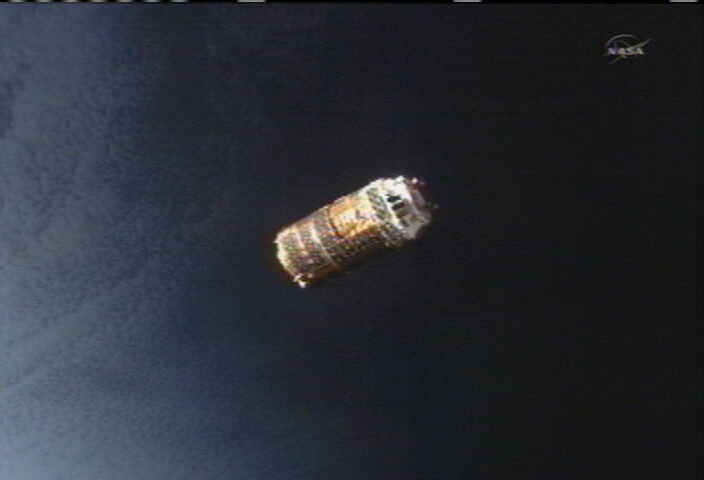
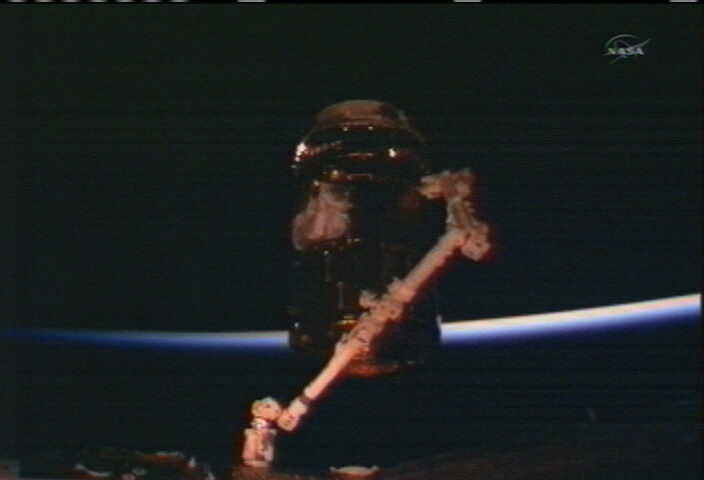
After an automatic rendezvous early this morning, the unmanned HTV2 cargo carrier slowly approached the space station from below to a series of ever closer hold points- 250 m, 30 m and 10 m.
Mission controllers on Earth carefully maneuvered the 35,000 pound ship to the final capture distance of about 33 feet (10 meters). The HTV thrusters were disabled and it was placed into ‘free drift’ mode.
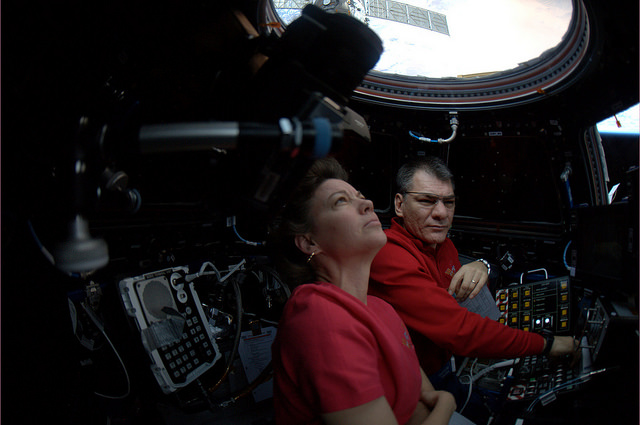
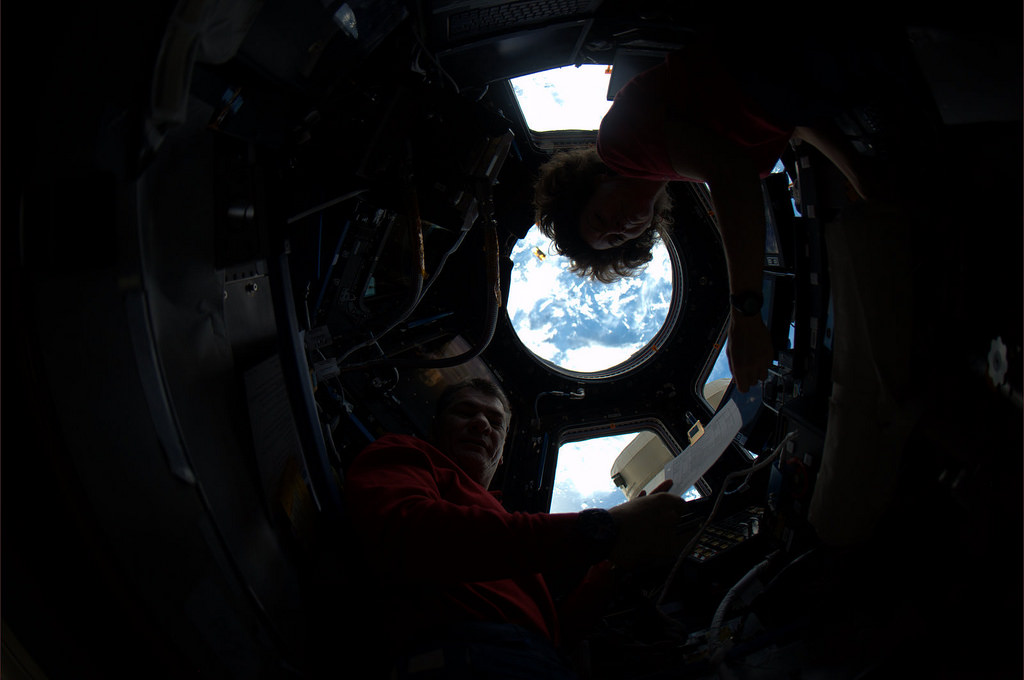
ISS astronauts Paolo Nespoli, Cady Coleman and Commander Mark Kelly crew monitored the approach from inside the ISS. The crew was deftly working at the controls of the robotics work station of the Cupola Observation dome.
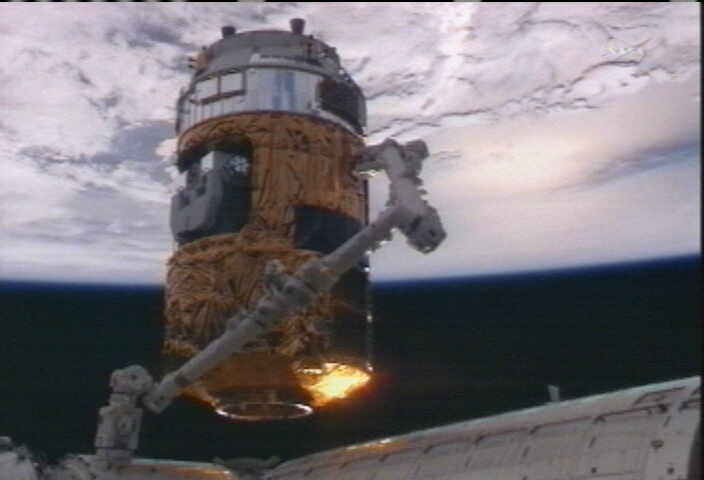
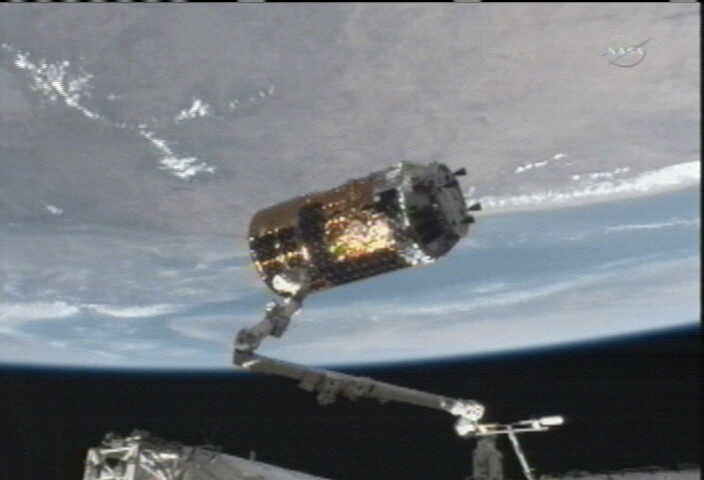
The unpiloted Japanese Kounotori2 H-II Transfer Vehicle (HTV2) is about to be attached to the Earth-facing port of the Harmony module by the station’s robotic arm. Credit: NASA TV
Finally, Coleman gently grabbed the ‘White Stork’ with the 58 foot long Space Station Robotic arm, built and contributed by Canada.
“Grapple completed, Kounotori is grappled!” tweeted and twitpiced Paolo Nespoli from the ISS.
“This demonstrates what we can do when humans and robots work together,” radioed Cady Coleman.”We look forward to bringing HTV 2 – Kounotori – aboard the International Space Station.”
Video caption: Japanese Cargo Craft Arrives at ISS.
From: NASAtelevision | January 27, 2011 An unpiloted Japanese resupply ship, the “Kounotori”2 H-2B Transfer Vehicle (HTV2 ), was captured and berthed to the Earth-facing port of the Harmony module of the International Space Station Jan. 27, 2011. The berthing took place after an automated five-day flight following its launch on the Japan Aerospace Exploration Agency’s H-2B rocket Jan. 22 from the Tanegashima Space Center in southern Japan. The ‘Kounotori’, which means “white stork” in Japanese, is loaded with more than four tons of supplies and spare parts for the six crew members on the orbital laboratory. Expedition 26 Flight Engineers Cady Coleman and Paolo Nespoli were at the controls of the robotic work station in the space station’s Cupola module to maneuver the Canadarm2 robotic arm for the grapple and berthing of the HTV2, which will remain at the orbital outpost until the end of March
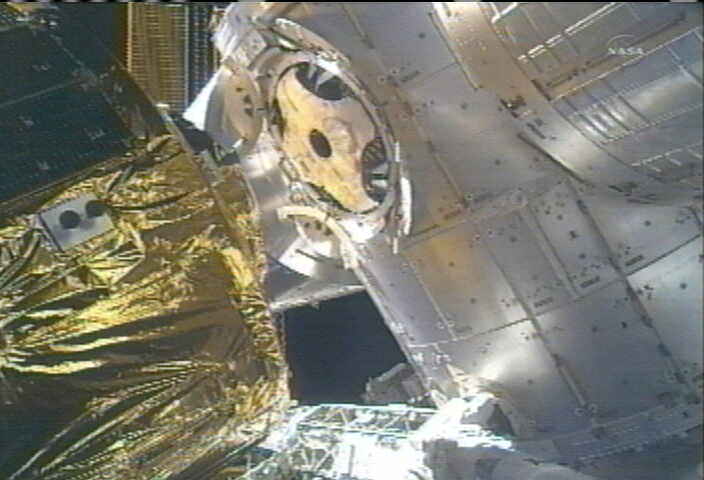
Italian astronaut Paolo Nespoli had the honor of driving Kounotori2 to a hard dock at the station. The attachment was completed at 9:51 a.m. EST after Kelly inspected the docking mechanism and confirmed it was clear of debris and ready. 16 bolts firmly latched the cargo freighter into place a few hours later.
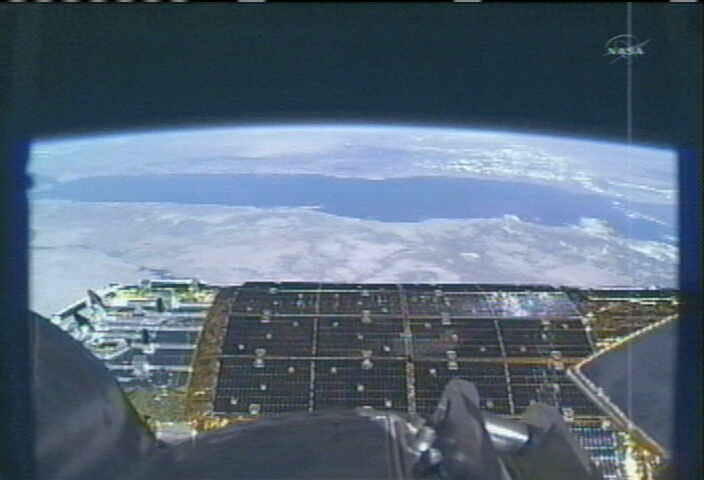
The crew will open the hatch to Kounotori2 on Friday, (Jan. 28) at about 7:30 a.m. This is only the second flight of the Kounotori. The barrel shaped vehicle is coated with 57 solar panels.
HTV-2, we are ready for you! HTV-2, siamo pronti per te! ISS Tweet and Twitpic Credit: NASA/Paolo Nespoli
Kounotori2 is loaded with over 4 tons of pressurized and unpressurized cargo, including science experiments, research gear, space parts, clothing, food and water and other provisions from Japan, NASA and Canada.
HTV2 will remain docked at the ISS for about two months until late March. During that time the ISS crew will retrieve all the equipment and supplies for transfer to locations both inside and outside the ISS.
Using the Canadian robotic arm and Dextre robot, a pallet loaded with large spare parts for the station will be extracted from a slot on the side of the cargo ship robot and attached to an experiment platform outside the Japanese Kibo module.
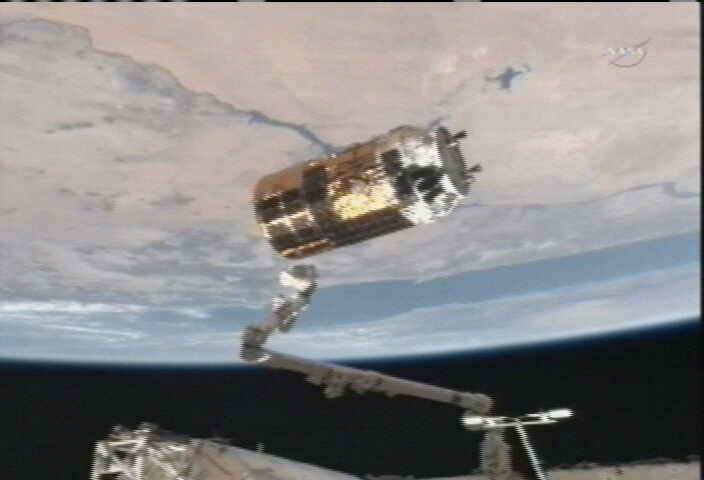
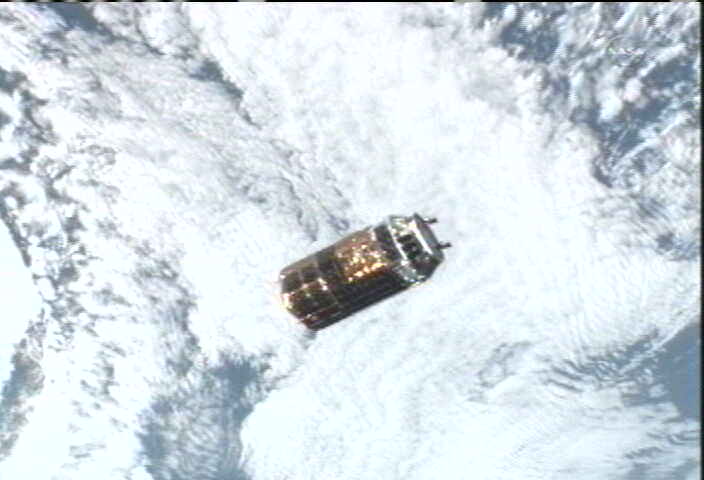
The White Stork “ Kounotori’ flying high above the Nile river, Egypt as it is about to be grappled by the ISS crew with the station’s robotic arm on Jan. 27, 2011. Credit: NASA TV
On Feb. 18, the ISS crew will move the HTV from the Earth facing port. They will relocate it 180 degrees to the other side of the Harmony module to the space facing zenith port. This maneuver is required to provide enough clearance for Space Shuttle Discovery so that the orbiter can also safely dock at the Harmony module in late February. Discovery is set to launch on Feb. 24.
The HTV2 docking marks the start of an extremely busy time of orbital comings and goings at the ISS.
A Russian Progress resupply ship launches later today, at 8:31 p.m. EST. Following a two day chase, the Progress will dock on Saturday night (Jan. 29) at 9:39 p.m. and deliver over 6000 pounds of cargo to the station. Watch NASA TV
The European ATV cargo ship – named ‘Johannes Kepler – blasts off on Feb. 15.
HTV2 Rendezvous & Docking Photo Album: Jan 27, 2011
All photos Credit NASA and NASA TV
ISS astronauts Cady Coleman and Paolo Nespoli work inside the Cupola robotics work station. They grappled the free flying White Stork 'Kounotori' for attachment to the ISS today, Jan. 27, 2011. ISS Twitpic Credit: NASA/ESA
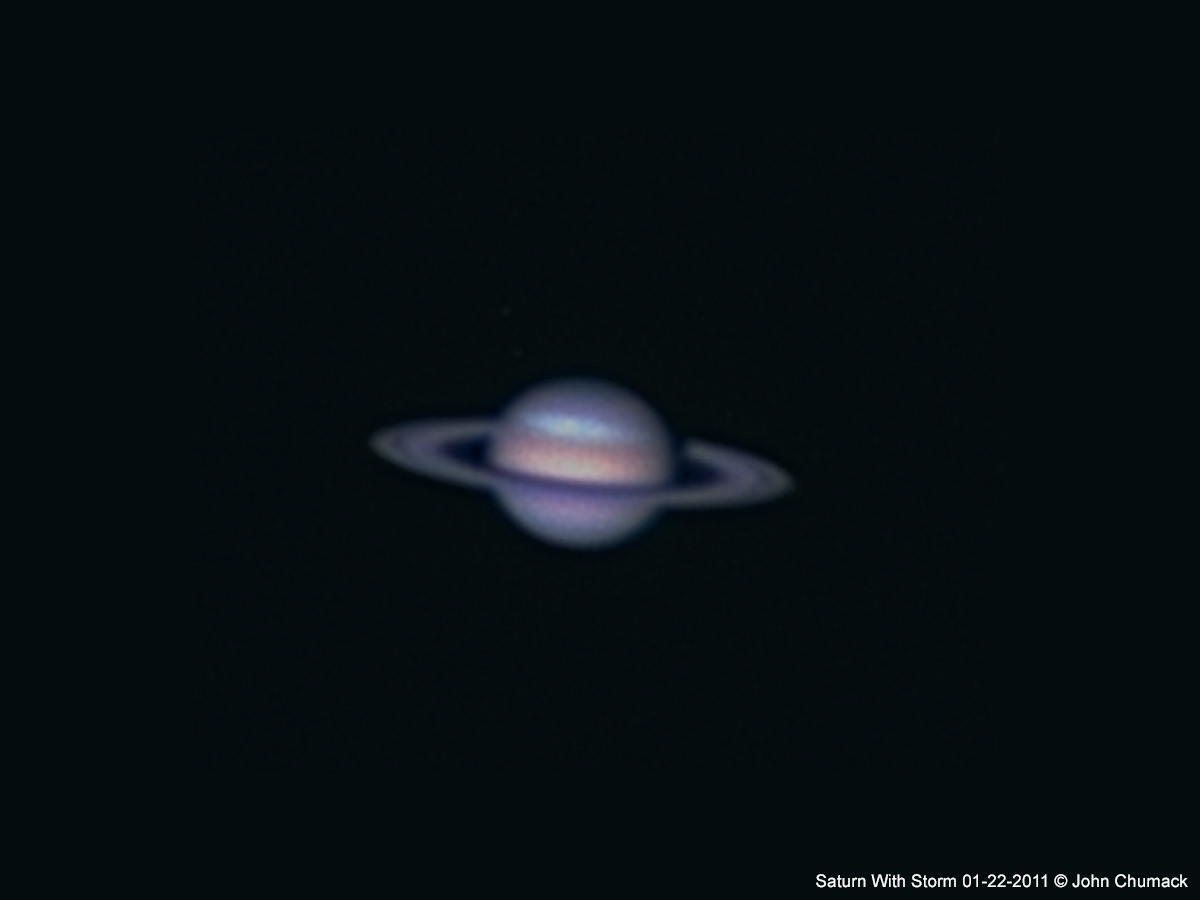
Just before the holidays, UT reported about about the Growing Storm On Saturn and showed us the Cassini images. Now more than a month has passed and the white scar of the raging atmosphere has escalated to an incredible size… Nearly 10 Earths wide!
Despite sub-zero temperatures and significant snow cover, at least one dedicated observer has been getting up early to observe what we rarely see – a change in Saturn’s pale golden face. “I was out from 4:30am to 6:00am early Saturday morning. I brushed all the snow off my Dome, and spent an hour or so shooting Saturn with its Big White Storm brewing in the cloud tops.” say John Chumack of Dayton, Ohio. “The seeing conditions were not the best, but I went for it anyway, after the high cirrus clouds moved out of the way, I had to try! -3F Temps in my backyard in Dayton, OH nearly killed my attempt.”
And temperatures like that are warm compared to Saturn’s surface. Depending on the depth of the atmosphere, it could be anywhere from -218.47F to -308.47. Unlike an Alberta Clipper here on Earth, Saturn is constantly having hurricane-like storms. However, few are easily visible in the average telescope. “The storm is enormous.” said John. “It’s no wonder we can see it from Earth, since Saturn at the time of this shot was about 865.2 million miles away or 1.392 billion km from us!”
But there’s more than just a storm hiding in John’s image. Thanks to a little ‘negative thinking’ he was also able to capture five tiny moons circling around Saturn’s icy ring system – Rhea, Dione, Enceladus, Mimas, and Tethys.
“My feet and fingers were numb by the time I was done, even with gloves on, nothing like having to touch frozen metal to point the telescope and run the focusers. Even the hand control paddles were having a tough time with the extreme temps, the LCD went blank and stopped working.” said John. “Heck, I nearly got freezer burned myself!!!”
Yeah, but what a view!
Many thanks to John Chumack of Galactic Images for braving the weather and sharing his work!
Annimation of Apophis. Image Credit: Osservatorio Astronomico Sormano
It must have been a slow news day in Russia yesterday (actually – and unfortunately — it wasn’t)… as headlines from one of Russia’s leading news agencies, Ria Novosti, proclaimed, “Russian Astronomers Predict Apophis-Earth Collision in 2036.” But reading the article a little further, the astronomer, Leonid Sokolov of St. Petersburg State University says the chance of a collision in 2036 is extremely slim, which is exactly what NASA’s Near-Earth Object Program has been saying for several years. So, just to be clear, there is no new information or changes in understanding Apophis’ orbit. Here are the facts:
The folks from the HiRISE Camera on the Mars Reconnaissance Orbiter have put together a video with some groovin’ music of the latest images from the Red Planet, courtesy of HiRISE, the bestest camera in all of Marsdom. There’s an elliptical impact crater, giant gullies, sinuous ridges and a Swiss Cheese smiley face. No foolin’!
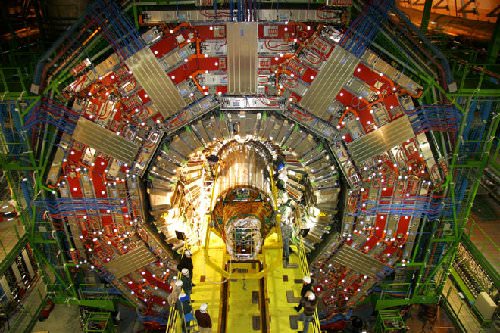
Physicists say they are closer than ever to finding the source of the Universe’s mysterious dark matter, following a better than expected year of research at the Compact Muon Solenoid (CMS) particle detector, part of the Large Hadron Collider (LHC) at CERN in Geneva.
The scientists have now carried out the first full run of experiments that smash protons together at almost the speed of light. When these sub-atomic particles collide at the heart of the CMS detector, the resultant energies and densities are similar to those that were present in the first instants of the Universe, immediately after the Big Bang some 13.7 billion years ago. The unique conditions created by these collisions can lead to the production of new particles that would have existed in those early instants and have since disappeared.
The researchers say they are well on their way to being able to either confirm or rule out one of the primary theories that could solve many of the outstanding questions of particle physics, known as Supersymmetry (SUSY). Many hope it could be a valid extension for the Standard Model of particle physics, which describes the interactions of known subatomic particles with astonishing precision but fails to incorporate general relativity, dark matter and dark energy.
In particle physics, supersymmetry is a symmetry that relates elementary particles of one spin to other particles that differ by half a unit of spin and are known assuperpartners. In a theory with unbroken supersymmetry, for every type of boson there exists a corresponding type of fermion with the same mass and internal quantum numbers, and vice-versa.
Dark matter is an invisible substance that we cannot detect directly but whose presence is inferred from the rotation of galaxies. Physicists believe that it makes up about a quarter of the mass of the Universe whilst the ordinary and visible matter only makes up about 5% of the mass of the Universe. Its composition is a mystery, leading to intriguing possibilities of hitherto undiscovered physics.
Professor Geoff Hall from the Department of Physics at Imperial College London, who works on the CMS experiment, said, “We have made an important step forward in the hunt for dark matter, although no discovery has yet been made. These results have come faster than we expected because the LHC and CMS ran better last year than we dared hope and we are now very optimistic about the prospects of pinning down Supersymmetry in the next few years.”
The energy released in proton-proton collisions in CMS manifests itself as particles that fly away in all directions. Most collisions produce known particles but, on rare occasions, new ones may be produced, including those predicted by SUSY – known as supersymmetric particles, or ‘sparticles’. The lightest sparticle is a natural candidate for dark matter as it is stable and CMS would only ‘see’ these objects through an absence of their signal in the detector, leading to an imbalance of energy and momentum.
In order to search for sparticles, CMS looks for collisions that produce two or more high-energy ‘jets’ (bunches of particles traveling in approximately the same direction) and significant missing energy.
Dr. Oliver Buchmueller, also from the Department of Physics at Imperial College London, but who is based at CERN, said, “We need a good understanding of the ordinary collisions so that we can recognise the unusual ones when they happen. Such collisions are rare but can be produced by known physics. We examined some 3 trillion proton-proton collisions and found 13 ‘SUSY-like’ ones, around the number that we expected. Although no evidence for sparticles was found, this measurement narrows down the area for the search for dark matter significantly.”
The physicists are now looking forward to the 2011 run of the LHC and CMS, which is expected to bring in data that could confirm Supersymmetry as an explanation for dark matter.
The CMS experiment is one of two general purpose experiments designed to collect data from the LHC, along with ATLAS (A Toroidal LHC ApparatuS). Imperial’s High Energy Physics Group has played a major role in the design and construction of CMS and now many of the members are working on the mission to find new particles, including the elusive Higgs boson particle (if it exists), and solve some of the mysteries of nature, such as where mass comes from, why there is no anti-matter in our Universe and whether there are more than three spatial dimensions.