Image of Phobos with a resolution of 8.2 m/pixel in orbit 8974. The ellipses marked the previously planned (red) and currently considered (blue) landing sites for the Russian Phobos-Grunt mission. Credits: ESA/DLR/FU Berlin (G. Neukum)
[/caption]
The Mars Express team released the images today from the close flyby the spacecraft made of Phobos on January 9. The images weren’t downloaded from Mars Express until Jan. 18, and then they were processed, so these are hot off the press. The team didn’t provide much explanation, but enjoy the images. There’s one 3-D view in the group, so grab your 3-D glasses.
Another view of Phobos from Mars Express. Credits: ESA/DLR/FU Berlin (G. Neukum)A sequence of images from 5 different channels on the high resolution camera on Mars Express. Credits: ESA/DLR/FU Berlin (G. Neukum3-D view of Phobos from Jan. 9, 2011. Credits: ESA/DLR/FU Berlin (G. Neukum)
Here’s the on 3-D view, and the team explained that due to the stereo viewing geometry during the flyby a small part of the moon’s edge is only visible for the right eye resulting in odd 3D-perception in this area. This part has been slightly adjusted for better viewing. Also, for the left eye at the left edge of the image four small data gaps have been interpolated.
Image of Phobos with a resolution of 8.2 m/pixel in orbit 8974. The ellipses marked the previously planned (red) and currently considered (blue) landing sites for the Russian Phobos-Grunt mission. Credits: ESA/DLR/FU Berlin (G. Neukum)
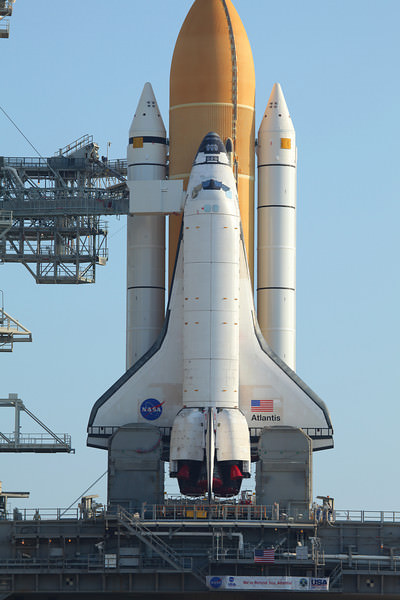
Atlantis at the pad for the STS-132 mission. Will she fly again? Credit: Alan Walters (awaltersphoto.com) for Universe Today
[/caption]
On Thursday, the Space Shuttle Program set a target launch date of June 28, 2011 for the STS-135 mission, the “extra” shuttle flight that was approved in the 2010 NASA Authorization Act. The STS-135 mission – if not required as a “Launch on Need” rescue flight for STS-133 or STS-134 — would have the shuttle Atlantis and a 4-member crew carry a fully-loaded Raffaello multipurpose logistics module to deliver supplies, logistics and spare parts to the International Space Station. Whether the mission actually flies, however, depends on if Congress decides to approve NASA’s proposed budget for 2011. There has been rumors that NASA’s budget could be on the chopping block. But NASA needs to begin preparing in case the flight is approved.
According to Jeff Foust’s Space Politics, the House is expected to vote next week on a resolution to cut discretionary spending back to 2008 levels, a move that, if backed up by later appropriations legislation, would cut NASA spending from the $18.7 billion in FY2010 (and $19 billion in the FY11 proposal) to $17.4 billion. There is sure to be a battle, however, from congressional districts in Texas and Florida who worked hard to get the 2010 Authorization Act passed.
After the Act was signed last fall, in late December the agency’s Space Operations Mission Directorate requested the shuttle and International Space Station programs take the necessary steps to maintain the capability to fly Atlantis on the STS-135 mission.
The Authorization Act of 2010 directs NASA to conduct the mission, and scheduling the flight enables the program to begin preparations for the mission. This would be the 135th and final space shuttle flight.
If approved, the mission also will fly a system to investigate the potential for robotically refueling existing spacecraft and return a failed ammonia pump module to help NASA better understand the failure mechanism and improve pump designs for future systems.
The crew consists of commander Chris Ferguson, Douglas Hurley, Sandra Magnus and Rex Walheim. The smaller crew size bypasses the need for a rescue shuttle, as if for some reason Atlantis is unable to return from space, the crew members would be rescued from the station using Russian Soyuz spacecraft.
As far as the next scheduled shuttle flight, STS-133, engineers continue to work on Discovery in the Vehicle Assembly Building Kennedy Space Center to modify the stringers on the external fuel tank. Discovery and its six astronauts are targeted to launch on Feb. 24.
With a bicycle injury to crewmember Tim Kopra, the crew is now joined by Steve Bowen, who flew on the on STS-132 in May 2010, as a replacement. He will be the first astronaut to fly on consecutive missions.
At a press conference on Wednesday, Bill Gerstenmaier, NASA’s Associate Administrator for Space Operations said the astronaut office worked together to figure out who should replace Kopra and figure out the logistics so that the flight would not be delayed even further. “We’ve been working hard on this since Tim had his accident and we think we’ve got a good plan in place,” he said.
“Its was obviously a disappointment for Tim to not be available for this upcoming launch window,” said chief astronaut Peggy Whitson. “He understands that we have to be prepared to fly.”
Whitson said Bowen is a very experienced spacewalker, with five previous spacewalks and very capable in terms of qualifications in the EMU (NASA’s spacesuit). “We felt with a very few additional training runs, he could pick up the timeline, and be able to pull them off with only an additional two runs in the NBL (Neutral Buoyancy Laboratory for each of those two activities.”
The crew also will review robotics procedures today and review spacewalk timelines at NASA’s Johnson Space Center in Houston.
Asked if moral in the astronaut office was taking a hit, with Kopra’s injuries and the possibility of astronaut Mark Kelly stepping aside as commander for the STS-134 mission due to the shooting of his wife, Rep. Gabrielle Giffords, Whitson countered, “Moral here is maybe even better than usual since everyone is pulling together to help the crewmembers during their difficult times.”
Seen in X-rays, the entire sky is aglow. Even far away from bright sources, X-rays originating from beyond our galaxy provide a steady glow in every direction. Astronomers have long suspected that the chief contributors to this cosmic X-ray background were dust-swaddled black holes at the centers of active galaxies. The trouble was, too few of them were detected to do the job.
An international team of scientists using data from NASA’s Swift satellite confirms the existence of a largely unseen population of black-hole-powered galaxies. Their X-ray emissions are so heavily absorbed that little more than a dozen are known. Yet astronomers say that despite the deeply dimmed X-rays, the sources may represent the tip of the iceberg, accounting for at least one-fifth of all active galaxies.
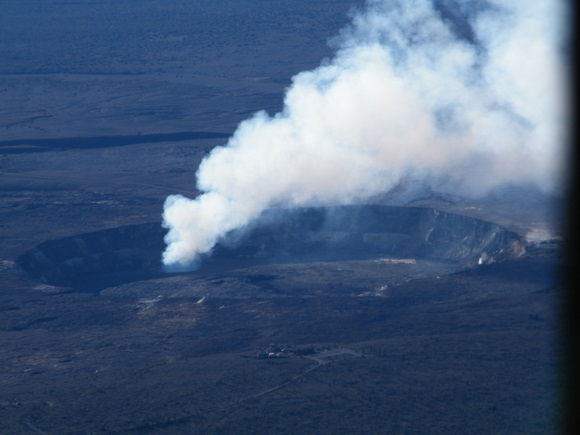
The Halema’uma’u Crater on the summit of Kilauea Volcano in Hawaii, on January 14, 2011. Image: Nancy Atkinson
[/caption]
Today, NASA’s Earth Observatory website featured an image of activity on the Kilauea Volcano in Hawaii. The image was personally exciting for me to see — not only because I find volcanoes fascinating — but because the day before the satellite image was taken (below) I was flying directly over Kilauea in a helicopter, searching for active lava flows.
Above is an image I took of Halema’uma’u Crater on the summit of Kilauea Volcano, which has been steadily emitting a plume of sulfur dioxide and other volcanic gases for several years. We did not see active flows here, but about 120 meters (390 feet) below the pit’s opening there is a lava pond that rises and falls as magma moves underneath Kilauea. See more of my images below, where we did find some active lava flows and lots of gas emitting from the surrounding region.
Activity at Kilauea, as seen from orbit by the Advanced Land Imager Instrument on the Earth Observing 1 satellite. Credit: NASAAnother view of the Halema’uma’u Crater on the summit of Kilauea Volcano. Image: Nancy Atkinson
Kilauea is the youngest and southeastern most volcano on the Big Island of Hawaii. It started erupting in 1983 and has been active ever since.
Another active caldera in the Kilauea region is the Pu`u `O`o Crater. Image: Nancy Atkinson
East of the summit of Kilauea is another active area, the Pu`u `O`o Crater. On January 14, we saw gas fuming throughout the crater.
Another view of the Pu`u `O`o Crater on January 14, 2011. Image: Nancy AtkinsonOne area of active lava in the Kilauea region. Image: Nancy Atkinson
We did find one crater with active orange magma bubbling underneath the grey, hardened lava. It is a little hard to make out in the image above, as there is some glare from the helicopter window, but there are a couple of small areas of orange tint, and that is the active lava. It wasn’t much, but it was exciting to see.
We did see lots of areas of sulfur dioxide gas venting from the Kilauea region, as in the two images below. According to the USGS Hawaiian Volcano Observatory, sulfur dioxide emission rates from the summit and east rift zone vents have elevated the past few month.
Sulfur dioxide vents on Kilauea. Image: Nancy AtkinsonMore sulfur dioxide vents at Kilauea. Image: Nancy AtkinsonLook closely for steam from lava flowing into the ocean. Image: Nancy Atkinson
We did see a small lava flow going into the ocean. Mostly, we just saw the steam rising as the lava made contact with the cold ocean water, but every once in a while we could see an orange glow on the shore, and as fast as I clicked my camera, unfortunately I never caught the orange glow, just the steam.
I can highly recommend the Big Island of Hawaii as a travel destination, as within its 10,432 square km (4,028 square miles) you can find all but two of the world’s climate zones and see everything from lush rain forests to volcanic deserts, to snow-capped mountains to black and white sandy beaches. You can drive around the entire island in 6 and a half hours, or in 2 hours in a helicopter see the entire island by air.
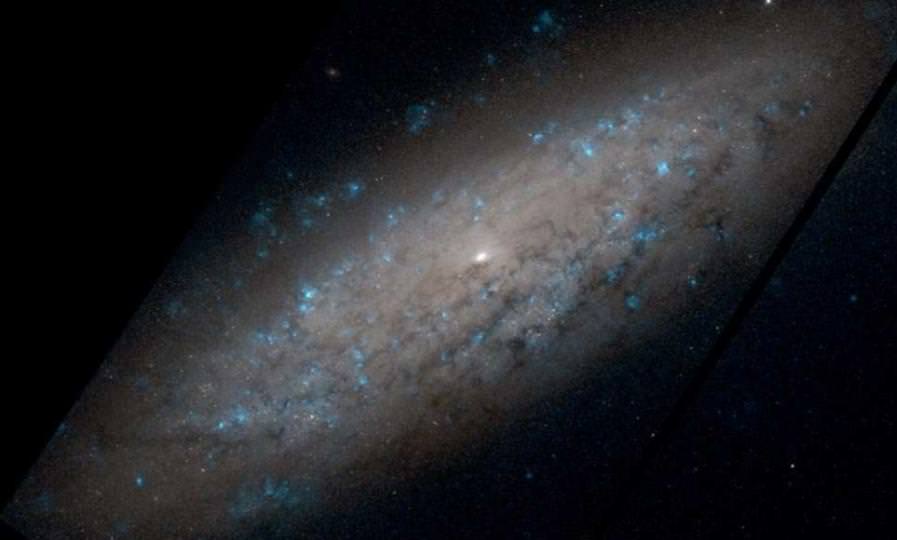
NGC 6503, another example of a bulge-less galaxy with a massive halo and a small black hole.
[/caption]
We only know they’re there because we can feel them in the dark… Feel their gravity, that is. Like a hide-and-go-seek game played on a moonless summer’s night, we only know that black holes and dark matter exist because we can feel the mass tagging us from beyond what our eyes can see. Are there monsters out there? Massive black holes have been found in galaxies with massive dark matter halos – but it doesn’t necessarily mean they’re in league with each other. Bring your bulge on over here to the dark side…
According to a press release from the Max-Planck-Institut; galaxies, such as our own Milky Way, consist of billions of stars, as well as great amounts of gas and dust. Most of this can be observed at different wavelengths, from radio and infrared for cooler objects up to optical and X-rays for parts that have been heated to high temperatures. However, there are also two important components that do not emit any light and can only be inferred from their gravitational pull. All galaxies are embedded in halos of so-called Dark Matter, which extends beyond the visible edge of the galaxy and dominates its total mass. This component cannot be observed directly, but can be measured through its effect on the motion of stars, gas and dust. The nature of this Dark Matter is still unknown, but scientists believe that it is made up of exotic particles unlike the normal (baryonic) matter, which we, the Earth, Sun and stars are made of.
The other invisible component in a galaxy is the supermassive black hole at its center. Our own Milky Way harbors a black hole, which is some four million times heavier than our Sun. Such gravity monsters, or even larger ones, have been found in all luminous galaxies with central bulges where a direct search is feasible; most and possibly all bulgy galaxies are believed to contain a central black hole. However, also this component cannot be observed directly, the mass of the black hole can only be inferred from the motion of stars around it. In 2002, it was speculated that there may exist a tight correlation between the mass of the Black Hole and the outer rotation velocities of galaxy disks, which is dominated by the Dark Matter halo, suggesting that the unknown physics of exotic Dark Matter somehow controls the growth of black holes. On the other hand, it had already been shown a few years earlier that black hole mass is well correlated with bulge mass or luminosity. Since larger galaxies in general also contain larger bulges, it remained unclear which of the correlations is the primary one driving the growth of black holes.
By studying galaxies embedded in massive dark halos with high rotation velocities but small or no bulges, John Kormendy and Ralf Bender tried to answer this question. They indeed found that galaxies without a bulge – even if they are embedded in massive dark matter halos – can at best contain very low mass black holes. Thus, they could show that black hole growth is mostly connected to bulge formation and not to dark matter. “It is hard to conceive how the low-density, widely distributed non-baryonic Dark Matter could influence the growth of a black hole in a very tiny volume deep inside a galaxy,” says Ralf Bender from the Max Planck Institute for Extraterrestrial Physics and the University Observatory Munich. John Kormendy, from the University of Texas, adds: “It seems much more plausible that black holes grow from the gas in their vicinity, primarily when the galaxies were forming.” In the accepted scenario of structure formation, galaxy mergers occur frequently, which scramble disks, allow gas to fall into the centre and thus trigger starbursts and feed black holes. The observations carried out by Kormendy and Bender indicate that this must indeed be the dominant process of black hole formation and growth.
So watch out next time you decide to play games in the dark… You might just get eaten instead of… ahem… tagged.
Original Story Source: Max-Planck-Institut / Image: wikisky.org. We thank you so much!
One of the biggest unknowns for the Mars Science Lab — a.k.a Curiosity — is the landing system, called the Sky Crane, which has never been used before for a spacecraft landing on another planet. It is similar to a sky crane heavy-lift helicopter, and it works like this: after a parachute slows the rover’s descent toward Mars, a rocket-powered backpack will lower the rover on a tether during the final moments before landing. This method allows landing a very large, heavy rover on Mars (instead of the airbag landing systems of previous Mars rovers).
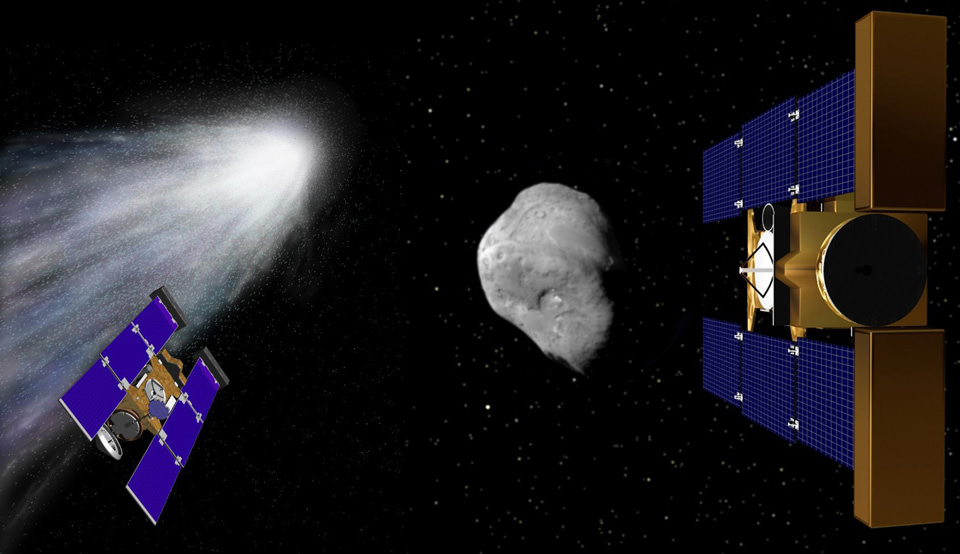
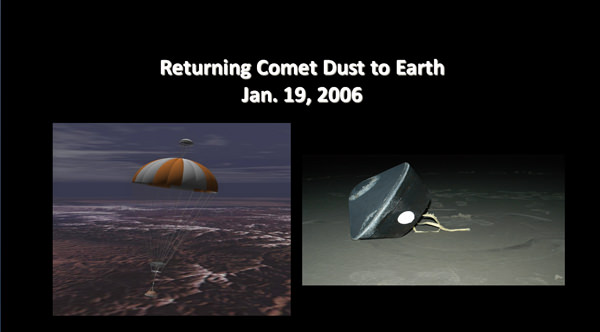
Stardust-NExT: 2 Comet Flybys with 1 Spacecraft. Stardust-NExT makes history on Valentine’s Day - February, 14, 2011 – by becoming the first spacecraft to visit 2 comets and gather science data: Comet Wild 2 in 2004 (left) and Comet Tempel 1 in 2011 (right). Artist renderings Credit: NASA. Collage: Ken Kremer. See video below of Jan 19, 2011 Media briefing from the Science Team about plans for the Temple 1 cometary encounter
[/caption]
After a more than decade long journey of 6 billion kilometers, hopes are high for a celestial date in space between an icy comet and a thrusting probe on Valentine’s Day 2011. The rendezvous in space between NASA’s approaching Stardust-NExT spacecraft and Comet Tempel 1 takes place nearly on the exact opposite side of the Sun on Feb 14, 2011 at approximately 11:37 p.m. EST (8:37 p.m. PST).
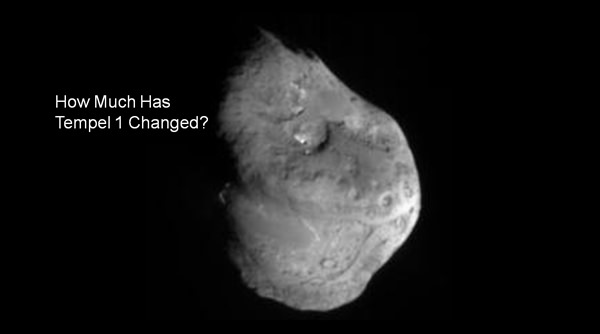
The top science goal is to find out “how much the comet’s surface has changed between two close passages to the sun” since it was last visited in 2005, said principal investigator Joe Veverka of Cornell University, Ithaca, N,Y at a media briefing today, Jan 19, at NASA Headquarters. Indeed it’s the first time in history that a comet has been visited twice by space probes from Earth.
The lead scientists and engineers outlined the plans for the cometary flyby at the briefing. See a video of the entire briefing below.
Since the last visit in 2005, the comet has completed another orbit around the sun. “It will be the first time we’ll be able to see changes after a comet has passed through one perihelion,” explained Veverka. Tempel 1 belongs to the Jupiter family of comets and orbits between Mars and Jupiter.
Comet Tempel 1 suffered a cosmic collision during that first encounter with an emissary from Earth when NASA’s Deep Impact smashed a copper projectile directly into the comets nucleus. The blast created an impact crater and ejected an enormous cloud of gas and debris. Reflected light off the dust particles totally obscured the view of the crater and prevented any images from being taken. Researchers had hoped to determine the size of the crater. A lot of bets hinge on that determination.
“We have a chance to complete the Deep Impact experiment. We hope to see how big the impact crater is and what that tells us about the mechanical properties, ” said Veverka.
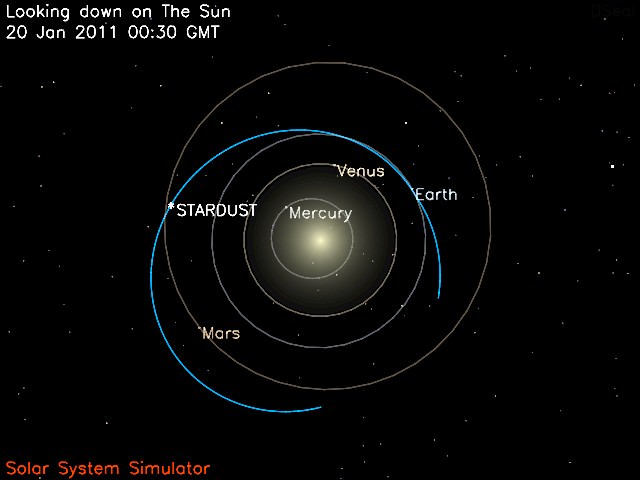
20 Jan. 2011 Position of STARDUST-NExT probe - Looking Down on the Sun.
This image shows the current position of the STARDUST-NExT spacecraft and the spacecraft's trajectory (in blue) around the Sun. Credit: NASA
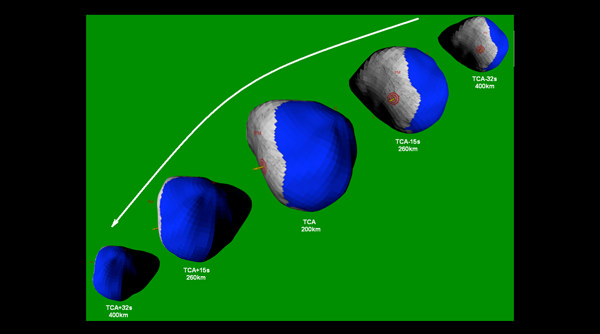
With just over 3 weeks remaining, the craft is approximately 24.6 million kilometers (15.3 million miles) away from its encounter. Stardust-NExT will zoom past the nearly 6-kilometer-wide comet (3.7 miles) at a distance of approximately 200 kilometers (124 miles) and at a speed of 10 km/sec according to Tim Larson, the mission’s project manager from the Jet Propulsion Laboratory (JPL), Pasadena, Calif.
“The spacecraft is still working well 12 years after launch. This is a bonus mission with a scientifically desirable target which we can get close to,” said Larson.
“Everything will happen autonomously,” stated Larson. “The craft will be about 2 AU away from Earth at encounter. Since the round trip signals will take about 40 minutes there is no chance for any real time changes.”
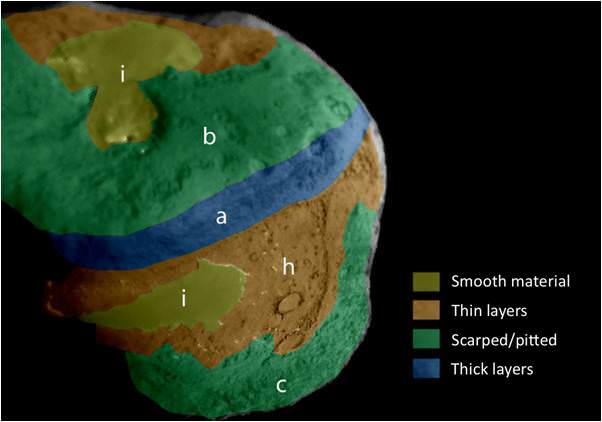
Different features on Tempel 1 discovered by Deep Imapct in 2005. Credit: NASA
“Stardust-NExT will take 72 high resolution images during the close approach encounter. These will be stored in an onboard computer and relayed back to Earth starting about an hour later. It will take about 12 hours to get them all back.”
NASA says that after processing, the images are expected to be available at approximately 4:30 a.m. EST (1:30 a.m. PST) on Feb. 15.
“For the first time we’ll go back to see what happens to a comet since our last visit,” explained Pete Schultz, co-investigator of Brown University, Providence, R.I. “The comet has been out to the orbit of Jupiter and back to Mars and had several outbursts of gas and dust. In 2005 we saw old and new surfaces. So it has a complicated geologic history. We hope to resolve the crater and see ejecta. But there are many unknowns. What we see – whether its the crater or the other unseen side – all depends on the rotation of the comet nucleus.”
“The comet dynamics are complex and erratic, not inert,” said Steve Chesley, a co-investigator at JPL. “They are like a rocket with no one at the controls. The orbit can change. So it is a huge challenge to target a spacecraft for a flyby or rendezvous.”
Stardust successful original mission was to fly by Comet Wild 2 on Jan 2, 2004. It then returned cometary dust particle in a sample return canister to Earth on Jan. 19, 2006 which reentered the atmosphere at the highest speed ever and parachuted to a safe landing. Credit: NASA
Stardust-NeXT is a repurposed spacecraft. The Valentine’s Day encounter will be the last hurrah for the aging probe. Stardust was originally launched way back in 1999. It flew by Comet Wild 2 on Jan. 2, 2004 and collected cometary dust particles which were returned to Earth in a sample return capsule in Jan. 2006. Since then it has continued its solitary voyage through the void of the space.
The craft is nearly out of fuel and all movements consume fuel. It is totally dependent on the reaction control thrusters for navigating through space and pointing its camera and science instruments, said Larson.
“We are confident that we will have enough fuel to finish up this mission. It has been a big, big challenge to maintain a reserve supply. After the mission there won’t be much left that the spacecraft can do. The last trajectory correction maneuver is two days before arrival. That is also when we will take our last optical navigation images for targeting the spacecraft.”
.
Only about a third of the surface of Tempel 1 was photographed by Deep Impact in 2005. “We’ll be looking at old territory and new and some overlap,” explained Veverka. “The science team is awfully excited and just can’t wait to see the pictures on Valentine’s day.”
“We have no idea how quickly the surface features change and whether its millions of years or days,” concluded Veverka.
“We expect new discoveries no matter what we see,” Larson summed up
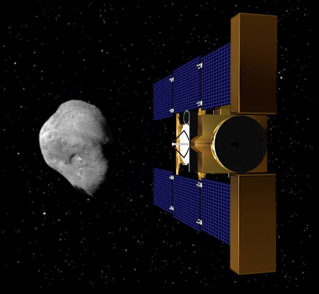
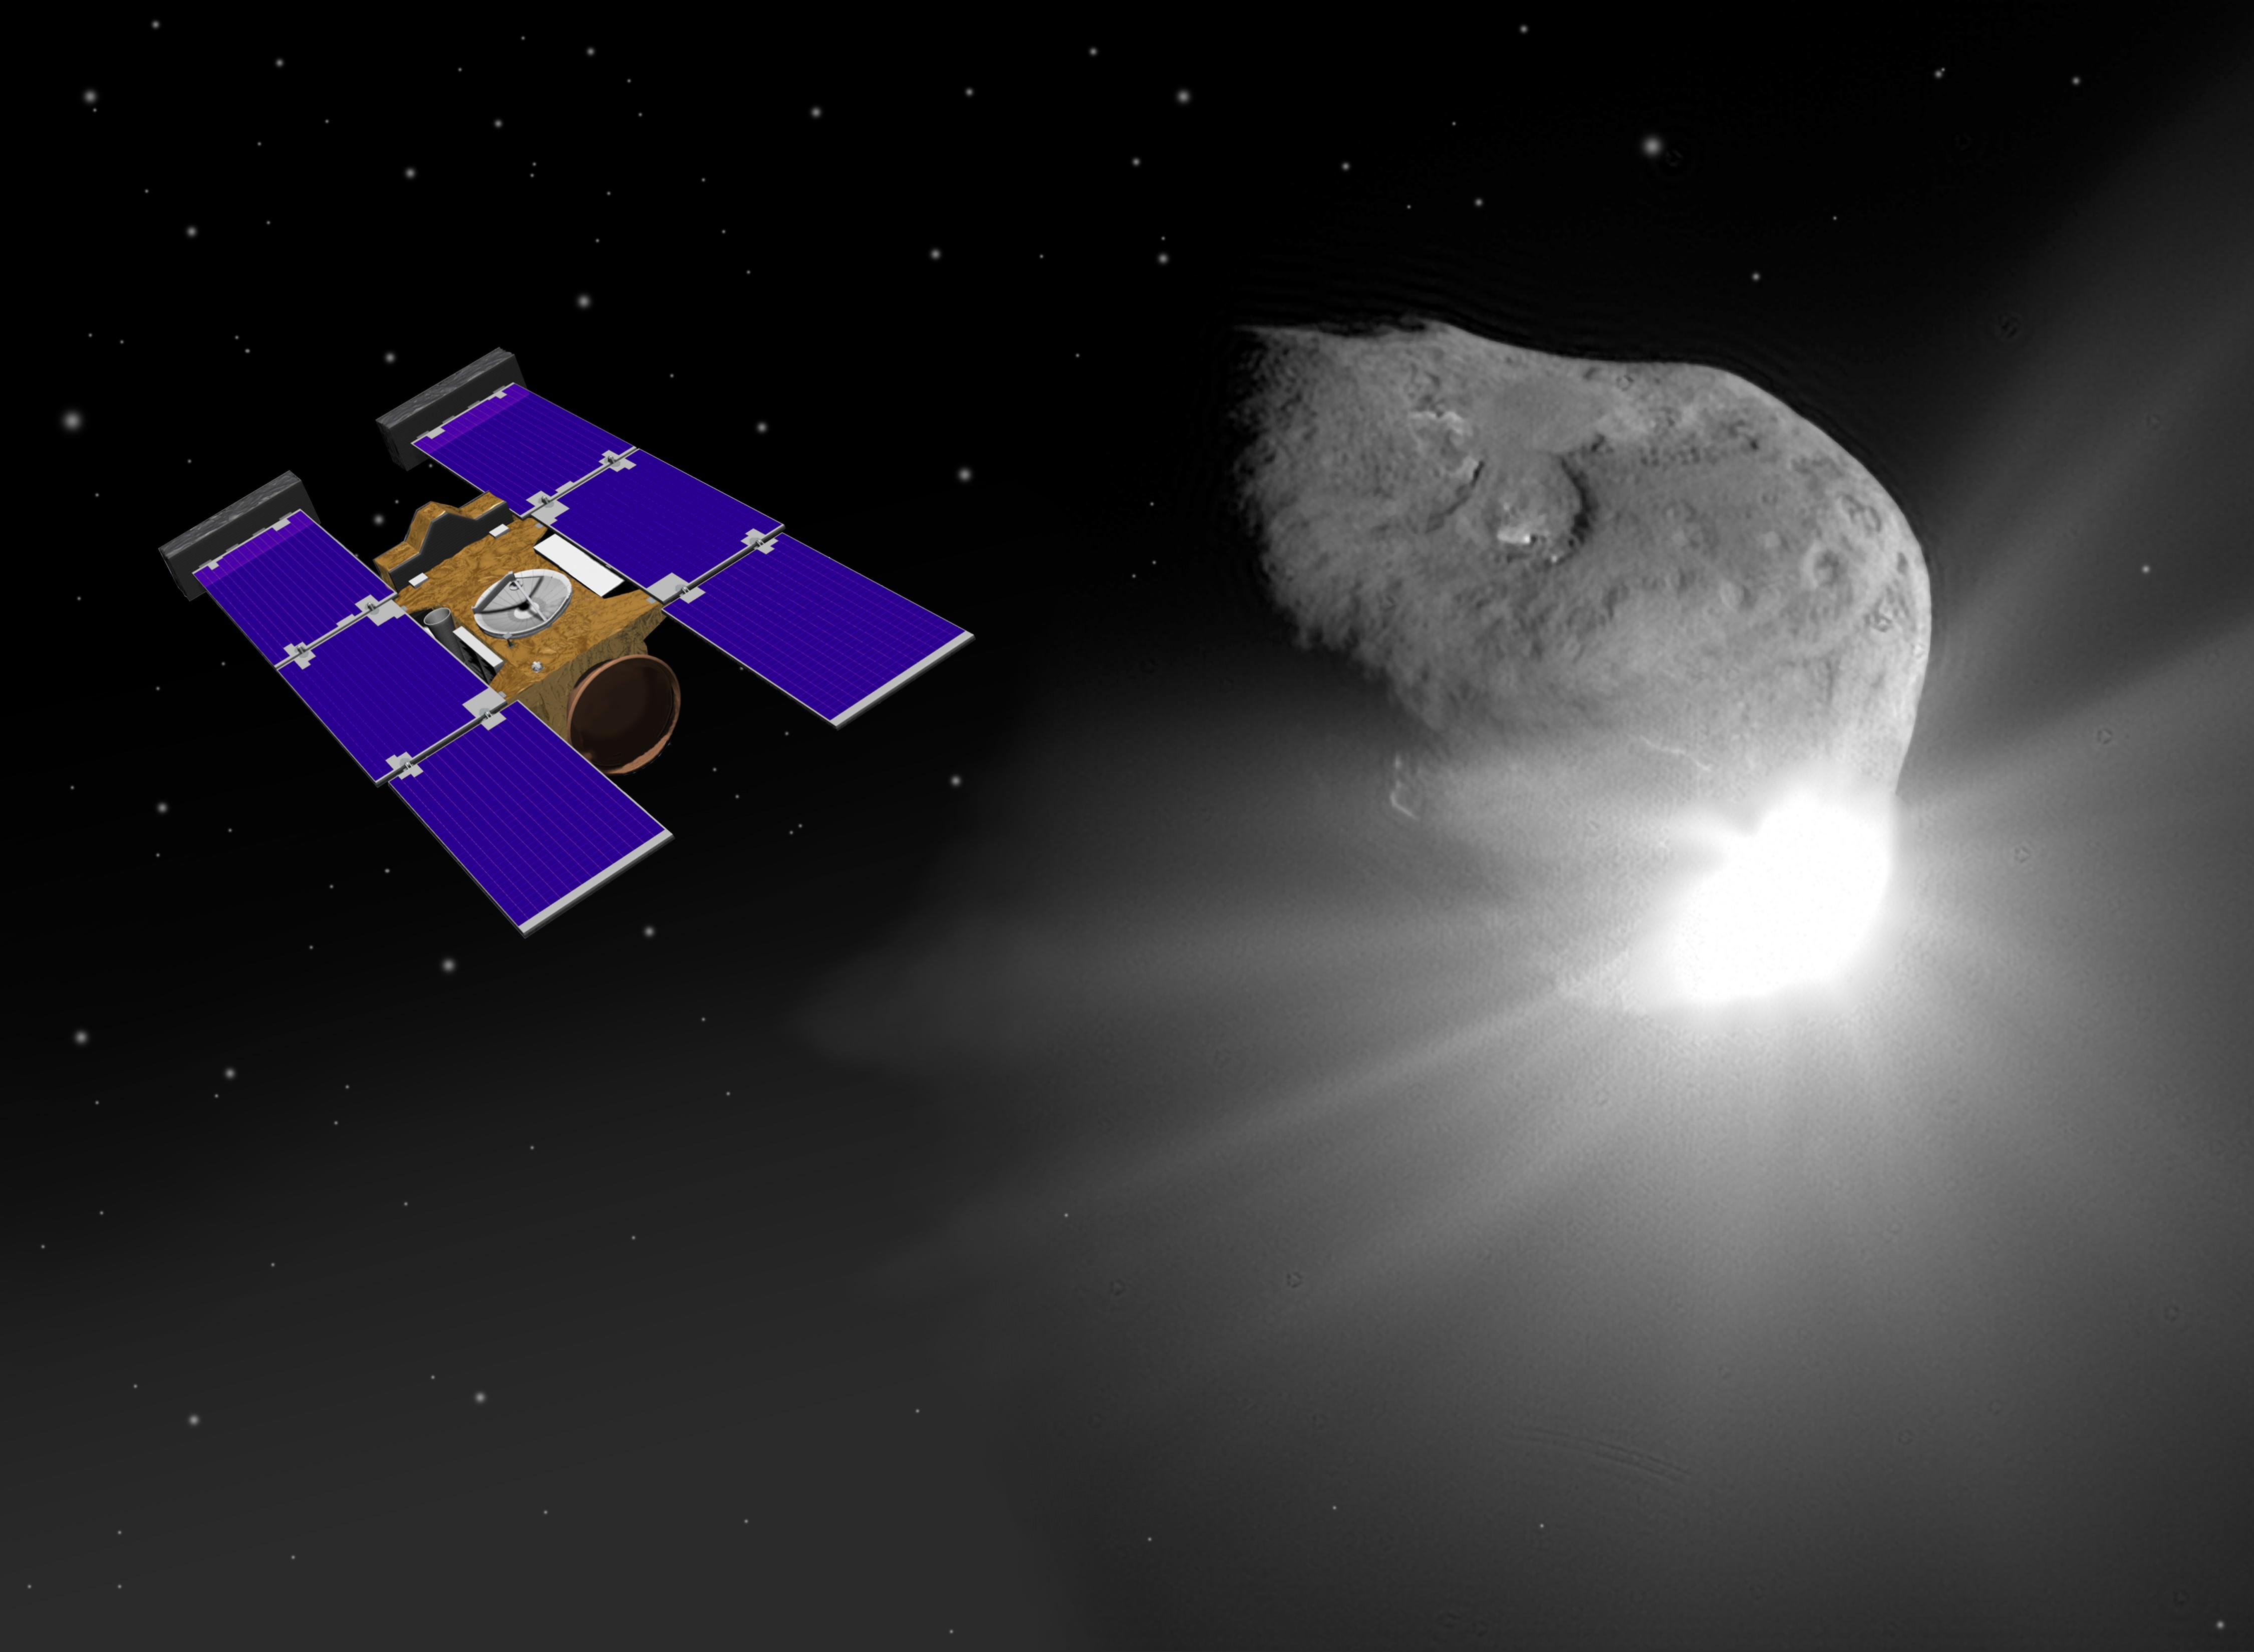
Stardust-NExT Spacecraft & Comet Tempel 1. Artist rendering of Stardust-NExT spacecraft nearing Comet Tempel 1 for upcoming flyby on February, 14, 2011. Credit: NASA
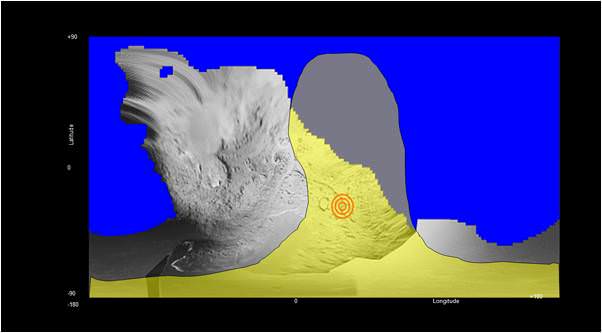
See video and graphics below of Jan 19, 2011 Media briefing from the Science Team about plans for the cometary encounterPlanned imaging of Comet Tempel 1 by Stardust-NExT during flyby. Blue area is unseen and unmapped territory never imaged by Deep Impact during 2005 flyby. Bulls eye in yellow area is expected location of 2005 impact crater and expected new coverage. There is some overlap. Credit: NASAPlanned imaging of Comet Tempel 1 by Stardust-NExT during flyby. Blue area is unseen and unmapped territory never imaged by Deep Impact during 2005 flyby. Credit: NASA
Jan. 19, 2010: Science Team Media Briefing
The Stardust spacecraft has been repackaged for the Stardust-NexT mission. Stardust-NExT will rendezvous with Comet Tempel 1 on February 14, giving scientists an opportunity, for the first time, to search a comet’s surface for changes following its orbit around the sun. Mission scientists discussed the relevance of the mission at a briefing at NASA headquarters in Washington Stardust successful original mission was to fly by Comet Wild 2 on Jan 2, 2004 and return cometary dust particle to earth in Jan. 2006. It is equipped with 3 science instruments. Credit: NASA
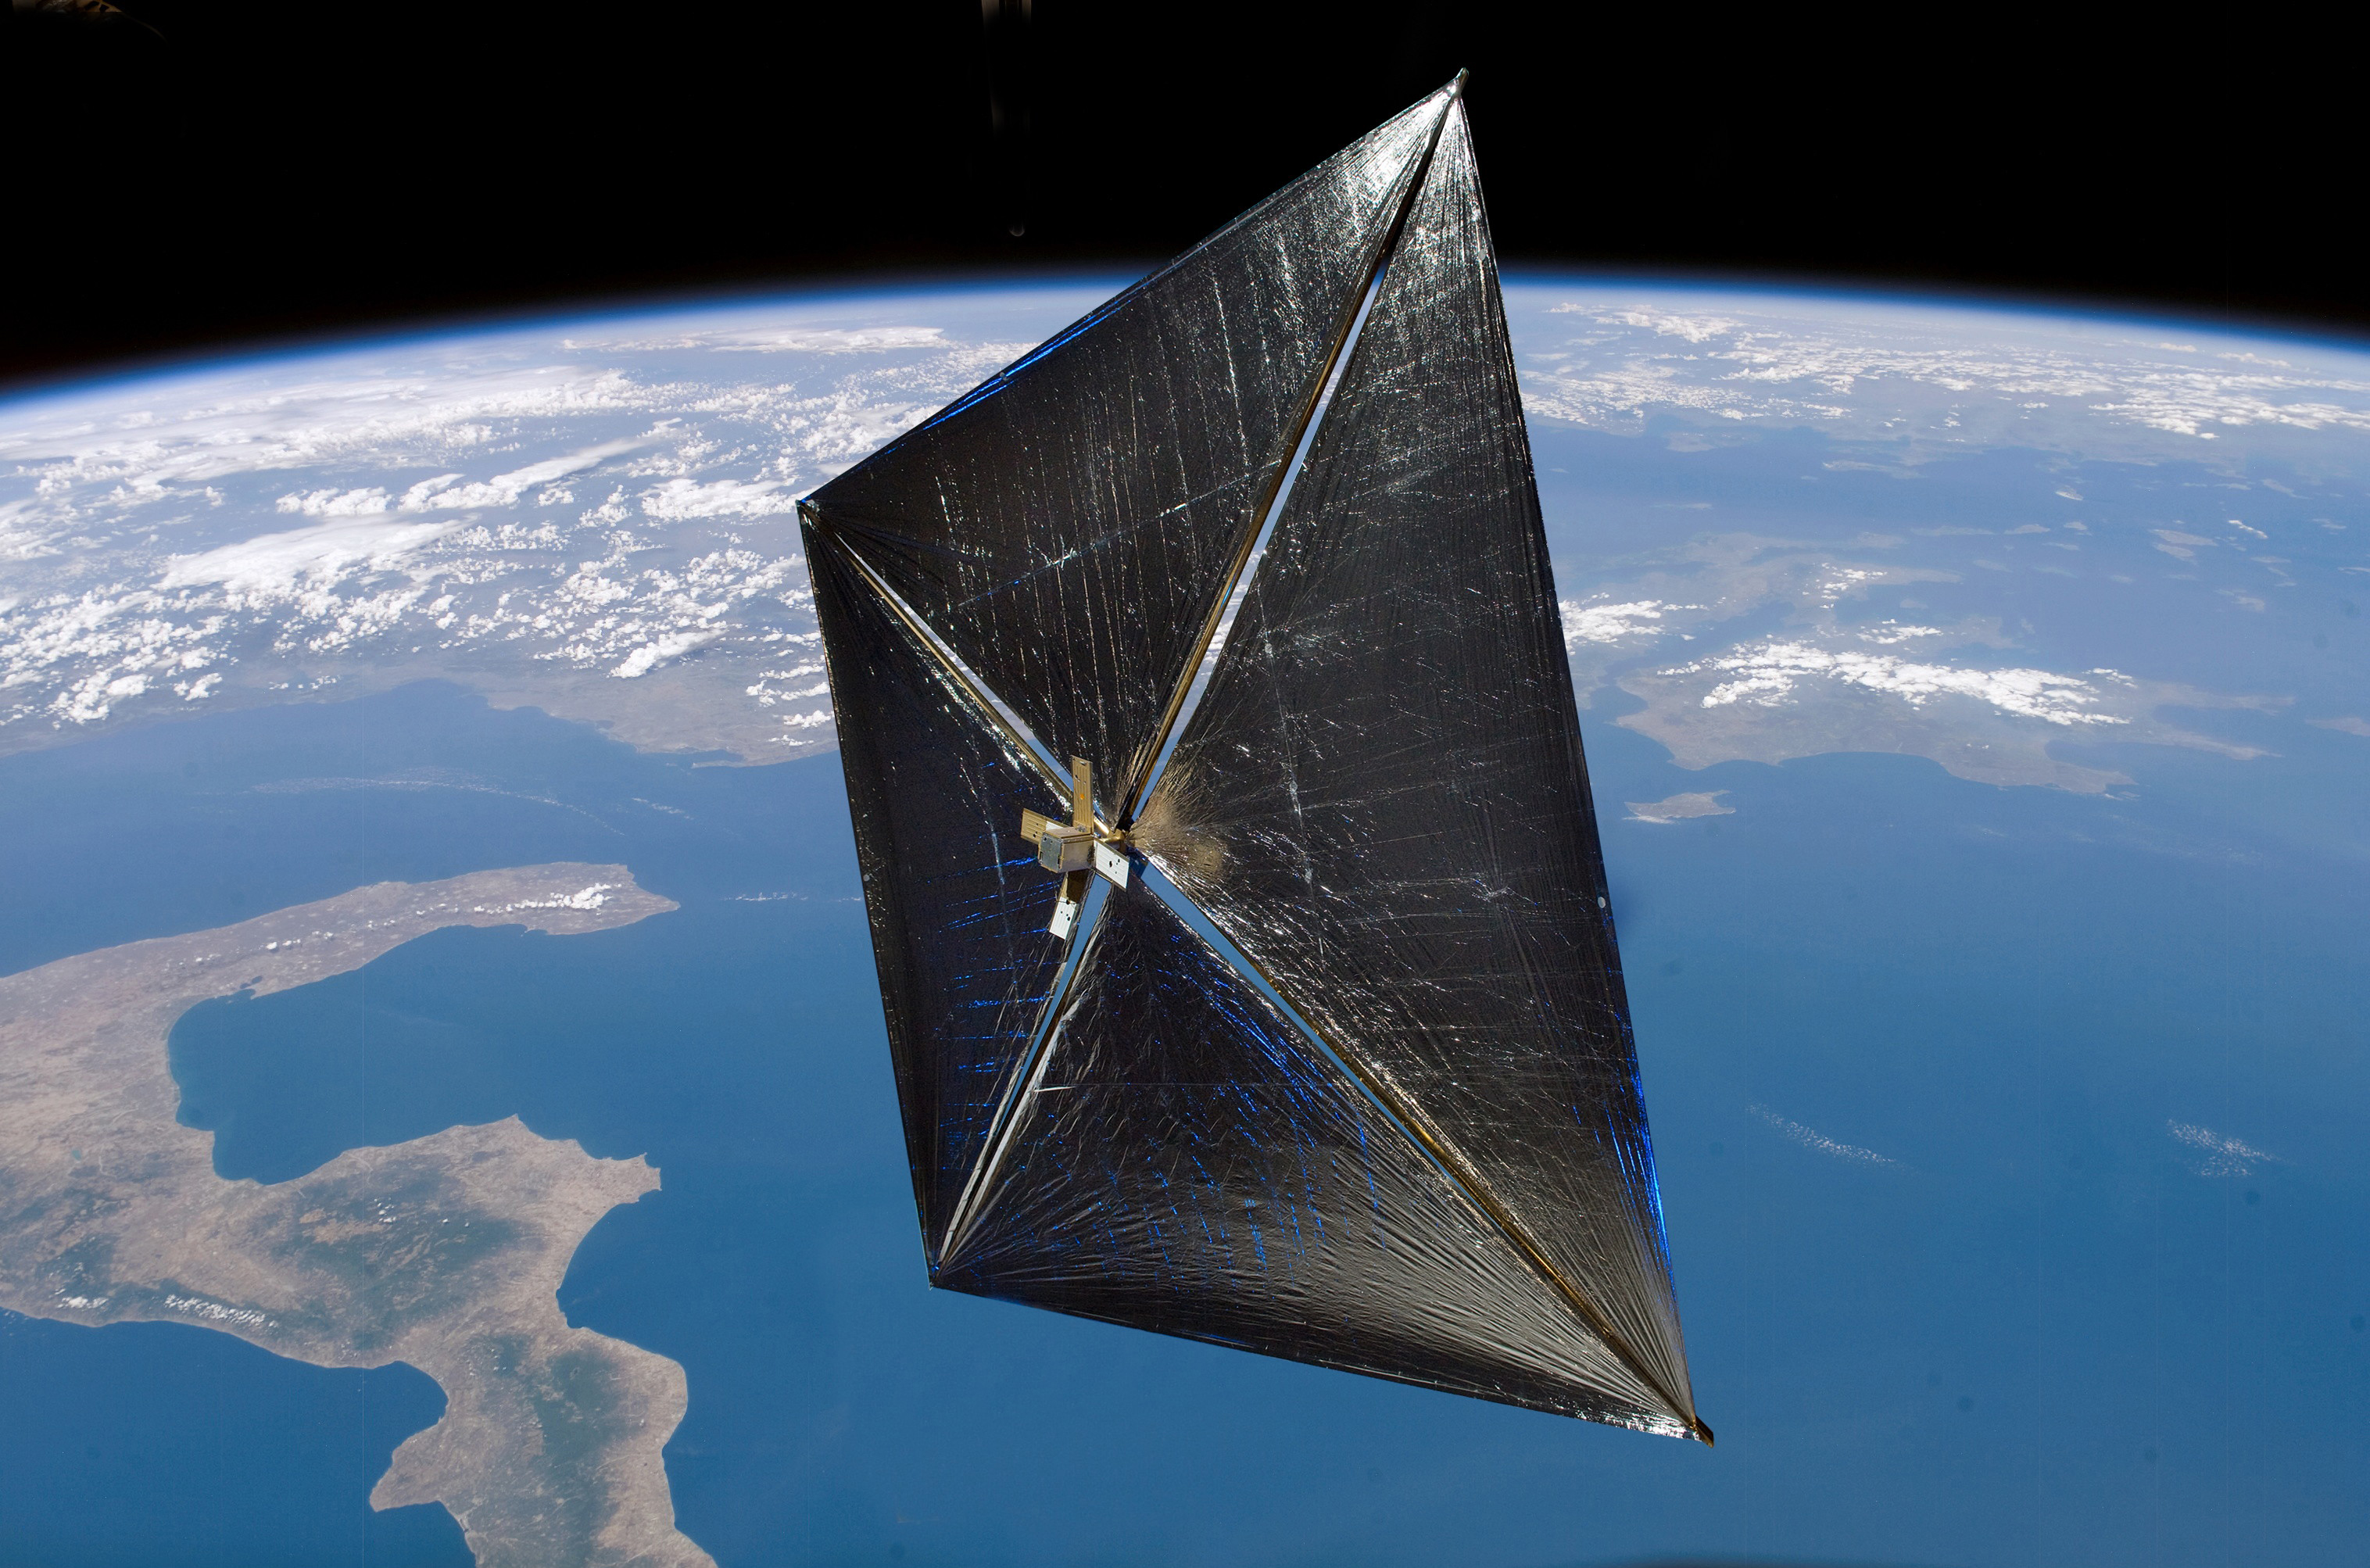
Artist concept of Nanosail-D in Earth orbit. Credit: NASA
[/caption]
A small solar sail that was thought to be a lost cause has “spontaneously” come back to life. The NanoSail-D — a NASA-designed solar sail cubesat that launched in December but suddenly went silent without confirmation of its deployment — unexpectedly ejected from its host satellite on Wednesday, Jan. 19 at 11:30 a.m. EST. Engineers at Marshall Space Flight Center confirmed that the NanoSail-D nanosatellite ejected from Fast Affordable Scientific and Technology Satellite, FASTSAT, when they looked at onboard FASTSAT telemetry. The ejection of NanoSail-D also has been confirmed by ground-based satellite tracking.
Now NASA is asking for help from ham radio operators to listen for the signal to verify NanoSail-D is operating. And knowing the status of the solar sail is time critical.
“This is great news for our team. We’re anxious to hear the beacon which tells us that NanoSail-D is healthy and operating as planned,” said Dean Alhorn, NanoSail-D principal investigator and aerospace engineer at the Marshall Center. “The science team is hopeful to see that NanoSail-D is operational and will be able to unfurl its solar sail.”
If you are a ham operator, This information should be sent to the NanoSail-D dashboard at: http://nanosaild.engr.scu.edu/dashboard.htm. The NanoSail-D beacon signal can be found at 437.270 MHz. You can learn more at the MSFC’s Ham Radio Operator’s webpage.
NanoSail-D was designed to test the potential for solar sails in atmospheric braking. On December 6, 2010, it was schedule to eject from the FASTSAT, and initially it looked as though it did. But later, ground controllers were unable to confirm if the solar sail had ejected or deployed. Further analysis showed no evidence of NanoSail-D in low-Earth orbit, leading the team to believe NanoSail-D remained inside FASTSAT.
Now, with this latest news that the loaf-of-bread-sized satellite has ejected on its own, the NanoSail-D science team is hopeful the nanosatellite is healthy and can complete its solar sail mission. But the sequence of events are time critical.
After ejection, a timer within NanoSail-D begins a three-day countdown as the satellite orbits the Earth. Once the timer reaches zero, four booms will quickly deploy and the NanoSail-D sail will start to unfold to a 100-square-foot polymer sail. Within five seconds the sail fully unfurls.
“We knew that the door opened and it was possible that NanoSail-D could eject on its own,” said Mark Boudreaux, FASTSAT project manager at the Marshall Center. “What a pleasant surprise this morning when our flight operations team confirmed that NanoSail-D is now a free flyer.”
If the deployment is successful, NanoSail-D will stay in low-Earth orbit between 70 and 120 days, depending on atmospheric conditions. NanoSail-D is designed to demonstrate deployment of a compact solar sail boom system that could lead to further development of this alternative solar sail propulsion technology and FASTSAT’s ability to eject a nano-satellite from a micro-satellite — while avoiding re-contact with the FASTSAT satellite bus.
Before there was GPS, navigators had to rely on the Sun and the stars to find their way around the Earth. It’s easier than it sounds, if you’ve got the right instruments, clear skies, and a really accurate clock. Let’s examine the history of celestial navigation, learn about the different methods, and then give you some practical ways that you can go out and learn how to do this for yourself.
Here’s this week’s image for the Where In The Universe Challenge, to test your visual knowledge of the cosmos. You know what to do: take a look at this image and see if you can determine where in the universe this image is from; give yourself extra points if you can name the instrument responsible for the image. We’ll provide the image today, but won’t reveal the answer until later this week. This gives you a chance to mull over the image and provide your answer/guess in the comment section. Please, no links or extensive explanations of what you think this is — give everyone the chance to guess.
UPDATE: The answer has now been posted below.
I’m really disappointed no one thought this was a picture of the Moon, as seen by the Apollo astronauts. That’s not what it is, but that was my thought when I first saw the image. This actually is an image I took of a lava field on the Big Island of Hawaii when I visited there recently. I was flying in a helicopter looking for lava flows and (see my article about flying over Kilauea Volcano) and this lava field does look as barren as the Moon, and I thought the window markings on the helicopter looked reminiscent of the Apollo Moon Lander windows.
Anyway, the great thing about the Big Island is that it is like a microcosm of the planet, with 10 of the world’s 14 or 15 identified climate zones contained in a 2 hour helicopter tour. Just a short flight from this lava field is a lush rainforest — and in the opposite direction is a sandy ocean beach. The affect of water on the rough lava is amazing.

")
")
")
 and currently considered (blue) landing sites for the Russian Phobos-Grunt mission. Credits: ESA/DLR/FU Berlin (G. Neukum)")