Mars Express Set for Phobos Flyby

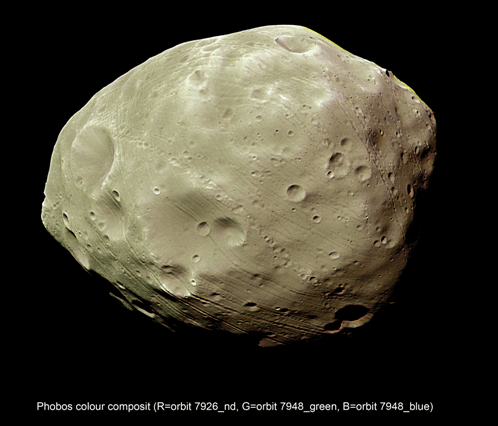
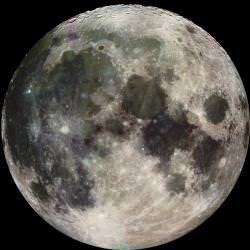
A coloured view of Phobos made from images taken from two different flybys in March 2010. Credit: ESA/ DLR/FU Berlin (G. Neukum).

[/caption]

The Mars Express spacecraft will be making a very close flyby of the moon Phobos Sunday, January 9, 2011, at a distance of only 111 km from the center of the moon. The spacecraft actually is having eight different fairly close flybys of Phobos between December 20, 2010 and 16 January 2011, but this is the closest of that group. The Sunday buzz-by will be the third closest that Mars Express has performed during its time in orbit at Mars. The flyby speed will be about 3 km/s.

Olivier Witasse, ESA Project Scientist for Mars Express did a Q&A about the flyby with the Mars Express blog, which we’ll post below.

Q: What is the prime objective of this fly-by?

Witasse: The prime objective is to obtain high-resolution data from all remote sensing instruments, and especially to acquire what we hope will be spectacular images using the High Resoultion Stereo Camera (HRSC).

Q: What do the camera team hope to achieve?

Witasse: The HRSC camera will cover the southern hemisphere, which has not been well imaged during previous encounters. It should achieve a ground resolution of about a few metres per pixel. The emphasis will be on stereo imaging. These new data will improve the Phobos elevation model. This time, no colour data will be taken.

Q: Will any other instruments be working?

Witasse: The OMEGA, PFS and SPICAM experiments will acquire new data in the ultraviolet, visible and infrared ranges. This will significantly improve a data set used to map the surface temperatures. Also, and this is very important, the data are being used to find out the composition of Phobos. This is a very difficult exercise, because the spectra lack the obvious signatures of known components such as minerals.

The MARSIS radar will also be working, attempting to obtain echoes from beneath the surface. To complete the picture, the ASPERA experiment will record signatures of the interaction between the solar wind and Phobos, by detecting solar wind particles bouncing off the surface.

All these new data can help unlock the origin of the Martian moons, and will certainly support the Russian sample return mission, Phobos-Grunt, expected to be launched later this year. Unfortunately, the Phobos-Grunt landing site will be at the fringes of view this time and so poorly illuminated.


Q: Why no radio science this time?

Witasse: Given the design of the Mars Express spacecraft, we always have to make a choice between radio-science and remote sensing. In other words, we cannot point the camera towards the target and the high-gain antenna towards Earth at the same time.

For this particular flyby, at 111 km, we decided to give priority to remote sensing for many reasons. Flybys over the illuminated side of Phobos obviously favour the operations of the imagers and spectrometers. Also, the altitude of this flyby is not ideal for radio-science. To improve the gravity data set, we would need to fly below 60 km. Furthermore, at the moment Mars is far from Earth and close to the Sun (as seen from Earth), making the quality of radio-signal unsuitable for a detailed scientific analysis.
——————
In another blog post, the Mars Express team said to expect no pictures from the flyby until January 21, because the whole Phobos data set won’t be downloaded to Earth until January 18. The HRSC team will then process the data, and we can expect a release of images (including a 3D view) on Friday, 21 January.

Source: Mars Express Blog

Shuttle Discovery Launch Date Pushed Back Again

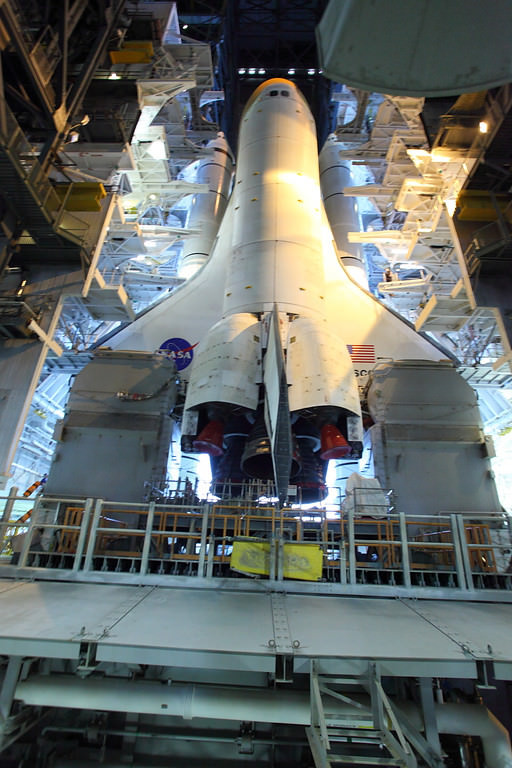
Discovery in the VAB. Credit: Alan Walters (awaltersphoto.com)

[/caption]

NASA managers met on Thursday and ruled out any possibility of space shuttle Discovery’s external tank being ready in time for the launch window that opens on February 3. Now, NASA is shooting for the window that opens on Feb. 27, but is working to see if International Space Station on-orbit operations would allow a launch as early as Feb. 24. More will be known next week and managers hope to set a launch date by January 14.


The space agency reported that progress continues to be made in understanding the most probable cause of cracks discovered on Discovery’s external tank mid-section, known as the intertank. Cracks on support beams called stringers were found after the tank was loaded with cryogenic fuel for a subsequently scrubbed launch attempt on November 5th. Four additional small cracks were found during X-ray examinations of the backside of the tank after Discovery was returned to the Vehicle Assembly Building before Christmas.

Plans are for the repair work to continue through the weekend. The shuttle program also reviewed the plan to modify as many as 32 additional stringers with radius blocks, which will provide added structural support in areas known to carry much of the structural load of the external tank. These radius blocks essentially fit over existing stringer edges through which the securing rivets are installed to provide additional structural support. The radius block modification is a known and practiced structural augmentation technique used extensively on the intertank. This work should begin as soon as the repairs to the three stringers with the four additional small cracks have been completed, likely in the next day or so, and the modification of the additional 32 stringers is expected to be complete next week.

Whether further delays could cause a leapfrog of missions remains to be seen. Launch dates for Discovery and Endeavour will be discussed at the January 13 Space Shuttle Program Requirements Control Board meeting.

Astrophoto: The Seagull Nebula

The Seagull Nebula. Credit: Cesar Cantu from Monterrey, Mexico, and the Chilidog Observatory

This lovely image of the Seagull Nebula was sent to us by Cesar Cantu from the Chilidog Observatory in Monterrey, Mexico. He took the image on January 4, 2011 using a Takahashi FSQ106 Telescope and a Canon 5D camera. The Seagull is near Sirius, the main star in the constellation Canis Major. The region also includes NGC 2327 – a compact, dusty emission region with an embedded massive star that forms the bird’s head and IC 2177 – forming the sweeping arc of the seagull’s wings. The image is dominated by the reddish glow of atomic hydrogen and is about 3,800 light-years away.

Beautiful! See more at Cesar’s website, Astrophoto.

Previously Unseen Super-Hot Plasma Jets Heat the Sun’s Corona

Multiwavelength extreme ultraviolet image of the Sun taken by the Solar Dynamics Observatory's Atmospheric Imaging Assembly. Colours represent different gas temperatures: ~800,000 Kelvin (blue), ~1.3 million K (green), and ~2 million K (red). New observations reveal jets of hot plasma propelled upwards from the region immediately above the Sun's surface. Image: Bart De Pontieu)

[/caption]

The mystery of the Sun’s corona may finally be solved. For years researchers have known – and wondered why – the Sun’s outer atmosphere, or corona, is considerably hotter than its surface. But now, using the combined visual powers of NASA’s Solar Dynamics Observatory and Japan’s Hinode satellite, scientists have made direct observations of jets of plasma shooting off the Sun’s surface, heating the corona to millions of degrees. The existence of these small, narrow jets of plasma, called spicules has long been known, but they had never been directly studied before and were thought to be too cool to have any appreciable heating effect. But a good look with new “eyes” reveals a new kind of spicule that moves energy from the Sun’s interior to create its hot outer atmosphere.

“Heating of spicules to millions of degrees has never been directly observed, so their role in coronal heating had been dismissed as unlikely,” says Bart De Pontieu, the lead author and a solar physicist at LMSAL.


Solar physicst and former Universe Today writer Ian O’Neill (and current Discovery Space producer, and of Astroengine fame) compared the anomaly of the Sun’s atmosphere being hotter than the surface to if the air surrounding a light bulb was a couple of magnitudes hotter than the bulb’s surface. And, he said, you’d want to know why it appears the solar atmosphere is breaking all kinds of thermodynamic laws.

Over the years, experts have proposed a variety of theories, and as De Pontieu said, the spicule theory had been dismissed when it was found spicule plasma did not reach coronal temperatures.

Solar spicules as imaged by NASA's Solar Dynamics Observatory. Credit: NASA

But In 2007, De Pontieu and a group of researchers identified a new class of spicules that moved much faster and were shorter lived than the traditional spicules. These “Type II” spicules shoot upward at high speeds, often in excess of 60 miles per second (100 kilometers per second), before disappearing. The rapid disappearance of these jets suggested that the plasma they carried might get very hot, but direct observational evidence of this process was missing.

Enter SDO and its Atmospheric Imaging Assembly instrument which launched in February 2010, along with NASA’s Focal Plane Package for the Solar Optical Telescope (SOT) on the Japanese Hinode satellite.

“The high spatial and temporal resolution of the newer instruments was crucial in revealing this previously hidden coronal mass supply,” said Scott McIntosh, a solar physicist at NCAR’s High Altitude Observatory. “Our observations reveal, for the first time, the one-to-one connection between plasma that is heated to millions of degrees kelvin and the spicules that insert this plasma into the corona.”

The spicules are accelerated upward into the solar corona in fountain-like jets at speeds of approximately 31 to 62 miles per second (50 to 100 kilometers per second). The research team says that the majority of the plasma is heated to temperatures between 0.02 and 0.1 million Kelvin, while a small fraction is heated to temperatures above one million Kelvin.

A key step in learning more about the Sun, according to De Pontieu, will be to better understand the interface region between the Sun’s visible surface, or photosphere, and its corona. Another NASA mission, the Interface Region Imaging Spectrograph (IRIS), is scheduled for launch in 2012. IRIS will provide high-fidelity data on the complex processes and enormous contrasts of density, temperature, and magnetic field between the photosphere and corona. Researchers hope this will reveal more about the spicule heating and launch mechanisms.
This research appears in the 07 January issue of Science.

Sources: Science, Astroengine

“Aflockalypse” — Mass Animal Deaths Now Mapped on Google

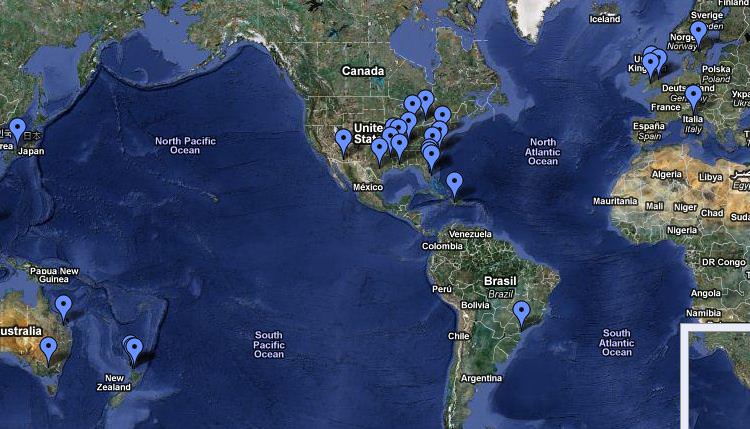
Screenshot of the Google Maps Aflockalypse maps of mass bird deaths.

[/caption]

You have to admit, the news is a little weird: 5,000 blackbirds falling dead from the sky in Arkansas; tens of thousands of dead fish in Chesapeake Bay; 50-100 dead birds found strewn in lawns in Sweden; 40,000 dead crabs washed up on England’s shores; 530 penguins, numerous other seabirds, five dolphins, and three giant sea turtles dead in Brazil; 200 American Coots dead on a Texas bridge; hundreds of snapper fish dead in New Zealand. And the list keeps growing.

Eerie coincidence? Or just a symptom of the digital age where news travels faster than you can say “The End is Nigh?”

You can now keep track of what is being called “Aflockalypse” on Google Maps.

Google Maps links reports of animal deaths, as well as reports of birds that have succumbed to the bird flu. By clicking on the blue balloons on the map you will be given a link that will provide the original news report. You can also click the links in the left side panel of the map.

The map provides a quick look at where the mass, unexplained deaths are taking place. But some say the map could help solve the mystery, as there has been suggestions the map could be overlaid on a current global oil exploration map to test the hypothesis that the deaths could have been caused by ground penetrating tomography.

This isn’t the first time that unexplained mass animal deaths have occurred — see this article on Time for the “Top 10 Strange Mass Animal Deaths” — but it seems unprecedented to have them happen all over the world within a few days.

Or is it? Others have suggested that the internet age allows us to connect the dots where there are none to be connected. The dead birds in Arkansas on New Years Eve — seemingly the first report of mass animal deaths — have been attributed to them flying through a fireworks display, and there could be logical reasons for the others, too.

Find out more by interacting with the Google Map.

Apollo Data Retooled to Provide Precise Readings on Moon’s Core

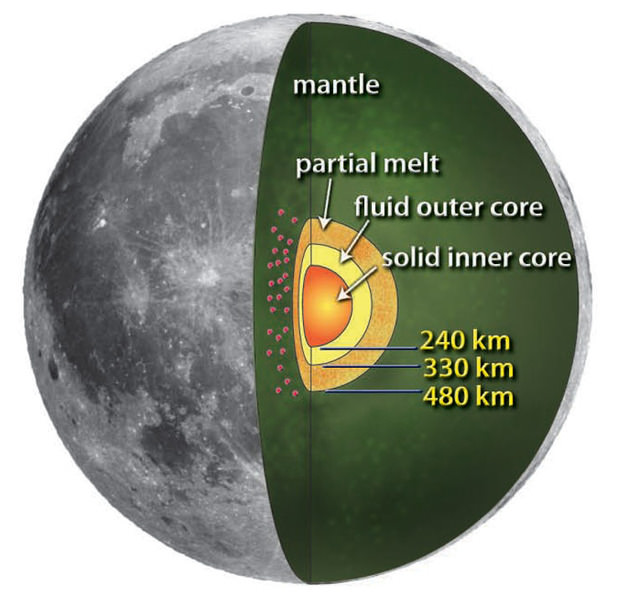
A new look at old data has given scientists more insight into the Moon's core. Credit: Science

[/caption]

A new look at data from seismic experiments left on the Moon by Apollo astronauts has given researchers a better understanding of the lunar interior. The Moon’s core appears to be very similar to the Earth’s — with a solid inner core and molten liquid outer core — and its size is right in the middle of previous estimates.

“While the presence of a liquid core had previously been inferred from other geophysical measurements, we have made the first direct seismic observation of a liquid outer core,” said Dr. Renee Weber, a planetary scientist at NASA’s Marshall Space Flight Center, who led the team of researchers.

Apollo Passive Seismic Experiment from Apollo 15. Credit: NASA

The Apollo Passive Seismic Experiment measured seismic waves on the Moon and consisted of four seismometers deployed on the lunar near side during the Apollo missions between 1969 and 1972. The instruments continuously recorded ground motion until late-1977. But the data was thought to be rather weak because of the small number of stations, the lack of observation of far-side events, and interference from “moon quakes.” As this was the only direct measurements from the Moon available, various researchers differed on key characteristics such as the core’s radius, composition, and state (i.e., whether it was solid or molten.)

“The moon’s deepest interior, especially whether or not it has a core, has been a blind spot for seismologists,” said Ed Garnero, a professor at Arizona State University and a member of the research team. “The seismic data from the old Apollo missions were too noisy to image the moon with any confidence.”

Weber and her colleagues re-analyzed the Apollo data using a method usually used for processing seismic data on Earth. Called array processing, seismic recordings are added together or “stacked” in a special way and studied together. The multiple recordings processed together allow researchers to extract very faint signals. The depth of layers that reflect seismic energy can be identified, ultimately signifying the composition and state of matter at varying depths.

This method can enhance faint, hard-to-detect seismic signals by adding seismograms together.

“If seismic wave energy goes down and bounces off of some deep interface at a particular depth, like the Moon’s core-mantle boundary, then that signal “echo” should be present in all the recordings, even if below the background noise level,” said Patty Lin, a postdoctoral candidate at ASU and another member of the team. “But when we add the signals together, that core reflection amplitude becomes visible, which lets us map the deep Moon.”

Weber told Universe Today that the shear waves do not penetrate fluid regions. “So while we have observed compression reflections off the solid inner core, we have not (as expected) observed shear reflections off the inner core, since that energy is reflected at the outer core layer.”

Recent studies suggested the Moon had a relatively small iron-rich core, sized between about 250 and 430 km, or roughly 15 to 25% of its 1,737.1 km mean radius. The new measurements put the core slightly larger.
“We have placed the core-mantle boundary at a radius of 330 km, roughly 19% of the Moon’s mean radius,” Weber said in an email.

The iron-rich core has a solid inner ball nearly 240 km (150 miles) in radius, and an 90 km (55-mile) thick outer fluid shell.

The new research also points to volatile-depleted interior, with the lunar core containing a small percentage of light elements such as sulfur, similar to light elements in Earth’s core – sulfur, oxygen and others.

The retooled 30-year-old data also appears to confirm the the leading theory of how the Moon formed.

“The presence of a melt layer and a molten outer core supports the widely-accepted large-impact model of lunar formation, which predicts that the Moon could have formed in a completely molten state,” Weber said.

Map of Future Lunar Landing Sites

MOon.thumbnail.jpg
Google Lunar X PRIZE proposed landing sites. Copyright 2011 Phillip J. Stooke and Evadot.com. Used by permission.

Here’s the map of the future: a look where all the contestants in the Google Lunar X PRIZE intend to land on the Moon, in hopes of nabbing the $30 million in prizes available to the first privately funded teams to safely land a robot on the surface of the Moon. Dr. Philip J. Stooke of The University of Western Ontario has put together a this very nifty proposed landing site map based on published data from the Google Lunar X PRIZE Teams. According to Michael Doornbos from the Evadot website, assisting in the visualization, they will be updating the map regularly as the public information gets updated. Click on the image to see the original (and larger version) on Evadot.com

If you remember, the participants in the Google Lunar X PRIZE not only have to land their robot, but it also has to travel 500 meters over the lunar surface and send images and data back to the Earth. Teams must be at least 90% privately funded. The GLXP hopes to ignite a new era of lunar exploration by offering this largest international incentive prize of all time.

Find out more at The Google Lunar X PRIZE Website

Great View! January 4 Solar Eclipse As Seen From Space

Here’s a unique view of the January 4 partial solar eclipse: ESA’s sun-watching microsatellite Proba-2 captured the conjunction of the spheres as the Sun, Moon and Earth all lined up in front of it. Shortly after the Moon partially blocked Proba-2’s view of the Sun, the satellite flew into Earth’s shadow. At that point – when the video seen here goes dark – the Sun, Moon, Earth and Proba-2 were all on the same line in space.

“This is a notable event,” said Bogdan Nicula of the Royal Observatory of Belgium (ROB), who calculated where and when this double-eclipse would happen. “It is a nice exercise to model the orbit and relative positions of all three celestial bodies.”
Continue reading “Great View! January 4 Solar Eclipse As Seen From Space”

Shedding New Light on the Cosmic Dark Ages

Representation of the timeline of the universe over 13.7 billion years, and the expansion in the universe that followed. Credit: NASA/WMAP Science Team.

[/caption]

From a University of Cambridge press release:

Remnants of the first stars have helped astronomers get closer to unlocking the “dark ages” of the cosmos. A team of researchers from the University of Cambridge and California Institute of Technology are using light emitted from massive black holes called quasars to “light up” gases released by the early stars, which exploded billions of years ago. As a result, they have found what they refer to as the missing link in the evolution of the chemical universe.

The first stars are believed to hold the key to one of the mysteries of the early cosmos: how it evolved from being predominantly filled with hydrogen and helium to a universe rich in heavier elements, such as oxygen, carbon and iron.

However, although telescopes can detect light reaching Earth from billions of light-years away, enabling astronomers to look back in time over almost all of the 13.7-billion-year history of the universe, one observational frontier remains: the so-called “dark ages.” This period, lasting half a billion years after the Big Bang, ended when the first stars were born and is inaccessible to telescopes because the clouds of gas that filled the universe were not transparent to visible and infrared light.

“We have effectively been able to peer into the dark ages using the light emitted from a quasar in a distant galaxy billions of years ago. The light provides a backdrop against which any gas cloud in its path can be measured,” said Professor Max Pettini at Cambridge’s Institute of Astronomy (IoA), who led the research with PhD student Ryan Cooke.

Taking precision measurements using the world’s largest telescopes in Hawaii and Chile, the researchers have used Quasar Absorption Line Spectroscopy to identify gas clouds called ‘damped Lyman alpha systems’ (DLAs). Among the thousands of DLAs known, the team have succeeded in finding a rare cloud released from a star very early in the history of the universe.

“As judged by its composition, the gas is a remnant of a star that exploded as much as 13 billion years ago,” Pettini explained. “It provides the first analysis of the interior of one of the universe’s earliest stars.”

The results provide experimental observations of a time that has so far been possible to model only with computers simulations, and will help astronomers to fill gaps in understanding how the chemical universe evolved.

“We discovered tiny amounts of elements present in the cloud in proportions that are very different from their relative proportions in normal stars today. Most significantly, the ratio of carbon to iron is 35 times greater than measured in the Sun,” Pettini said. “The composition enables us to infer that the gas was released by a star 25 times more massive than the Sun and originally consisting of only hydrogen and helium. In effect this is a fossil record that provides us with a missing link back to the early universe.”

The study was published in Monthly Notices of the Royal Astronomical Society by Ryan Cooke, Max Pettini and Regina Jorgenson at the IoA, together with Charles Steidel and Gwen Rudie at the California Institute of Technology in Pasadena.

JAXA Considering Second Try at Akatsuki-Venus Rendezvous One Year Earlier than Planned

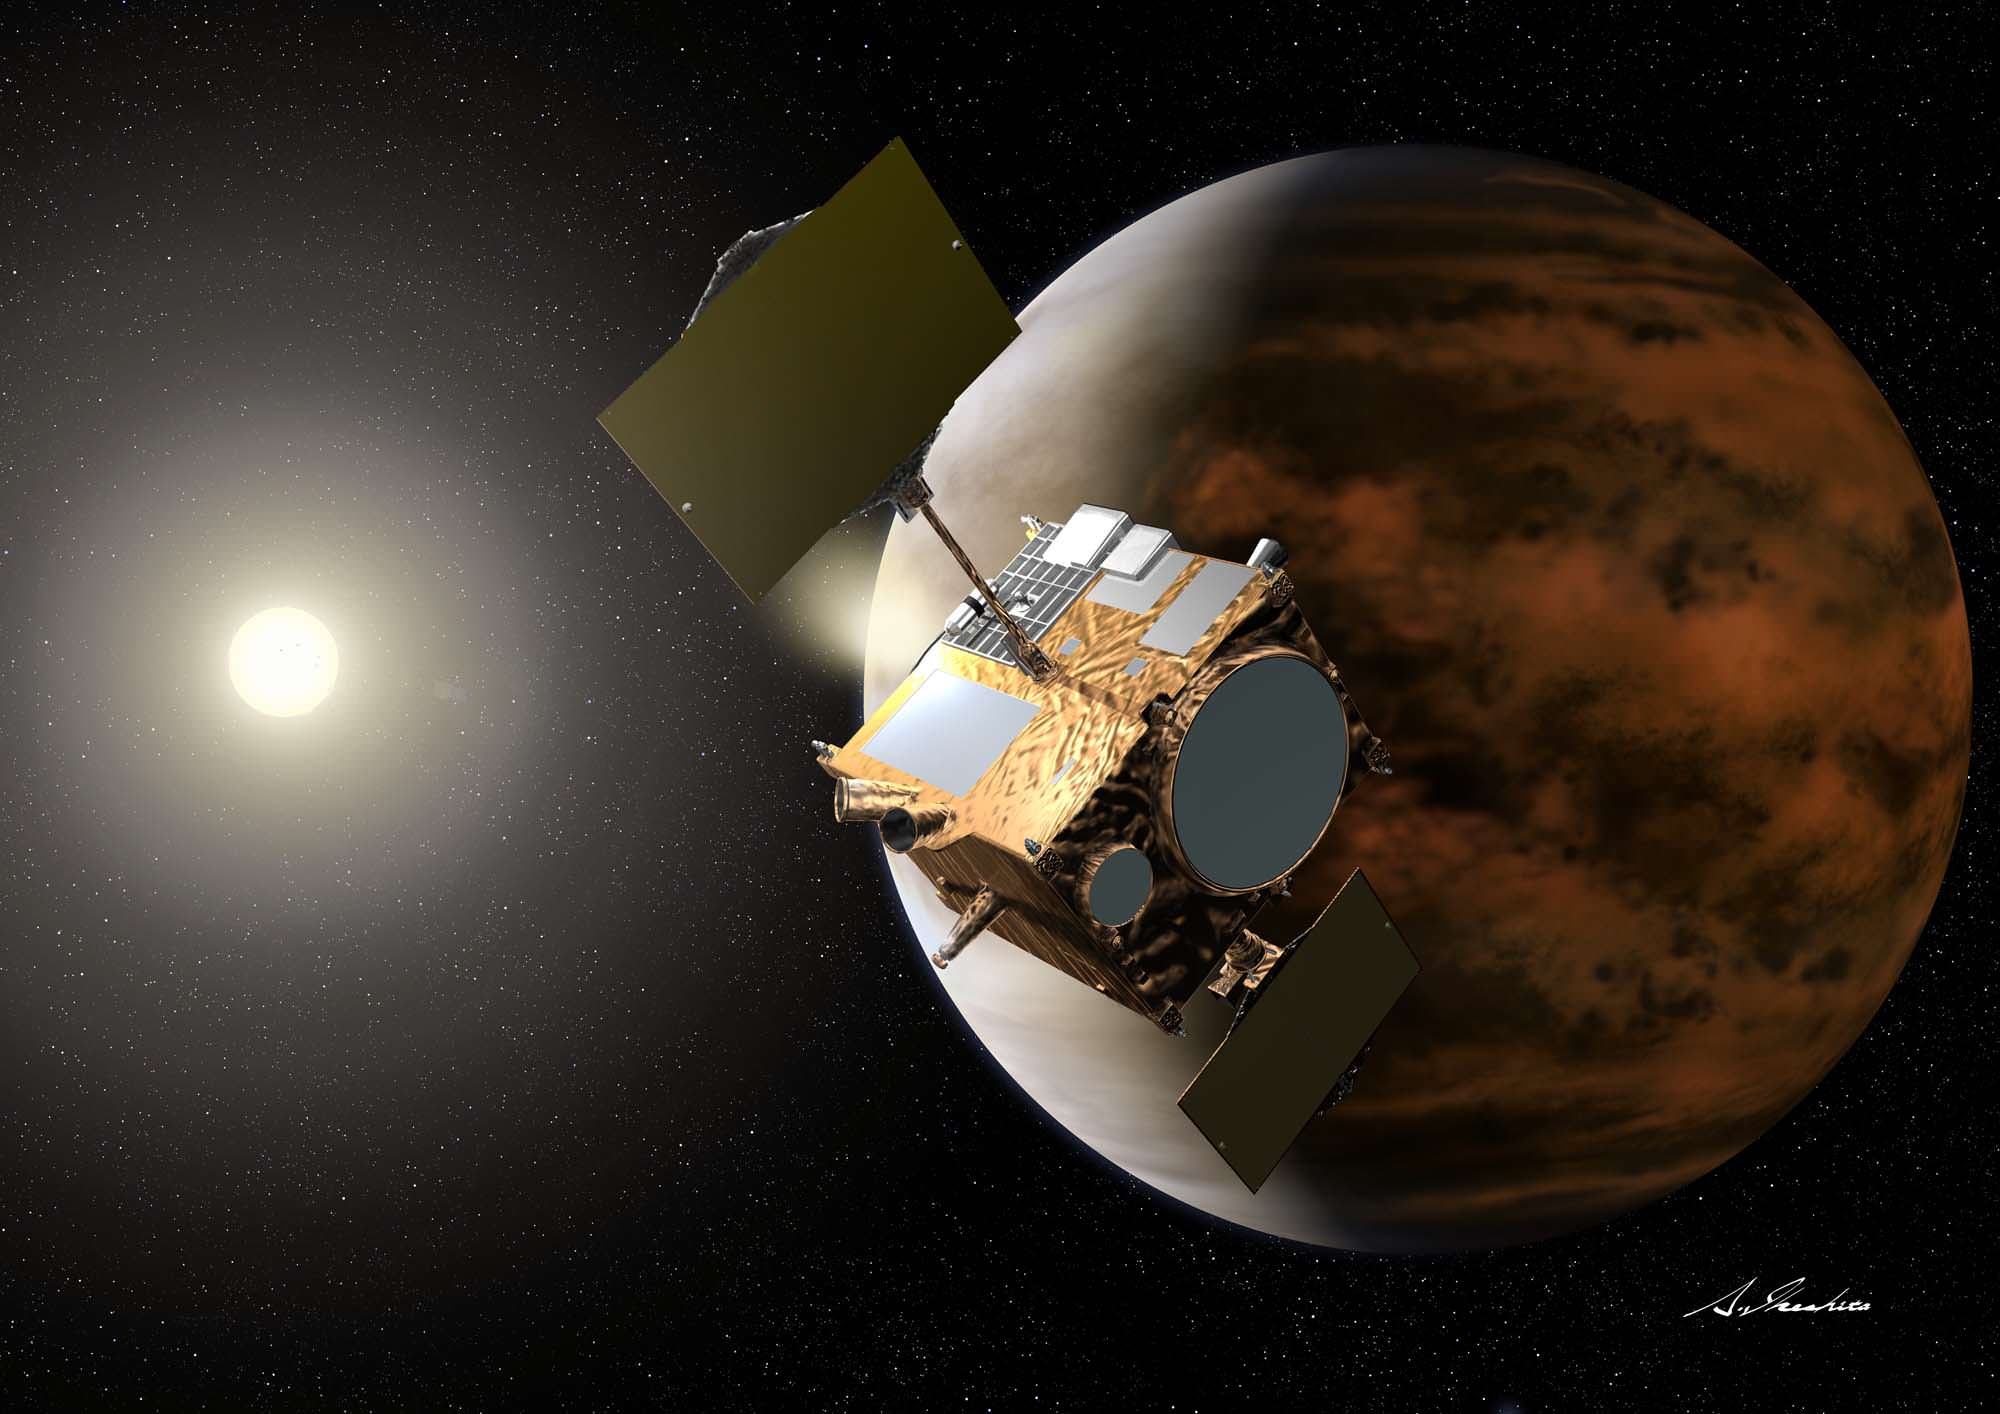
Artist’s impression of the Venus Climate Orbiter (aka. “Akatsuki”) by Akihiro Ikeshita. Image Credit: JAXA

The Japan Aerospace Exploration Agency (JAXA) is now considering making a second attempt to insert the Akatsuki probe into Venus’ orbit one year earlier than originally planned, in five years instead of six. After a malfunctioning valve in the spacecraft’s fuel pressure system caused the engine to function abnormally, Akatsuki failed to enter Venus’ orbit on Dec. 7, 2010 as planned. JAXA had said the spacecraft’s orbit around the Sun would put it in position for another orbit insertion attempt in about six years. But because the spacecraft’s speed has slowed more than expected, the agency now says it may be possible to slowly decelerate Akatsuki even more and let Venus “catch up with it,” according to a report in the Mainichi Daily News. Therefore, an attempt to enter orbit may be made sometime in 2015. A quicker return to Venus is also advantageous in terms of the lifespan of the probe and its equipment.

“At the speed the probe was moving under our first retry plan, it would probably have been impossible to make the orbital insertion,” said a JAXA official, quoted in the Japanese online news site. “We hope to explore every possibility, and make an exploration of Venus a reality.”

After the original mission failure, JAXA had calculated that Akatsuki would make 11 trips around the Sun for every 10 Venus made, putting the next closest encounter between the spacecraft and planet sometime in December 2016 or January 2017. But subsequent examination of data showed Ataksuki’s engine power had dropped by almost 60 percent, slowing the spacecraft and making it possible to make a second attempt at entering orbit a year earlier. The bad news is that the slowdown is possibly caused by a malfunction in the fuel supply system or damage to the engine nozzle. If that is the case, the prospects for restoring full function are very low.

Additionally, if the engine nozzle has been weakened, it will be difficult to decelerate the Akatsuki enough for orbital insertion when it again closes with Venus. But after consultations with engineers, JAXA is now considering trying to decelerate the craft a little bit at a time, allowing it to make eight orbits around the sun before Venus catches up with it in five years.

Source: The Daily Mainichi News