[/caption]
Unraveling the mystery of Gamma Ray Bursts (GRBs) is a story filled with international intrigue, fantastic claims, serious back-tracking, and incremental improvements in our understanding of the true nature and implications of the most energetic, destructive forces in the Universe. New results from a team of scientists studying so-called “dark gamma-ray bursts” have firmly snapped a new piece into the GRB puzzle. This research is presented in a paper to appear in the journal Astronomy & Astrophysics on December 16, 2010.
The discovery of GRBs was an unexpected result of the American space program and the military keeping tabs on the Russians to verify compliance with a cold war nuclear test ban treaty. In order to be sure the Russians weren’t detonating nuclear weapons on the far side of the Moon, the 1960’s era Vela spacecraft were equipped with gamma ray detectors. The Moon might shield the obvious signature of x-rays from the far side, but gamma rays would penetrate right through the Moon and would be detectible by the Vela satellites.
By 1965, it became apparent that events which triggered the detectors but were clearly not signatures of nuclear detonations, so they were carefully, and secretly, filed away for future study. In 1972, astronomers were able to deduce the directions to the events with sufficient accuracy to rule out the Sun and Earth as sources. They came to the conclusion that these gamma-ray events were “of cosmic origin”. In 1973, this discovery was announced in the Astrophysical Journal.
This created quite stir in the astronomical community and dozens of papers on GRBs and their causes began appearing in the literature. Initially, most hypothesized the origin of these events came from within our own galaxy. Progress was painfully slow until the 1991 launch of the Compton Gamma Ray Observatory. This satellite provided crucial data indicating that the distribution of GRBs is not biased towards any particular direction in space, such as toward the galactic plane or the center of the Milky Way Galaxy. GRBs came from everywhere all around us. They are “cosmic” in origin. This was a big step in the right direction, but created more questions.
For decades, astronomers searched for a counterpart, any astronomical object coincident with a recently observed burst. But the lack of precision in the location of GRBs by the instruments of the day frustrated attempts to pin down the sources of these cosmic explosions. In 1997, BeppoSAX detected a GRB in x-rays shortly after an event and the optical after glow was detected 20 hours later by the William Herschel Telescope. Deep imaging was able to identify a faint, distant galaxy as the host of the GRB. Within a year the argument over the distances to GRBs was over. GRBs occur in extremely distant galaxies. Their association with supernovae and the deaths of very massive stars also gave clues to the nature of the systems that produce GRBs.
It wasn’t too long before the race to identify optical afterglows of GRBs heated up and new satellites helped pinpoint the locations of these after glows and their host galaxies. The Swift satellite, launched in 2004, is equipped with a very sensitive gamma ray detector as well as X-ray and optical telescopes, which can be rapidly slewed to observe afterglow emissions automatically following a burst, as well as send notification to a network of telescopes on the ground for quick follow up observations.
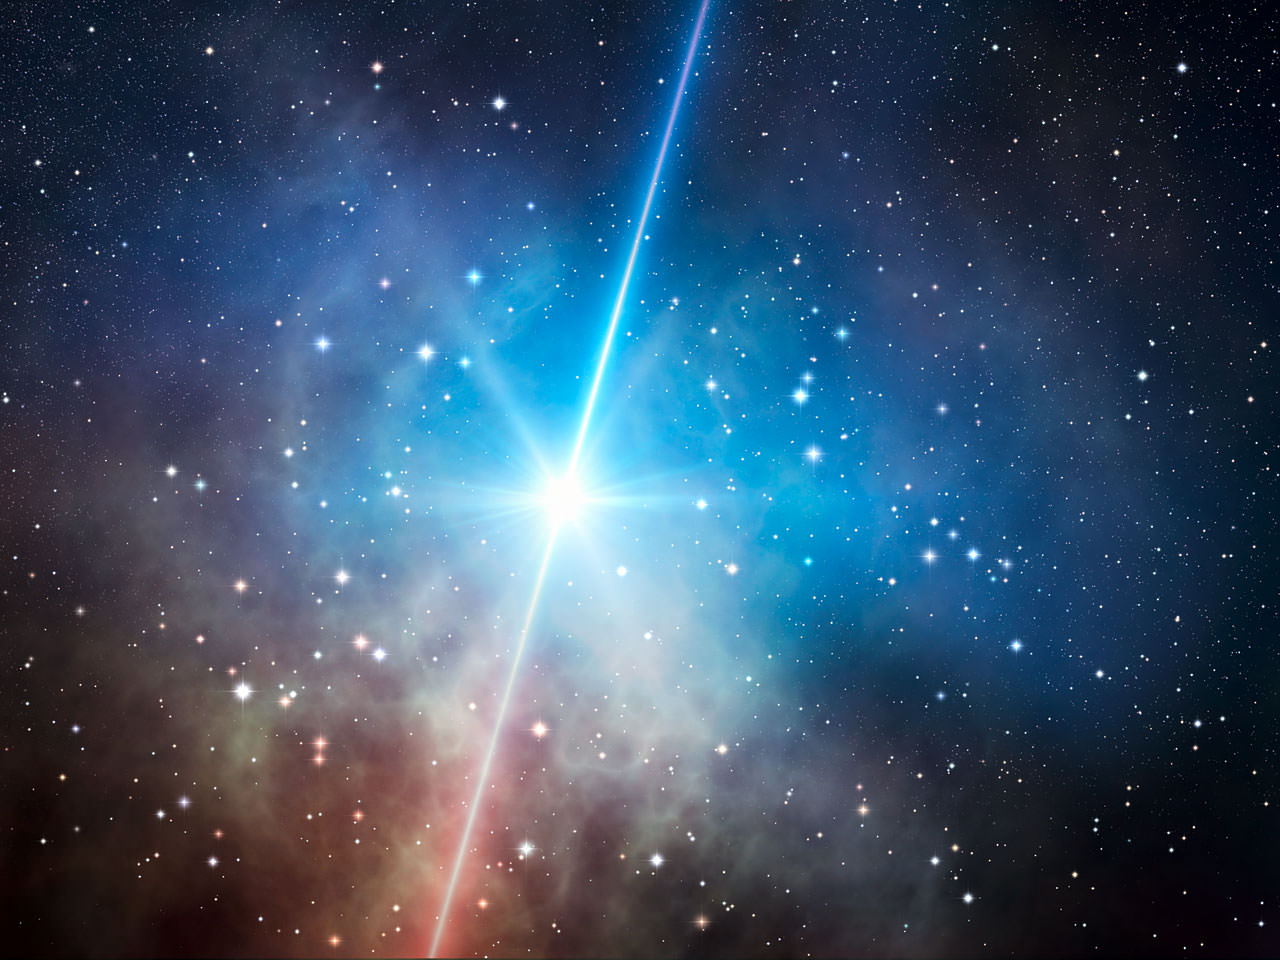
Today, astronomers recognize two classifications of GRBs, long duration events and short duration events. Short gamma-ray bursts are likely due to merging neutron stars and not associated with supernovae. Long-duration gamma-ray bursts (GRBs) are critical in understanding the physics of GRB explosions, the impact of GRBs on their surroundings, as well as the implications of GRBs on early star formation and the history and fate of the Universe.
While X-ray afterglows are usually detected for each GRB, some still refused to give up their optical afterglow. Originally, those GRBs with X-ray but without optical afterglows were coined “dark GRBs”. The definition of “dark gamma-ray burst” has been refined, by adding a time and brightness limit, and by calculating the total output of energy of the GRB.
This lack of an optical signature could have several origins. The afterglow could have an intrinsically low luminosity. In other words, there may just be bright GRBs and faint ones. Or the optical energy could be strongly absorbed by intervening material, either locally around the GRB or along the line-of-sight through the host galaxy. Another possibility is that the light could be at such a high redshift that blanketing and absorption by the intergalactic medium would prohibit detection in the R band frequently used to make these detections.
In the new study, astronomers combined Swift data with new observations made using GROND, a dedicated GRB follow-up instrument attached to the 2.2-metre MPG/ESO telescope at La Silla in Chile. GROND is an exceptional tool for the study of GRB afterglows. It can observe a burst within minutes of an alert coming from Swift, and it has the ability to observe through seven filters simultaneously, covering the visible and near-infrared parts of the spectrum.
By combining GROND data taken through these seven filters with Swift observations, astronomers were able to accurately determine the amount of light emitted by the afterglow at widely differing wavelengths, all the way from high energy X-rays to the near-infrared. They then used this data to directly measure the amount of obscuring dust between the GRB and observers on Earth. Thankfully, the team has found that dark GRBs don’t require exotic explanations.
What they found is that a significant proportion of bursts are dimmed to about 60–80 percent of their original intensity by obscuring dust. This effect is exaggerated for the very distant bursts, letting the observer see only 30–50 percent of the light. By proving this to be so, these astronomers have conclusively solved the puzzle of the missing optical afterglows. Dark gamma-ray bursts are simply those that have had their visible light completely stripped away before it reaches us.


.")