The International Space Station in 2010. Credit: NASA
[/caption]
With the life of the International Space Station extended to at least 2020, we don’t have to think about its demise for awhile. But actually, NASA and the international partners do have to think about and plan ahead for how this huge 400-ton structure in space will one day be deorbited and disposed of. Friend and venerable space writer Leonard David has written an article about how NASA is starting to consider how they will organize and execute “dumping the huge facility into select, but remote, ocean waters in one fell swoop.” It ain’t gonna be easy, and that’s why thorough planning is a must. It might take a combination of vehicles (ESA’s ATV, Russian Progess) to send the ISS on a very safe and precise swan dive. Or, another possibility is that some of the modules could be re-used elsewhere.
Our Sun can be a menace when it sends out powerful solar blasts of radiation towards the Earth. Astronomers keenly watch the Sun to learn more about what powers these solar eruptions, in hopes of being able to predict them. New research shows that one-third of the Sun’s blasts are “sneak attacks” that may occur without warning.
“If space weather forecasters rely on some of the traditional danger signs, they’ll miss a significant fraction of solar eruptions,” said Suli Ma of the Harvard-Smithsonian Center for Astrophysics (CfA).
To reach their conclusion, Ma and her colleagues studied 34 solar eruptions over 8 months using the STEREO spacecraft. STEREO allows us to study the Sun from two different angles simultaneously. It consists of two spacecraft, one ahead of Earth in its orbit and the other trailing behind. The researchers used it to ensure that the events leaving the Sun were definitely on the side facing the Earth.
STEREO is ideal for studying coronal mass ejections, or CMEs. A CME is a huge eruption from the Sun that blasts a billion tons of highly charged particles into space at speeds greater than a million miles per hour. When those charged particles reach Earth, they interact with our planet’s magnetic field, potentially creating a geomagnetic storm. Such a storm can interfere with satellite communications, disrupt power grids, or even short out orbiting satellites.
Previous to STEREO, astronomers thought that all Earth-facing CMEs were accompanied by warning signals like flares (smaller explosions accompanied by high-energy radiation), coronal dimmings (darkening of the corona caused by discharge of matter in the CME) or filament eruptions (long ribbons of plasma arching violently out from the solar surface). Therefore, by watching for those signals, we could potentially predict an impending eruption.
This new research found that 11 of the 34 CMEs observed by STEREO were “stealthy,” showing none of the usual signals. As a result, any system designed to watch for such warning signs could miss one-third of all solar blasts.
“Meteorologists can give days of warning for a hurricane, but only minutes for a tornado,” explained Smithsonian astronomer Leon Golub. “Currently, space weather forecasting is more like tornado warnings. We might know an eruption is imminent, but we can’t say exactly when it will happen. And sometimes, they catch us by surprise.”
The team plans to continue looking for subtle clues that might allow us to predict an impending “stealth” CME. They caution that their study occurred during a prolonged minimum of solar activity; conditions may change as solar activity increases over the next few years.
“The Sun is entering its stormy season, ramping up toward its next period of maximum activity in 2013 and 2014,” said Ma. “The more we learn and understand about it now, the better.”
The paper discussing their findings appeared in the Oct. 10, 2010 issue of The Astrophysical Journal. It was authored by Suli Ma, G. Attrill, and Leon Golub (CfA); and J. Lin (Chinese Academy of Sciences).
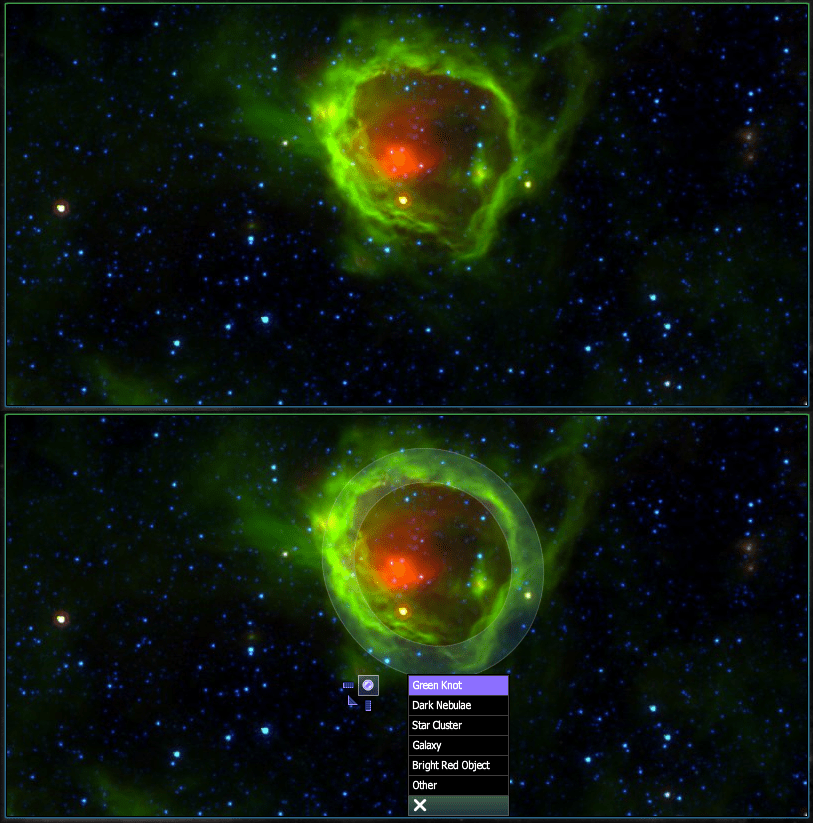
The Milky Way Project allows anyone to help catalog bubbles and other interesting features in images taken from a robotic infrared survey. Image Credit: Spitzer/The Milky Way Project
[/caption]
From the folks that brought you the addictive citizen science projects Galaxy Zoo and Moon Zoo (among others), comes yet another way to explore our Universe and help out scientists at the same time. The Milky Way Project invites members of the public to look at images from infrared surveys of our Milky Way and flag features such as gas bubbles, knots of gas and dust and star clusters.
As with the other Zooniverse projects, the participation of the public is a core feature. Accompanying the Milky Way Project is a way for Zooniverse members – lovingly called “zooites” – to discuss the images they’ve cataloged. Called Milky Way Talk, users can submit images they find curious or just plain beautiful to the talk forum for discussion.
The Milky Way Project uses data from the Galactic Legacy Infrared Mid-Plane Survey Extraordinaire (GLIMPSE) and the Multiband Imaging Photometer for Spitzer Galactic Plane Survey (MIPSGAL). These two surveys have imaged the Milky Way in infrared light at different frequencies. GLIMPSE at 3.6, 4.5, 5.8, and 8 microns, and MIPSGAL at 24 and 70 microns. In the infrared, things that don’t emit much visible light – such as large gas clouds excited by stellar radiation – are apparent in images.
The new project aims at cataloging bubbles, star clusters, knots of gas and dark nebulae. All of these objects are interesting in their own ways.
Bubbles – large structures of gas in the galactic plane – belie areas where young stars are altering the interstellar medium that surrounds them. They heat up the dust and/or ionize the gas that surrounds them, and the flow of particles from the star pushes the diffuse material surrounding out into bubble shapes.
The green knots are where the gas and dust are more dense, and might be regions that contain stellar nurseries. Similarly, dark nebulae – nebulae that appear darker than the surrounding gas – are of interest to astronomers because they may also point to stellar formation of high-mass stars.
Star clusters and galaxies outside of the Milky Way may also be visible in some of the images. Though the cataloging of these objects isn’t the main focus of the project, zooites can flag them in the images for later discussion. Just like in the other Zooniverse projects, which use data from robotic surveys, there is always the chance that you will be the first person ever to look at something in one of the images. You could even be like Galaxy Zoo member Hanny and discover something that astronomers will spend telescope time looking at! This image is full of objects that are interesting to astronomers for study. You can help them pick out which things to study. Image Credit: Spitzer/The Milky Way Project
The GLIMPSE-MIPSGAL surveys were performed by the Spitzer Space Telescope. Over 440,000 images – all taken in the infrared – are in the catalog and need to be sifted through. This is a serious undertaking, one that cannot be accomplished by graduate students in astronomy alone.
In cataloging these bubbles for subsequent analysis, Milky Way Project members can help astronomers understand both the interstellar medium and the stars themselves imaged by the survey. It will also help them to make a map of the Milky Way’s stellar formation regions.
As with the other Zooniverse projects, this newest addition relies on the human brain’s ability to pick out patterns. Diffuse or oddly-shaped bubbles – such as those that appear “popped” or are elliptical – are difficult for a computer to analyze. So, it’s up to willing members of the public to help out the astronomy community. The Zooniverse community boasts over 350,000 members participating in their various projects.
A little cataloging and research of these gas bubbles has already been done by researchers. The Milky Way Project site references work by Churchwell, et. al, who cataloged over 600 of the bubbles and discovered that 75% of the bubbles they looked at were created by type B4-B9 stars, while 0-B3 stars make up the remainder (for more on what these stellar types mean, click here).
A zoomable map that uses images from the surveys – and has labeled a lot of the bubbles that have been already cataloged by the researchers- is available at Alien Earths.
For an extensive treatment of just how important these bubbles are to understanding stars and their formation, the paper “IR Dust Bubbles: Probing the Detailed Structure and Young Massive Stellar Populations of Galactic HII Regions” by Watson, et. al is available here.
If you want to get cracking on drawing bubbles and cataloging interesting features of our Milky Way, take the tutorial and sign up today.
The White House is looking into ways to reduce the number of astronauts employed by the U.S. Image Credit: NASA
[/caption]
CAPE CANAVERAL – When we think of NASA, the first thing that most Americans picture is the men and women of the astronaut corps. It turns out that the White House has been thinking about them as well – as maybe something that might need to be cut down. The Obama administration has requested a 10-month long study be held to determine the appropriate ‘size’ of NASA’s astronaut corps.
There are only two (and a potential third) shuttle flights remaining on the current manifest.
Right now, NASA has 64 astronauts, which some might consider a bit much if very few will be flying to space. However, if three NASA astronauts are part of each 6-member, 6-month Expedition on the International Space Station from 2011-2017 (the projected time period when NASA will be unable to launch their own astronauts) that still is 36 astronauts with a mission to space.
But the proposal to cut NASA’s astronaut corps comes on the heels of numerous successive cuts that the space agency has endured over the past year. Many view the loss of the corps as one more blow to both spaceflight experience as well as national prestige.
The White House hopes that commercial space companies such as SpaceX, which is slated to launch the second of its Falcon 9 rockets sometime this week, will emerge to fill the void created by NASA’s absence. However, to date, none of these firms have launched an astronaut into orbit. During the interim, and until NASA can build its own heavy lift vehicle, the US space agency is relying on — and paying — the Russians to bring US astronauts to the ISS via the Soyuz.
There has never been more than 150 astronauts at any given time (the most ever was 149 back in 2000). Although most Americans assume that NASA has a massive budget, for what the agency does and provides, it is incredibly small, about one-seventh of a penny out of every tax dollar helps to pay for the ISS, the shuttle program, the probes and rovers to the planets and the astronaut’s salaries. The agency’s budget is currently $18.7 billion a year. The 47 civilian astronauts earn between $65,000 and $100,000 annually, with the remaining military astronauts being paid through the Department of Defense (DoD) which NASA reimburses.
The National Academies is the organization that will conduct the review of the astronaut corps and they are leaving no stone unturned, even the T-38 ‘Talon’ jets that the astronauts fly in, are coming under scrutiny. These jets are not state-of-the-art fighters, but rather training aircraft that date back to the beginning of the space age. These planes, equipment and facilities used to train astronauts and the current number of astronauts will all be reviewed.
“I still don’t know how many folks are in the queue and were not selected for shuttle, ” said two-time shuttle astronaut Robert Springer. “If you are in the program and there is little or no chance to fly in the next 4-8 years that’s too bad, but it’s not the first time this has happened, and if you like the environment, working with some of the greatest people in the business, it can lead to challenging working on the next great enterprise.”
But some have a different idea of how NASA could cut costs.
“You know, if Obama really wanted to cut waste at NASA – he’d start with headquarters,” said a long-time NASA employee who requested to remain anonymous for fear of retribution. “That place is stocked with GS-15s – who really don’t do much of anything!” He said referring to the government pay grade of many of the high-level officials that work at NASA’s headquarters in Washington D.C.
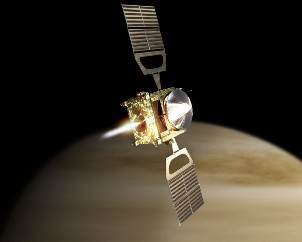
Artists concept of Japan’s Akatsuki spacecraft at Venus. Credit: JAXA
[/caption]
Japan’s first Venus space probe encountered problems while attempting orbit insertion and went into safe mode. It took longer than expected (an hour and a half) to regain communications after a known 22 minute blackout with the Akatsuki spacecraft, and apparently controllers are still trying to ascertain the spacecraft’s orbit. From translated Twitter reports and a document posted on the JAXA website, it appears engineers confirmed ignition of the thruster before Akatsuki moved behind Venus, but had trouble pinpointing the spacecraft after the blackout should have ended. They have regained some radio communications.
“It is not known which path the probe is following at the moment,” a JAXA official Munetaka Ueno told reporters at the ground control late Tuesday, according to AFP. “We are making maximum effort to readjust the probe.”
“The communication situation analysis has been confirmed that the spacecraft into safe hold mode,” says a translated document. “It is conducted to ensure continued operation of the information obtained at an early state of the spacecraft and orbital …stable spin probe to capture the sun.”
[/caption]
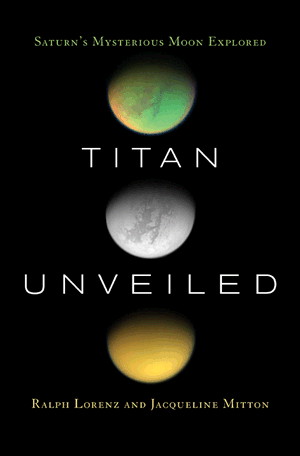
Take a layer off a Matryoshka doll and you find more of the same. Try to answer questions about a mysterious satellite of Saturn and more questions come bubbling up to the surface. Ralph Lorenz and Jacqueline Mitton in their book “Titan Unveiled – Saturn’s Mysterious Moon Explored” treat the reader to this common scientific dilemma. In it, we see that the recent Cassini-Huygens mission gave us many answers to many questions but leaves a whole lot more just awaiting.
The tiny moon Titan orbits its giant mother planet Saturn. Our distant Sun shines so dimly at its distance that it can have no appreciable effect. But, some unidentified source of energy effects Titan’s surface. We know this because of the spectacular terrain that’s eerily evocative of Earth. Coastlines, volcanic mounts and great sand dunes appear to grace every view. This apparently dynamic surface may lead to other terrestrial similarities and may point to terrestrial analogues. This potential gave rise to the mission to Saturn and, in its own way, to this book.
This book has three intermingling tracts: Titan and its physical details, the Cassini-Huygens mission, and an author’s personal travails with the mission and space exploration. The Titan tract includes a review of the growth of knowledge regarding this moon. Particularly, there’s concepts drawn from the Voyageur probes as well as space based and land based telescopes. These include the magnetosphere, atmosphere and surface reflectivity. The accumulated knowledge is shown to be a necessary precursor to the mission and in particular to the Huygens lander.
The second tract looks at the Cassin-Huygens mission, its history, funding, scientific payload and initial arrival at the Saturn system. The writing is current to about July 2006, or Cassini orbit T16. Though the book has some well-known detail, such as the scientific payload, for the most part it looks at the processes, whether the need for continual political support, constant adaptation to modifications and the need for patience during the long flight out. These are interesting but don’t really pertain to the unveiling of Titan.
Sections that have sub-titles such as “Ralph’s Log, August 1994” easily identify the third tract. These also seem out of place as they exhibit a more personal interest rather than a exposition of Titan. In the logs are descriptions of breaking into rooms, threading wires through instruments and traveling to conferences. While adding a distraction, they may or may not be to the reader’s liking.
These three tracts constitute the majority of the book and also exhibit the book’s main weakness. That is, rather than unveiling Titan to the average reader, it is a personal narrative regarding a personal interest. Further, by finishing the writing before the end of the Cassini-Huygens mission, the reader should wonder, “why now, what’s the rush, what’s been left out?” Also diminishing the book are the many but small images. Though some have fantastic shapes, such as one of the cat’s claws at the feature Shikoku, they’re usually quite small and don’t do justice to the concept of unveiling. Thus, though entertaining, the book never really unveils Titan in a succinct manner.
This book does excel as a personal narrative of a scientist’s involvement in one of our grandest research endeavours. Equally, it will well satisfy someone who’s interested in the background of the Cassini-Huygen mission and especially the early results from its view of Titan. But, I expect that those who want a greater amount of detail of Titan will need other, more academic sources to obtain a better reference.
We are only beginning to appreciate the many interdependent physical properties that exist on Earth. Yet, we see similarities wherever we look. The book “Titan Unveiled – Saturn’s Mysterious Moon Explored” by Ralph Lorenz and Jacqueline Mitton shows how advancing our knowledge of a distant satellite that orbits a distant planet has provided a special benefit to us on Earth.
Artists concept of Japan’s Akatsuki spacecraft at Venus. Credit: JAXA
[/caption]
Japan’s Akatsuki spacecraft will arrive at Venus later today, and will enter orbit around the planet. The box-shaped orbiter will make observations from an elliptical orbit, from a distance of between 300 and 80,000 kilometers (186 to 49,600 miles), looking for — among other things — signs of lightning and active volcanoes.
The Akatsuki probe (Japanese for “Dawn”) has been traveling for six months, and launched along with the IKAROS solar sail mission. The timing for the orbit insertion burn is Dec. 6 at about 6:50 p.m. EST (2350 GMT), which is early Tuesday morning Japan Standard Time.
Twitters can follow Akatsuki. (in Japanese — Google translate works well on the spacecraft’s Twitter homepage.)
This is Japan’s first mission to Venus. The Japanese Space Agency, JAXA, hopes the spacecraft will work for two years studying Venus’s clouds and weather in order to gain a better understanding of how the planet’s atmosphere evolves over time.
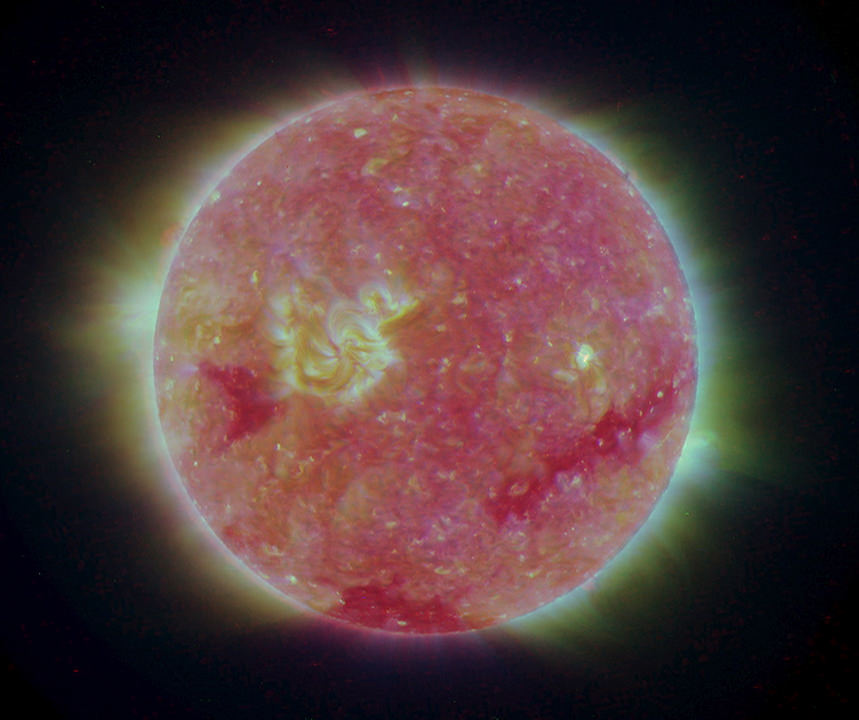
As of 18:49 UT, a gigantic solar prominence was visible to the Solar Dynamics Observatory in the ultraviolet spectrum. Image Credit: SDO
[/caption]
The Solar Dynamics Observatory never fails to deliver absolutely stunning images from the Sun: as of 18:49 UT today, the above picture is what the Sun looked like in the ultraviolet spectrum. The prominence that you are seeing looping off the Sun is estimated at over 700,000 km across, which is about the radius of the entire Sun. Amazing!
There’s nothing to worry about here on Earth, though – we are safe from such activity on the Sun, even if that prominence is big enough swallow up thousands of Earths. There is no coronal-mass ejection or flare to go along with this prominence, both phenomena on the Sun that can reach Earth and mess with satellites and our power grid.
As you can see (or rather, not see) in this visible light image below, the flare seems to only be visible in the ultraviolet. Other spectra of the Sun as imaged by the SDO are available here. Why is this? Phil Plait, the Bad Astronomer, explains it best:
“In visible light, the light from the extremely thin material in the prominence is totally overwhelmed by the intense emission from the Sun’s surface, and is invisible. It’s only when we filter out most of the Sun’s light (and let through light specifically given off by the plasma in the prominence) that we can see it at all,” he wrote. The Sun in the visible light spectrum, as seen from SDO at 18:00 UT. The two visible sunspots seem to be unrelated to this large prominence. Image Credit: SDO
This video shows the buildup up this most recent spectacular solar show, as this portion of the Sun comes into view from a 48-hour period between December 4th and 6th:
[UPDATE]: Here is a video that shows the prominence eruption as it expanded:
Spaceweather.com also has some other fantastic images that are linked to on their front page. Prominences like this can come crashing down quickly when they become unstable, so head over to the SDO site to watch the action as it develops!
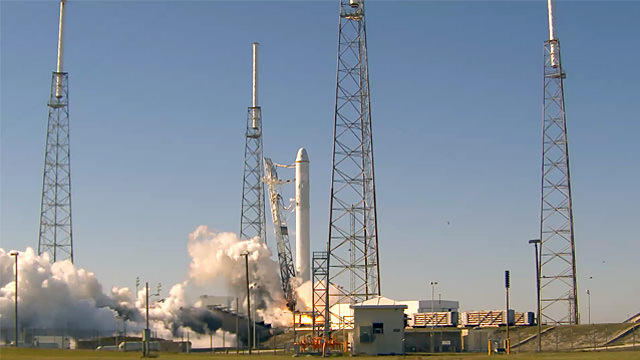
Success for SpaceX static test fire of Falcon 9. Credit: SpaceX
[/caption]
SpaceX will delay the launch attempt of the Falcon 9 rocket until at least Thursday, Dec. 9. At a press conference today, company president Gwynne Shotwell said a final review of closeout photos this morning found some indications of a potential issue on a second stage nozzle. Reports from journalist Robert Pearlman on Twitter said the Falcon 9 had been lowered from the vertical launch position. And Shotwell said if they have to replace the nozzle, the launch would be no earlier than Friday, Dec. 10.
“During an inspection of final closeout photos they determined there were some indications in a weld joint that they wanted to take some additional steps to look at,” said Shotwell, “and they brought the vehicle down to horizontal. I believe it is back up to vertical now.” When asked for details, Shotwell said “porosity and potential cracking in a weld joint.”
There were some weather concerns for the early to mid part of this week, but the weather improves later in the week, so perhaps the delay was going to happen anyway.
This is the first demonstration launch for NASA’s Commercial Orbital Transportation Services (COTS) program, with a functional Dragon capsule.
SpaceX CEO Elon Musk has said he thinks they have a 70% chance of successful first flight of the Falcon 9/Dragon capsule.
Shotwell agreed, saying history predicts SpaceX will likely have a substantial issue to deal with in this test flight.
“Given we got Falcon 9 to orbit on our first test flight, I’d say 70% for this flight, too,” she said.
At the press conference, NASA’s Phil McAlister, from the Office of Program Analysis and Evaluation, provided some insight into NASA’s thinking on if there were to be substantial problems with any of the COTS test flights. “We expect anomalies and the purpose of a test flight is to find the problems,” he said. “We won’t know until the end of the program if we’ve been completely successful, but to date this has been remarkably successful. Even if we have a bad day on this flight, for example, we expect to move forward. It is not a condition that every test flights be successful. We are committed to learn from each flight. But we would certainly like to have a a successful flight. So far we are on very good track and we will learn a lot from this test flight and move forward regardless of the outcome.”
The key milestones for this flight are a successful launch, separation of the Dragon vehicle from the rocket and successful reentry of Dragon.
No matter the outcome of this flight, SpaceX plans on having next Dragon flight ready by late spring/early summer 2011.
For the future, McAlister also said that he believe competition is very important, and that NASA would like to have at least 2 cargo service companies. “We would like to have routine, cost effective cargo services to LEO by 2020.”
Shotwell said it would be at least two and a half to three years after the cargo program is initiated is the first chance for astronauts to be ferried on board the Dragon capsule.
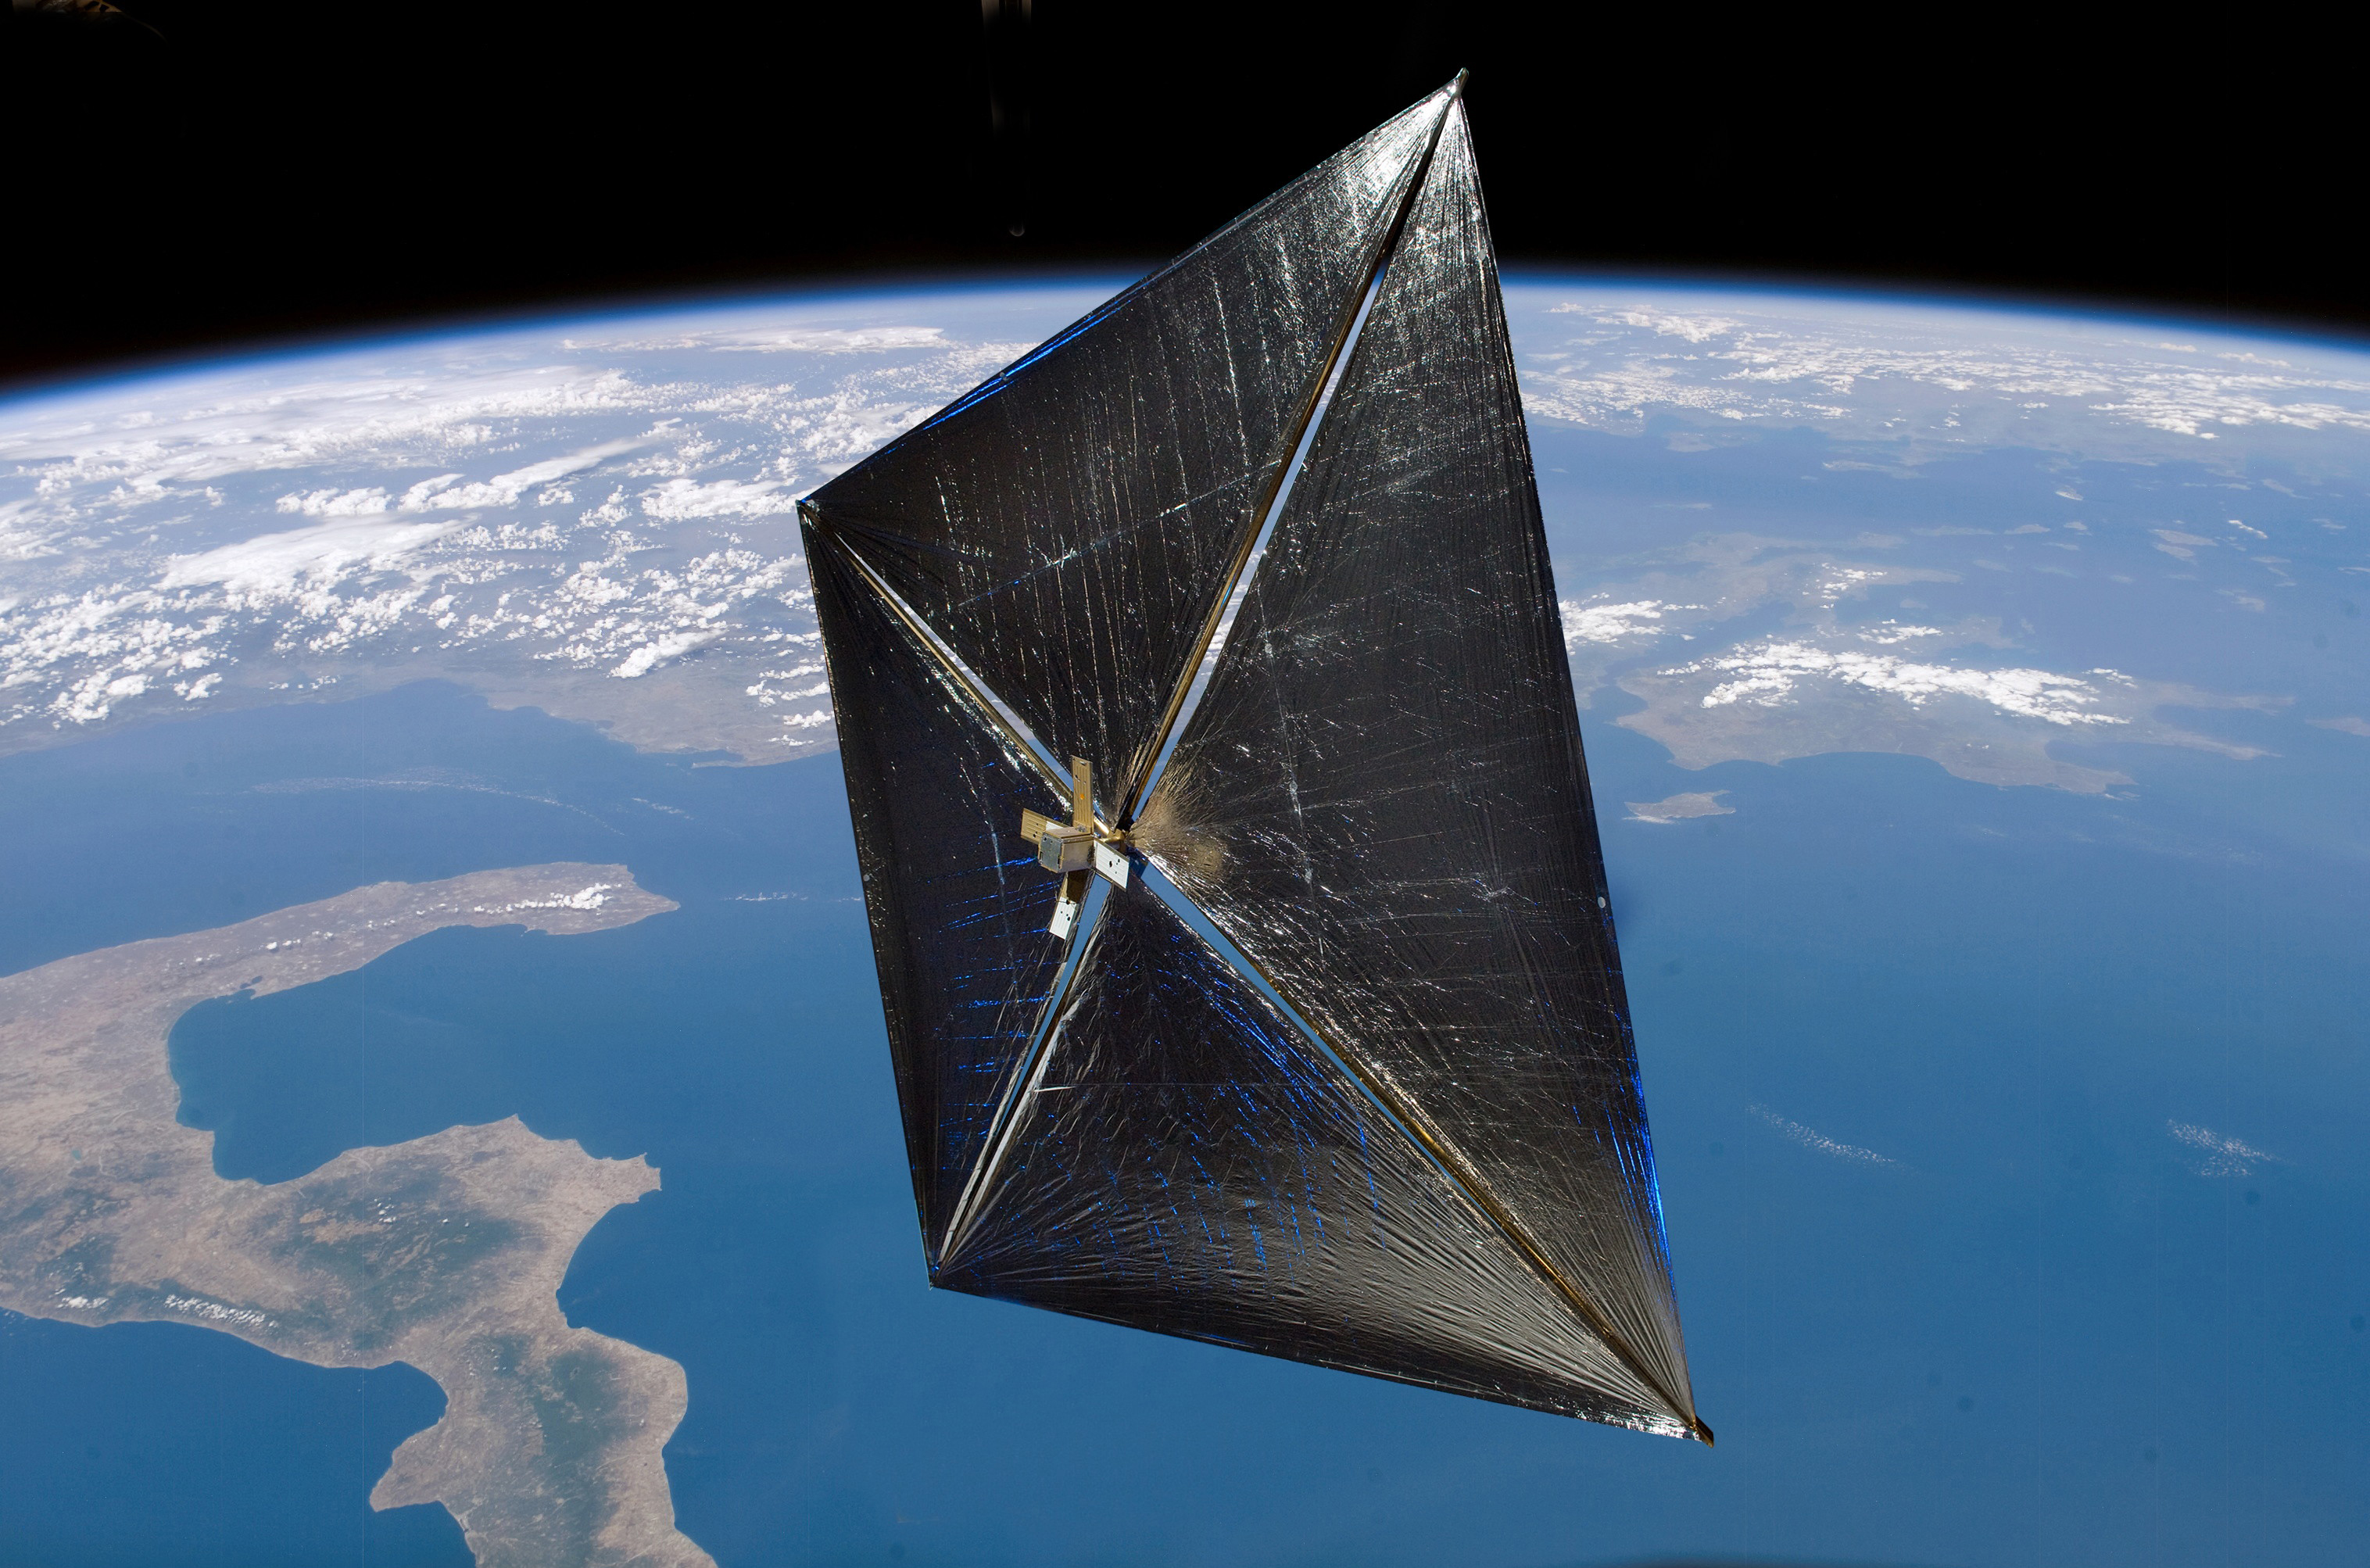
Artist concept of Nanosail-D in Earth orbit. Credit: NASA
[/caption]
Despite being an idea rattling around inside the head of engineers and space enthusiasts for over 40 years, solar sails have never really gained much traction in the way of actual deployment. Today, NASA has taken an important step towards testing solar sail technology for use in future spacecraft.
The Nanosail-D spacecraft was launched Friday, Nov. 19 at 8:25 p.m. EST from Kodiak Island, Alaska, and was piggybacking on another satellite, both aboard a Minotaur IV rocket. It has successfully been ejected from the launch vehicle as of today, and is on its own. Though the sails have yet to deploy, this is already an achievement that bodes well for the future of both solar sail and small satellite technology.
The Nanosail-D satellite – commonly described as “loaf of bread” sized – was ejected from the Fast, Affordable, Science and Technology Satellite (FASTSAT) at 1:31 a.m. EST December 6th. Not only is this NASA’s first attempt at deploying a solar sail in space, but this also marks the first time a nanosatellite has been ejected from another satellite, proving that this is a reliable way to get multiple satellites into orbit at the same time.
Nanosail-D is a nanosatellite – or cubesat – designed to test the potential for solar sails in atmospheric braking. Such sails – made from a an ultra-thin and light material, in this case the polymer CP1 – could potentially be used to propel a spacecraft outside of our Solar System. The Nanosail-D sail will be deployed in low-Earth orbit, about 650 km (400 miles) up. The sail will be used to show how such technology could slow down satellites when they need to de-orbit.
Currently, de-orbiting satellites involves maneuvering them into a lower and lower orbit using the engines of the satellite, which necessitates more propellant aboard the spacecraft simply to dispose of it properly. Nanosail-D will deploy a solar sail and orbit for 70-120 days, eventually spiraling into the Earth’s atmosphere to burn up.
Since it will be orbiting so close to the Earth, its potential for testing solar sails as propulsion is not the focus of the mission; however, the deployment of a solar sail is itself a huge engineering challenge. Nanosail-D will be the perfect experiment to test out whether the method NASA will be using to unfurl the sail is workable in space.
Immediately after the ejection earlier today, a timer started a three-day countdown. Once it reaches zero, it will go boom – that is, four booms will spring out from the small satellite, and within five seconds the sail will be fully extended to its 100 square foot (10 square meter) sail-span. The first Nanosail-D, unfurled in the lab with the mission team. Image Credit: NASA
Dean Alhorn, NanoSail-D principal investigator and aerospace engineer at the Marshall Space Flight Center explains on the mission page, “The deployment works in the exact opposite way of carpenter’s measuring tape. With a measuring tape, you pull it out, which winds up a spring, and when you let it go it is quickly pulled back in. With NanoSail-D, we wind up the booms around the center spindle. Those wound-up booms act like the spring. Approximately seven days after launch, it deploys the sail off the center spindle.”
There have been other attempts at launching and deploying solar sails before, but once deployed, Nanosail D will be the longest-running solar sail experiment yet attempted. Both JAXA and the Russian space agency have deployed successful solar sail experiments.
JAXA launched a clover-shaped sail aboard a sounding rocket in 2004, and the experiment lasted about 400 seconds. They also launched the IKAROS spacecraft in May, 2010, which is currently en-route to Venus, and will fly to the opposite side of Sun from Earth. The Russians deployed a 20-meter diameter mirror successfully aboard the Progress M-15 resupply mission to Mir in 1993. Named Znamya 2, the mirror cast a 5km (3 mile)-wide bright spot on the ground that swept across southern France to western Russia, and orbited for several hours before burning up.
The Planetary Society is probably the most vocal and enthusiastic organization in support of solar sail technology. They are currently developing a solar sail similar to that of Nanosail-D, called Lightsail-1. The society attempted a launch of a solar sail called Cosmos 1 in 2005, but the rocket carrying the satellite did not fire during its second stage, and the craft was lost.
Nanosail-D is in its second iteration. The first spacecraft was commissioned in early 2008, and the team – astrophysicists and engineers at the Marshall Space Flight Center and the Ames Research Center – had four months to put together a workable satellite. It launched aboard a Falcon 1 rocket in August of 2008, but the rocket burned up in the atmosphere. If engineers are good at one thing, it’s redundancy – the team had constructed a second Nanosail-D, and had ample time to work out some of the bugs and develop the technology even more. Doug Huie, a research technician at the University of Alabama in Huntsville, prepares the spacecraft for launch testing. The spacecraft measures 4 inches wide, 4 inches deep and 13 inches long, and weighs 9 pounds. (10cm X 10cm X 33 cm, 4kg) Image Credit: NASA
The Planetary Society almost had a chance to launch Nanosail-D, according to Louis Friedman, executive director of the The Planetary Society, they were contacted by the team developing Nanosail-D after the failed initial launch attempt, and asked if they would like to help launch the second Nanosail-D spacecraft. The Planetary Society agreed, but the team then found space aboard the FASTSAT launch. Consequently, Lightsail-D was borne out of this brief collaboration.
The timer is silently counting down what promises to be an exciting mission, and potential milestone in the future of spaceflight. Watch this space for further developments on the mission.