Europa’s Tidal Processes Give Hints to Our Moon’s Far-side Bulge

The Moon's crust is thickest on the central farside, and becomes thinner towards the north pole in a manner described by a simple mathematical function. Early in lunar evolution, when a magma ocean was present, tides from the Earth could have heated the floating crust nonuniformly, such that the crust thinned at the poles and thickened at the equator. Today, the magma ocean has solidified, but the thick farside crust remains. Figure not to scale. Image © Science/AAAS

[/caption]

A self-conscious Moon might ask, “Does my far side look big?” To which lunar scientists would have to reply in the affirmative. They have long known there is a bulge on the Moon’s far side, a thick region of the lunar crust which underlies the farside highlands. But why that bulge is there has been a mystery, and the fact that the far side always faces away from Earth hasn’t helped. Now, a group of international scientists have found that perhaps the tidal processes of Jupiter’s icy moon, Europa, can provide a clue.

“Europa is a completely different satellite from our moon, but it gave us the idea to look at the process of tidal flexing of the crust over a liquid ocean,” said Ian Garrick-Bethell, the lead author of a new paper that offers an explanation for the lop-sided Moon.


Since the Apollo 15 laser altimeter experiment, scientists have known that a region of the lunar far side highlands is the highest place on the Moon. Additionally, the far side has only highlands and no maria.

Like Europa’s icy crust that sits over an ocean of liquid water, the Moon’s crust once floated on a sub-surface ocean of liquid rock. So, could the same gravitational forces from Jupiter that influence Europa also apply to the Earth’s influence on the early Moon?

Garrick-Bethell, from UC Santa Cruz, and his team found that the shape of the Moon’s bulge can be calculated by looking at the variations in tidal heating as the ancient lunar crust was being torn away from the underlying ocean of liquid magma.

Map of crustal thickness. Credit: Garrick-Bethell, et al.

With Europa in mind, the scientists looked at global topography and gravity data sets of the Moon, trying to determine the possibility of how about 4.4 billion years ago, the gravitational pull of the Earth could have caused tidal flexing and heating of the lunar crust. At the polar regions, where the flexing and heating was greatest, the crust became thinner, while the thickest crust would have formed in the regions in line with the Earth.

To back up their theory, they found that a simple mathematical function — a 2-degree spherical harmonics function — can explain the phenomenon. “What’s interesting is that the form of the mathematical function implies that tides had something to do with the formation of that terrain,” said Garrick-Bethell.

The far side of the Moon, photographed by the crew of Apollo 11 as they circled the Moon in 1969. The large impact basin is Crater 308. Credit: NASA

However, this doesn’t explain why the bulge is now found only on the farside of the Moon. “You would expect to see a bulge on both sides, because tides have a symmetrical effect,” Garrick-Bethell said. “It may be that volcanic activity or other geological processes over the past 4.4 billion years have changed the expression of the bulge on the nearside.”

Garrick-Bethell said his team hopes to continue to do more modeling and calculations to fully describe the far side’s features.

“It’s still not completely clear yet, but we’re starting to chip away at the problem,”he said.

The paper will be published in the November 12, 2010 issue of Science.

(Paper not yet available — we’ll post the link when it goes online).

Galaxy Zoo Searches for Supernovae

Aside from categorizing galaxies, another component of the Galaxy Zoo project has been asking participants to identify potential supernovae (SNe). The first results are out and have identified “nearly 14,000 supernova candidates from [Palomar Transient Factory, (PTF)] were classified by more than 2,500 individuals within a few hours of data collection.”

Although the Galaxy Zoo project is the first to employ citizens as supernova spotters, the background programs have long been in place but were generating vast amounts of data to be processed. “The Supernova Legacy Survey used the MegaCam instrument on the 3.6m Canada-France-Hawaii Telescope to survey 4 deg2” every few days, in which “each square degree would typically generate ~200 candidates for each night of observation.” Additionallly, “[t]he Sloan Digital Sky Survey-II Supernova Survey used the SDSS 2.5m telescope to survey a larger area of 300 deg2” and “human scanners viewed 3000-5000 objects each night spread over six scanners”.

To ease this burden, the highly successful Galaxy Zoo implemented a Supernova Search in which users would be directed through a decision tree to help them determine what computer algorithms were proposing as transient events. Each image would be viewed and decided on by several participants increasing the likelihood of a correct appraisal. Also, “with a large number of people scanning candidates, more candidates can be examined in a shorter amount of time – and with the global Zooniverse (the parent project of Galaxy Zoo) user base this can be done around the clock, regardless of the local time zone the science team happens to be based in” allowing for “interesting candidates to be followed up on the same night as that of the SNe discovery, of particular interest to quickly evolving SNe or transient sources.”

To identify candidates for viewing, images are taken using the 48 inch Samuel Oschin telescope at the
Palomar Observatory. Images are then calibrated to correct instrumental noise and compared automatically to reference images. Those in which an object appears with a change greater than five standard deviations from the general noise are flagged for inspection. While it may seem that this high threshold would eliminate other events, the Supernova Legacy Survey, starting with 200 candidates per night, would only end up identifying ~20 strong candidates. As such, nearly 90% of these computer generated identifications were spurious, likely generated by cosmic rays striking the detector, objects within our own solar system, or other such nuisances and demonstrating the need for human analysis.

Still, the PTF identifies between 300 and 500 candidates each night of operation. When exported to the Galaxy Zoo interface, users are presented with three images: The first is the old, reference image. The second is the recent image, and the third is the difference between the two, with brightness values subtracted pixel for pixel. Stars which didn’t change brightness would be subtracted to nothing, but those with a large change (such as a supernova), would register as a still noticeable star.

Of course, this method is not flawless, which also contributes to the false positives from the computer system that the decision tree helps weed out. The first question (Is there a candidate centered in the crosshairs of the right-hand [subtracted] image?) eliminates misprocessing by the algorithm due to misalignment. The second question (Has the candidate itself subtracted correctly?) serves to drop stars that were so bright, they saturated the CCD, causing odd errors often resulting in a “bullseye” pattern. Third (Is the candidate star-like and approximately circular?), users eliminate cosmic ray strikes which generally only fill one or two pixels or leave long trails (depending on the angle at which they strike the CCD). Lastly, users are asked if “the candidate centered in a circular host galaxy?” This sets aside identifications of variable stars within our own galaxy that are not events in other galaxies as well as supernovae that appear in the outskirts of their host galaxies.

Each of these questions is assigned a number of positive or negative “points” to give an overall score for the identification. The higher the score, the more likely it is to be a true supernova. With the way the structure is set up, “candidates can only end up with a score of -1, 1 or 3 from each classification, with the most promising SN candidates scored 3.” If enough users rank an event with the appropriate score, the event is added to a daily subscription sent out to interested parties.

To confirm the reliability of identifications, the top 20 candidates were followed up spectroscopically with the 4.2m William Herschel Telescope. Of them, 15 were confirmed as SNe, with 1 cataclysmic variable, and 4 remain unknown. When compared to followup observations from the PTF team, the Galaxy Zoo correctly identified 93% of supernova that were confirmed spectroscopically from them. Thus, the identification is strong and this large volume of known events will certainly help astronomers learn more about these events in the future.

If you’d like to join, head over to their website and register. Presently, all supernovae candidates have been processed, but the next observing run is coming up soon!

Astronomy Cast Ep. 205: Fusion

The interior of the Sun.

When the Universe formed after the Big Bang, all we had was hydrogen. But through the process of fusion, these hydrogen atoms were crushed into heavier and heavier elements. Fusion gives us warmth and light from the Sun, destruction with fusion bombs, and might be a source of inexpensive energy. We’ll also look into the controversy of cold fusion.

Click here to download the episode

Fusion – Show notes and transcript

Or subscribe to: astronomycast.com/podcast.xml with your podcatching software.

First Images From Chang’E 2 Released

A lunar crater in stunning detail from the Chang'E 2 orbiter. Credit: CNSA / China Lunar Exploration Program

[/caption]

China’s space agency released the first images taken by the newest lunar orbiter, Chang’E 2. “The relaying back of the pictures shows that the Chang’e-2 mission is a success,” said Zhang Jiahao, director of the lunar exploration center of the China National Space Administration.

During its expected 6-month mission the orbiter will come within 15km above the surface, with the main mission of looking for potential landing for Chang’E-3, China’s next lunar mission that will send a rover to the Moon’s surface, scheduled for 2013. While all the other images are of Sinus Iridum (Bay of Rainbows), a rough translation of the writing on this top image has something to do with “antarctic,” so its possible this could be a crater near one of the lunar poles.

This 3-D map view of the moon’s Bay of Rainbows was taken by China’s Chang’e 2 lunar probe in October 2010. The mission is China’s second robotic mission to explore the moon. Credit: China Lunar Exploration Program

The data for this 3D image was taken by a the spacecraft’s stereo camera from 18.7 km on Oct. 28, four days after launch. The image has a resolution of 1.3 meters per pixel, more than ten times the resolution of pictures from Chang’E 2’s predecessor, Chang’E 1.

For comparison, NASA’s Lunar Reconnaissance Orbiter has a resolution of about 1 meter.

Sinus Iridum is considered to be one of the candidates for the 2013 lander.

Chang’E 2 will also test “soft landing” technology for the lander, which might mean that either the spacecraft is carrying an impactor or that the spacecraft itself will be crashed into the lunar surface like Chang’E 1.

This photo, taken by China’s Chang’e 2 lunar probe in October 2010, shows a crater in the moon’s Bay of Rainbows. . Credit: China Lunar Exploration Program
Another Chang'E 2 image. Credit: Credit: China Lunar Exploration Program

Sources: NASA Lunar Science Institute, China National Space Administration

Subatomic Particles

Fine Structure Constant

[/caption]

Not long ago, scientists believed that the smallest part of matter was the atom; the indivisible, indestructible, base unit of all things. However, it was not long before scientists began to encounter problems with this model, problems arising out of the study of radiation, the laws of thermodynamics, and electrical charges. All of these problems forced them to reconsider their previous assumptions about the atom being the smallest unit of matter and to postulate that atoms themselves were made up of a variety of particles, each of which had a particular charge, function, or “flavor”. These they began to refer to as Subatomic Particles, which are now believed to be the smallest units of matter, ones that composenucleons and atoms.

Whereas protons, neutrons and electrons have always been considered to be the fundamental particles of an atom, recent discoveries using atomic accelerators have shown that there are actually twelve different kinds of elementary subatomic particles, and that protons and neutrons are actually made up of smaller subatomic particles. These twelve particles are divided into two categories, known as Leptons and Quarks. There are six different kinds, or “flavors”, of quarks (named because of their unusual behavior). These include up, down, charm, strange, top, and bottom quark, each of which possesses a charge that is expressed as a fraction (+2/3 for up, top and charm,-1/3 for down, bottom and strange) and have variable masses. There are also six different types of Leptons, which include Electrons, Muons, Taus, Electron Neutrinos, Muon Neutrinos, and Tau Neutrinos. Whereas electrons and Muons both have a negative charge of -1 (Muons having greater mass), Neutrinos have no charge and are extremely difficult to detect.

In addition to elementary particles, composite particles are another category of subatomic particles. Whereas elementary particles are not made up of other particles, composite particlesare bound states of two or more elementary particles, such as protons or atomic nuclei. For example, a proton is made of two Up quarks and one Down quark, while the atomic nucleus of helium-4 is composed of two protons and two neutrons.In addition, there are also the subatomic particles that fall under the heading of Gauge Bosons, which were identified using the same methods as Leptons and Quarks. These are classified as “force carriers”, i.e. particles that act as carriers for the fundamental forces of nature. These include photons that are associated with electromagnetism, gravitons that are associated with gravity, the three W and Z bosons of weak nuclear forces, and the eight gluons of strong nuclear forces. Scientists also predict the existence of several more, what they refer to as “hypothetical” particles, so the list is expected to grow.

Today, there are literally hundreds of known subatomic particles, most of which were either the result of cosmic rays interacting with matter or particle accelerator experiments.

We have written many articles about the subatomic particles for Universe Today. Here’s an article about the atomic nucleus, and here’s an article about the atomic theory.

If you’d like more info on the Atom, check out the Background on Atoms, and here’s a link to the NASA’s Understanding the Atom Page.

We’ve also recorded an entire episode of Astronomy Cast all about the Composition of the Atom. Listen here, Episode 164: Inside the Atom.

Sources:
http://en.wikipedia.org/wiki/Subatomic_particle
http://en.wikipedia.org/wiki/Nucleon
http://www.school-for-champions.com/science/subatomic.htm
http://en.wikipedia.org/wiki/Gauge_boson
http://en.wikipedia.org/wiki/List_of_particles

Star Cluster

WISE Reveals a Hidden Star Cluster

[/caption]

There are few things in astronomy more awe inspiring and spellbinding than the birth of a star. Even though we now understand how they are formed, the sheer magnitude of it is still enough to stir the imagination of even the most schooled and cynical academics. Still, there is some degree of guesswork and chance when it comes to where stars will be born and what kind of stars they will become. For example, while some stars are single field stars (like our Sun), others form in groups of two (binary) or more, sometimes much more. This is what is known as a Star Cluster, by definition, a group of stars that share a common origin and are gravitationally bound for some length of time.

Thereare two basic categories of star clusters: Globular and Open (aka. Galactic) star clusters. Globular clusters are roughly spherical groupings of stars that range from 10,000 to several million stars packed into regions ranging from 10 to 30 light years across. They commonly consist of very old Population II stars – which are just a few hundred million years younger than the universe itself – and are mostly yellow and red. Open clusters, on the other hand, are very different. Unlike the spherically distributed globulars, open clusters are confined to the galactic plane and are almost always found within the spiral arms of galaxies. They are generally made up of young stars, up to a few tens of millions of years old, with a few rare exceptions that are as old as a few billion years. Open clusters also contain only a few hundred members within a region of up to about 30 light-years. Being much less densely populated than globular clusters, they are much less tightly gravitationally bound, and over time, will become disrupted by the gravity of giant molecular clouds and other clusters.

Star clusters are particularly useful to astronomers as they provide a way to study and model stellar evolution and ages. By estimating the age of globular clusters, scientists were able to get a more accurate picture of how old the universe is, putting it at roughly 13 billion years of age. In addition, the location of star clusters and galaxies is believed to be a good indication of the physics of the early universe. This is based on aspects of the Big Bang theory where it is believed that immediately after the creation event, following a period of relatively homogenous distribution; cosmic matter slowly gravitated to areas of higher concentration. In this way, star clusters and the position of galaxies provide an indication of where matter was more densely distributed when the universe was still young.

Some popular examples of star clusters, many of which are visible to the naked eye, include Pleiades, Hyades, the Beehive Cluster and the star nursery within the Orion Nebula.

We have written many articles about star cluster for Universe Today. Here’s an article about a massive star cluster discovered, and here are some amazing star cluster wallpapers.

If you’d like more information on stars, check out Hubblesite’s News Releases about Stars, and here’s the stars and galaxies homepage.

We’ve done many episodes of Astronomy Cast about stars. Listen here, Episode 12: Where Do Baby Stars Come From?

Sources:
http://en.wikipedia.org/wiki/Star_cluster
http://universe-review.ca/F06-star-cluster.htm
http://outreach.atnf.csiro.au/education/senior/astrophysics/stellarevolution_clusters.html
http://www.sciencedaily.com/articles/s/star_cluster.htm
http://en.wikipedia.org/wiki/Stellar_populations#Populations_III.2C_II.2C_and_I
http://www.sciencedaily.com/articles/g/galaxy_formation_and_evolution.htm

Solar Day

Winter Solstice
Earth as viewed from the cabin of the Apollo 11 spacecraft. Credit: NASA

[/caption]

Since the dawn of time, human beings have relied on the cycles of the sun, the moon, and the constellations through the zodiac in order to measure time. The most basic of these was the motion of the Sun as it traced an apparent path through the sky, beginning in the East and ending in the West. This procession, by definition, is what is known as a Solar Day. Originally, it was thought that this motion was the result of the Sun moving around the Earth, much like the Moon, celestial objects and stars seemed to do. However, beginning with Copernicus’ heliocentric model, it has since been known that this motion is due to the daily rotation of the earth around the Sun’s polar axis.

Up until the 1950’s, two types of Solar time were used by astronomers to measure the days of the year. The first, known as Apparent Solar Time, is measured in accordance with the observable motion of the Sun as it moves through the sky (hence the term apparent). The length of a solar day varies throughout the year, a result of the Earth’s elliptical orbit and axial tilt. In this model, the length of the day varies and the accumulated effect is a seasonal deviation of up to 16 minutes from the mean. The second type, Solar Mean Time, was devised as a way of resolving this conflict. Conceptually, Mean solar time is based on a fictional Sun that is considered to move at a constant rate of 360° in 24 hours along the celestial meridian. One mean day is 24 hours in length, each hour consisting of 60 minutes, and each minute consisting of 60 seconds. Though the amount of daylight varies significantly throughout the year, the length of a mean solar day is kept constant, unlike that of an apparent solar day.

The measure of time in both of these models depends on the rotation of the Earth. In both models, the time of day is not plotted based on the position of the Sun in the sky, but on the hour angle that it produces – i.e. the angle through which the earth would have to turn to bring the meridian of the point directly under the sun. Nowadays both kinds of solar time stand in contrast to newer kinds of time measurement, introduced from the 1950s and onwards which were designed to be independent of earth rotation.

We have written many articles about Solar Day for Universe Today. Here’s an article about how long a day is on Earth, and here’s an article about the rotation of the Earth.

If you’d like more info on Earth, check out NASA’s Solar System Exploration Guide on Earth. And here’s a link to NASA’s Earth Observatory.

We’ve also recorded an episode of Astronomy Cast all about planet Earth. Listen here, Episode 51: Earth.

Sources:
http://en.wikipedia.org/wiki/Solar_time
http://www.tpub.com/content/administration/14220/css/14220_149.htm
http://scienceworld.wolfram.com/astronomy/SolarDay.html
http://www.britannica.com/EBchecked/topic/553052/solar-time?anchor=ref144523
http://en.wikipedia.org/wiki/Hour_angle

Costs for James Webb Telescope Soar — Again

Artists concept of the James Webb Space Telescope in space. Credit: NASA

[/caption]

The price tag for NASA’s next big space telescope keeps rising and the launch date will likely be delayed as well. A new report from an independent panel on the James Webb Space Telescope reveals it will take about $6.5 billion to launch and run the telescope for its projected 10-year mission. The price had previously ballooned from $3.5 billion to $5 billion. Originally the telescope was slated to launch in 2007, but was pushed back to 2014. Now, the panel says, the earliest launch date would be in September 2015.

The panel, requested by Congress, said there appears to be no technical issues with the telescope, but budget and management problems are the reasons for the cost overruns and delays.

“There is no reason to question the technical integrity of the design or of the team’s ability to deliver a quality product to orbit,” said John Casani from the Jet Propulsion Lab, who chaired the panel. “The problems causing cost growth and schedule delays have been associated with budgeting and program management, not technical performance.”

The money to cover the overruns will require $250 million more in NASA’s FY 2011 and 2012 budget. But with the current state of affairs in the country and Congress, it is likely other programs will suffer or be cut in order to pay for JWST.

In a teleconference with reporters, NASA associate administrator Chris Scolese admitted that NASA officials did not do a very good job of keeping track of what was going on with the massive telescope project.

“We were missing a certain fraction of what was going on,” Scolese. “The fault lies with us.”

The panel concluded that the budget was not sufficient in the early days of the telescope’s development for everything to go as hoped.

“The budget was flawed, from a money standpoint it was just insufficient to carry out the work,” said John Klineberg, a member of the panel and a retired engineer. “The budget was skewed, and the reserves to complete the work were also wrong because they were predicated on a budget that was too low. Headquarters did not spot the errors, and they didn’t fully recognize the extent to which the budget was understating the needs of the project.”

“This is a large, complex project and to estimate something to a real degree of precision is hard,” Klineberg added.

The panel found no way for current costs to be reduced, but found ways to reduce the likelihood of cost-growth in the future.

In order for JWST to be built and launched, the panel said NASA should restructure the project organization at Goddard Spaceflight Center to improve the accounting of costs and reserves. The program will now report directly to the Administrator’s office. Richard Howard will be the new JWST program director, replacing Phil Sabelhaus.

“We have to focus on doing what is right to get the project back on track,” said Scolese, “but I want to emphasize that there are no technical problems with the telescope and we have to thank the team for doing a great technical job. The important thing we have to fix is the cost management at the project level and at the management level.”

In a statement, NASA Administrator Charlie Bolden said, “I am disappointed we have not maintained the level of cost control we strive to achieve, something the American taxpayer deserves in all of our projects….NASA is committed to finding a sustainable path forward for the program based on realistic cost and schedule assessments.”

The teleconference with journalists included a first – at least for this reporter: one caller berated NASA management and swore at Scolese, obviously frustrated by the lack of oversight by NASA on what is supposed to be a flagship mission for the space agency’s astronomy division.

The infrared telescope will have a 6.5 meter (22 ft.) mirror and a sunshade the size of a tennis court. JWST should be able to look back in time to find the first galaxies that formed in the early Universe, and to peer inside dust clouds where stars and planetary systems are forming.

Read the report (pdf): James Webb Space Telescope Independent Comprehensive Review Panel — Nov. 10, 2010

Panel Chair Casani’s letter to NASA Administrator Bolden

Structural Crack Found on Shuttle Tank

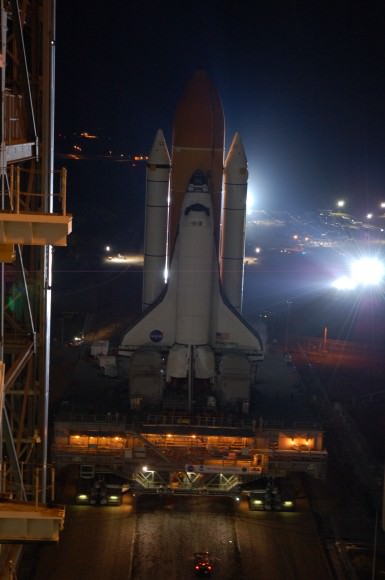
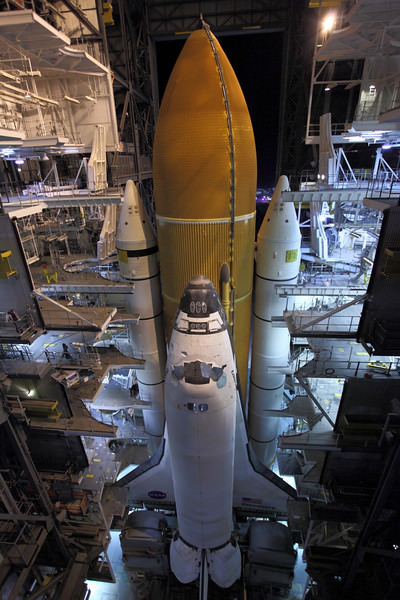
The chances of space shuttle Discovery launching on the STS-133 mission in 2010 could be in jeopardy. Cracked foam on the shuttle’s external tank was removed early Wednesday morning and underneath engineers found a structural crack on the tank itself. The serpentine crack is about 22 cm (9 inches) long and is located on a structural rib or “stringer.” Cracks like this have appeared on other tanks and were fixed at the production facility in New Orleans. But this type of repair has never been attempted at the launch pad.
Continue reading “Structural Crack Found on Shuttle Tank”

ω Centauri’s Red Giants Confirm Stellar Evolution Models

As the get older, Sun-like stars become red giants. 30-50 percent of these red giants exhibit a strange variability in their brightness that has so far eluded explanation. Image Credit: ESO/S. Steinhofel

[/caption]

While science education often focuses on teaching the scientific method (or at least tries to), the real process of science is often far less linear. Theories tie together so many points of data, that making singular predictions that confirm or refute a proposition is often challenging. Such is the case for stellar evolution. The understanding is woven together from so many independent pieces, that the process is more of a roaring sea than a directed river.

Realizing this, I’ve been keen on instances in which necessary predictions are observationally confirmed later. A new study, led by Mariela Vieytes from the University of Buenos Aires and accepted in an upcoming publication of Astronomy & Astrophysics, does just that by demonstrating one of the necessary conditions for predictions of post main sequence evolution. Specifically, astronomers need to establish that stars undergo significant amounts of mass loss (~0.1-0.3 M) during their red giant branch evolution. This requirement was set forth as part of the expected behavior necessary to explain: “i) the very existence of the horizontal branch (HB) and its morphology, ii) the pulsational properties of RR Lyrae stars, iii) the absence of asymptotic giant branch (AGB) stars brighter than the red giant branch (RGB) tip, and the chemistry and characteristics in the AGB, post-AGB and planetary nebula evolutionary phases, iv) the mass of white dwarf (WD) stars.”

Astronomers expected to find confirmation of this mass loss by detecting gas congregating in the cores of globular clusters after being shed by stars evolving along the RGB. Yet searches for this gas came up mostly empty. Eventually astronomers realized that gas would be stripped relatively quickly as globular clusters plunged through the galactic plane. But this left them with the need to confirm the prediction in some other manner.

One way to do this is to look at the stars themselves. If they show velocities in their photospheres greater than the escape velocity, they will lose mass. Just how much higher will determine the amount of mass lost. By analyzing the Doppler shift of specific absorption lines of several stars in the cluster ω Centauri, the team was able to match the amount of mass being lost to predictions from evolutionary models. From this, the team concluded that their target stars were losing between the rates of mass loss are estimated as a few 10-9 and 10-10 M yr-1. This is in general agreement with the predictions set forth by evolutionary models.