LCROSS was an unusual mission, in that it relied on an impact in order to study a planetary body. Not only was the mission unusual, so was the ejecta plume produced by slamming a hollow Centaur rocket booster into the Moon.
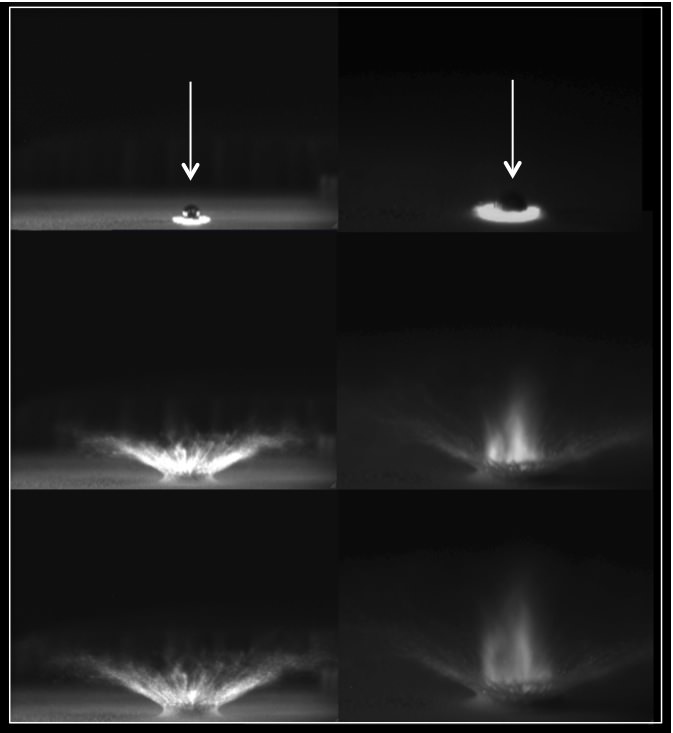
“A normal impact with a solid impactor throws debris out more than up, like an inverted lampshade that gets wider and wider as it goes out,” said Pete Schultz, from Brown University and a member of the LCROSS science team. “But the configuration of a hollow impactor — the empty rocket booster — created a plume that had both a low angle plume but more importantly, also a really prominent high angle plume that shot almost straight up.”
This high plume elevated the debris enough so it was illuminated by sunlight, and could be studied by spacecraft.
Even though the plume wasn’t seen from Earth, as was advertised prior to the impact, it was seen by the both the LCROSS shepherding spacecraft and the Lunar Reconnaissance Orbiter. Using the spent Centaur was not so much by mission design as using what was available. But it turned out to be a great choice.
“I think we were quite fortunate,” Schultz told Universe Today in a phone interview this week. “I think another design, and we may have gotten a very different result. Not much debris may have come up into the sunlight and the plume would have been very temporary.”
In order for the debris to get high enough to come into sunlight, it had to rise up about a half mile above the bottom of the crater.
“To put this into perspective,” said Schultz, “we had to throw debris up twice the height of the Sears Tower, the tallest building in the US. Now the Moon has less gravity, so if we bring it back down to Earth and compare it, it is like trying to throw a ball to the top of the Washington Monument. So there is a lot of gravity to overcome, and it turns out that this impact did it because we used a hollow impactor.”
When the rocket booster hit and the crater began to form, the lunar surface collapsed and shot upwards – almost like a jet – towards the sunlight, carrying with it the volatiles that had been trapped in the regolith.
In order to figure out what the impact was going to look like, Schultz and his team, which included graduate student Brendan Hermalyn, did small scale impacts and modeling. Their tests were only done a couple of months before the actual impact, and used small half-inch projectiles into different surfaces.
“Most impacts, when we model them, we assume the impactors are solid,” Schultz said. “We did experiments, with both solid and hollow projectiles, and when we used the hollow projectile, we had a real surprise. We not only saw the debris moving outward, but also upward.”
“We really didn’t know exactly what we were going to see in the actual LCROSS impact, but our tests explained a lot,” Schultz continued, “explaining why we saw what we did and why we saw the plume for such a long time. If it had been coming out like an inverted lampshade or a funnel expanding, the debris would have come up and gone back down, and probably would have been done within about 20 seconds. Instead, it just kept on coming.”
But there were some expected moments. As the LCROSS shepherding spacecraft approached the lunar surface, Tony Colaprete and the team readjusted the exposures on the cameras and the team was able to actually see the surface of the Moon in the final seconds before impact.
“That was great,” Schultz said. “That means we got to see the crater, we were able to get an estimate on how big the crater was, and it made sense with what our predictions had said. But we were also able to see the remnants of this high angle plume still returning to the surface. This must have been shot almost straight up into space, and was now coming back to the Moon. We saw it as a very diffuse cloud, and saw the remaining portions of the regolith coming back down, like a fountain. To me, that was the most exciting part.”
Schultz said he was nervous during the impact.
“I have to confess, we were on pins and needles,” he said, “as this was something much bigger than the experiments of using half inch projectiles and we didn’t know if it was going to scale up. We were dealing with something that looked like schoolbus with no children aboard that was slamming into the Moon and we didn’t know if that was going to behave in the same way as our smaller models.”
And even though the plume did act like the models, there were plenty of surprises — both in the impact and what has now been discovered to exist in Cabeus Crater.
“We knew when it was going to hit the surface – we know how fast how we were going and where we were above the surface — and it turned out there was a delay before we saw the flash and that was really a surprise,” Schultz said. “It was about a half second delay and then it took about a third of second delay before it began to rise and get brighter. The whole thing took seven-tenths of a second before it began to get bright. That is hallmark of a fluffy surface.”
Schultz said they know that it was likely a “fluffy” surface from the experiments and modeling, and from comparisons with the Deep Impact mission, for which he was a co-investigator.
“One of the first things we realized was that this is not your normal regolith — what you usually think of for the Moon,” Schultz said. “We watched the flash, and we looked for what type of spectra we saw. The spectra has the fingerprints of the composition of the elements and compounds. We were expecting because of the low speed we actually wouldn’t get to see much. But instead we immediately got a couple of hits, we got to see a sudden emission of OH, which is a characteristic at this wavelength of a byproduct of heating of water. Then the next 2-second exposure was when things started emerging, the overall spectra got brighter which meant we were seeing more dust. But then we saw this big giant peak of sodium, just like a beacon, a very bright sodium line.”
And then there were two other lines that were very odd. “The best association we could find that is was silver,” said Schultz. “That was a surprise. Then all these other emission lines started emerging as more material got into sunlight. This suggests that we were throwing the dust into the sunlight, and the volatiles that had been frozen in time, literally, in the shadows of Cabeus were heating up and and being released.”
Some of these compounds included not only water and OH, but also things like carbon monoxide, carbon dioxide, and methane, “things that we don’t think of when we talk about the Moon,” said Schultz. “Those are compounds we think of when we think about comets, so now we are in a position that maybe what we are seeing at the poles are the result of a long history of impacts that bring with them a lot of this type of material.” (Read our interview with Tony Colaprete for more about the recent LCROSS results.)
But no one is sure how the Moon can hold onto these volatiles and how they end up in the polar craters.
To figure that out, Schultz said more missions to the Moon are needed.
“Even though the Apollo astronauts were there, we’re now finding things 40 years later that are making our heads snap from all this the new information,” Schultz said. “It goes to show you, you can visit and think you know a place, but you have to go back and maybe even live there.”
Schultz said that as an experimentalist, one can never feel smug, but seeing how the actual plume behaved just like their models, he and his team were very happy. “Experiments are letting nature teach you lessons and that is why they are very interesting to do. We are humbled almost daily.”


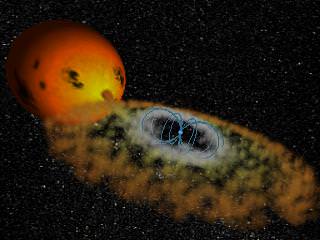

, projected against the target area in the crater Cabeus. Credit: Colaprete, et al.")