[/caption]
Helium is the second lightest element in the known universe. It is also the second most abundant. According to some estimates helium accounts for as much as 24 percent of the Universe’s mass. This element is also plentiful since it is a prime product of fusion nuclear reactions involving hydrogen. So if it is so plentiful where is Helium found?
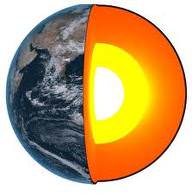
The problem is that just because an element is common in the universe at large does not mean that it is common on Earth. Helium is an element that fits this scenario. Helium only accounts for 0.00052% of the Earth’s atmosphere and the majority of the helium harvested comes from beneath the ground being extracted from minerals or tapped gas deposits. This makes it one of the rarest elements of any form on the planet.
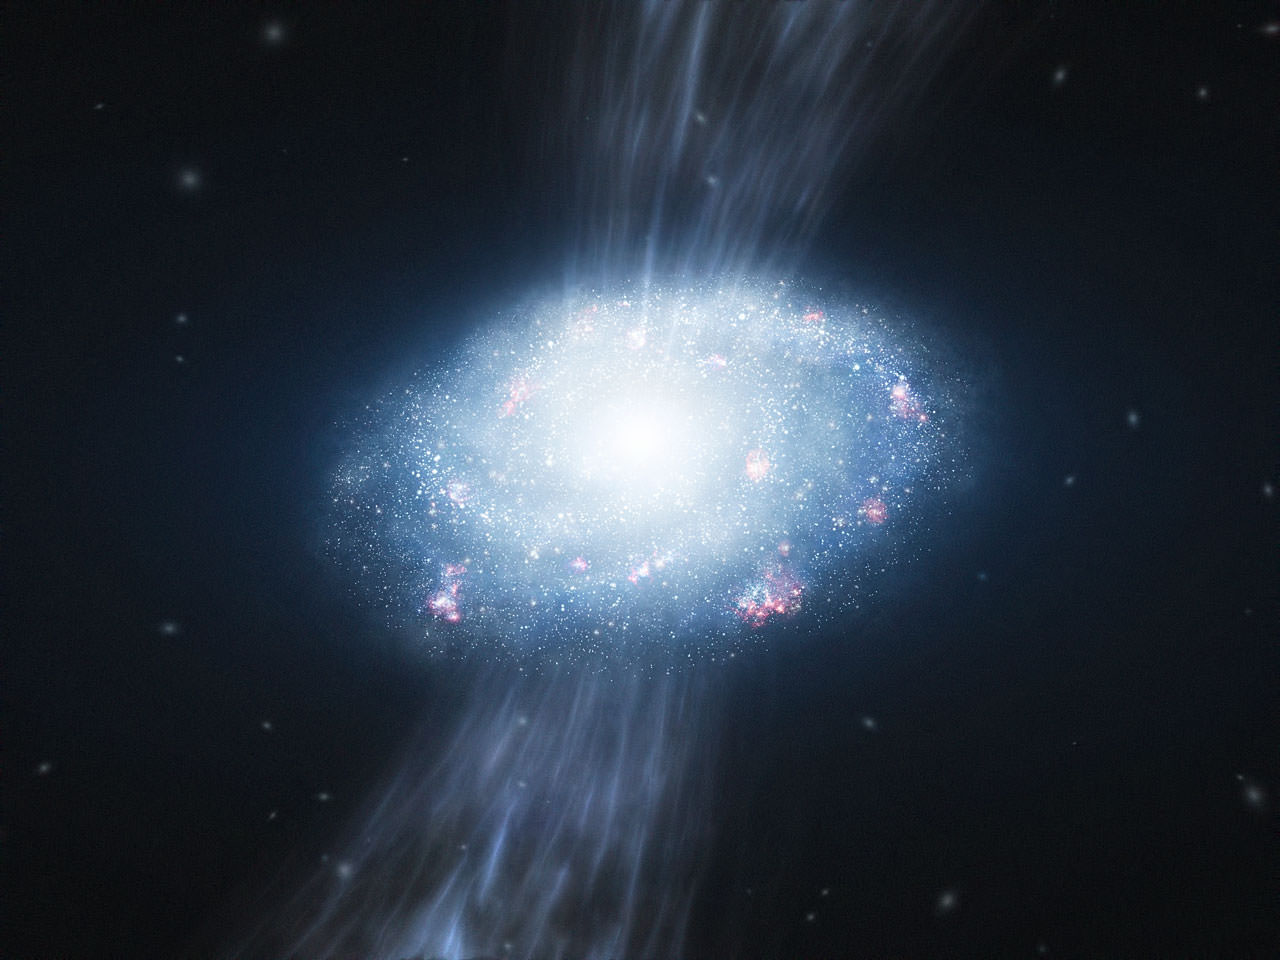
Like mentioned before Helium is rare on Earth but there are places where it is readily found. If you look at space the majority of helium is in stars and the interstellar medium. This is due to the fusion reaction that powers most stars fusing single hydrogen atoms to create helium atoms. This process balanced with a star’s gravity is what helps it to stay stable for billions of years. On Earth the majority of helium found comes from radioactive decay. This is the opposite nuclear reaction called fission that splits atoms. For this reason radioactive minerals in the lithosphere like uranium are prime sources for helium.
On Earth there are key locations where concentrated helium can be harvested. The United States produces the majority of the world’s helium supply at 78%. The rest of the world’s helium is harvested in North Africa, The Middle East, and Russia. The interesting thing is that thanks to these deposits the world’s demand for helium is being met regularly. Also unlike petroleum which can decades to form from organic material, 3000 metric tons of Hydrogen is produced yearly. Until helium demand reaches at least the same level of demand as petroleum there it little chance of that demand outpacing supply.
Helium is looking to be a major player in the near future. Governments are looking into using the gas as source of hydrogen for fuel cells and other transportation technologies. At the moment the promise is still tentative but at least with better surveying and knowledge of gas deposits there will be a supply waiting if becomes the next major element to power human civilization. In the meanwhile ours is still a planet beholden to carbon.
We have written many articles about Helium for Universe Today. Here’s an article about the discovery of Helium, and here’s an article about composition of the Sun.
If you’d like more info about helium on Earth, check out NASA’s Solar System Exploration Guide on Earth. And here’s a link to NASA’s Earth Observatory.
We’ve also recorded an episode of Astronomy Cast all about planet Earth. Listen here, Episode 51: Earth.
Source: Wikipedia