The Origin of Exoplanets

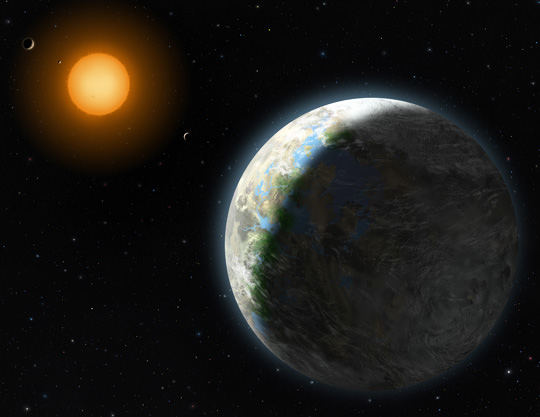
Artist's impression of the planet OGLE-TR-L9b. Credit: ESO/H. Zodet

[/caption]

We truly live in an amazing time for exoplanet research. It was only 18 years ago the first planet outside our solar system was discovered. Fifteen since the first confirmation of one around a main sequence star. Even more recently, direct images have begun to sprout up, as well as the first spectra of the atmospheres of such planets. So much data is becoming available, astronomers have even begun to be able to make inferences as to how these extra solar planets could have formed.

In general, there are two methods by which planets can form. The first is via coaccretion in which the star and the planet would form from gravitational collapse independently of one another, but in close enough proximity that their mutual gravity binds them together in orbit. The second, the method through which our solar system formed, is the disk method. In this, material from a thin disk around a proto-star collapses to form a planet. Each of these processes has a different set of parameters that may leave traces which could allow astronomers to uncover which method is dominant. A new paper from Helmut Abt of Kitt Peak National Observatory, looks at these characteristics and determines that, from our current sampling of exoplanets, our solar system may be an oddity.

The first parameter that distinguishes the two formation methods is that of eccentricity. To establish a baseline for comparison, Abt first plotted the distribution of eccentricities for 188 main-sequence binary stars and compared that to the same type of plot for the only known system to have formed via the disk method (our Solar System). This revealed that, while the majority of stars have orbits with low eccentricity, this percentage falls off slowly as the eccentricity increases. In our solar system, in which only one planet (Mercury) has an eccentricity greater than 0.2, the distribution falls off much more steeply. When Abt constructed the distribution for the 379 planets with known eccentricity, it was nearly identical to that for binary stars.

A similar plot was created for the semi major axis of binary stars and our solar system. Again, when this was plotted for the known extra solar planets the distribution was similar to that of binary star systems.

Abt also inspected the configuration of the systems. Star systems containing three stars generally contained a pair of stars in a tight binary orbit with a third in a much larger orbit. By comparing the ratios of such orbits, Abt quantified the orbital spacing. However, instead of simply comparing to the solar system, he considered the analogous situation of formation of stars around the central mass of the galaxy and built a similar distribution in this manner. In this case, the results were ambiguous; Both modes of formation produced similar results.

Lastly, Abt considered the amount of heavy elements in the more massive body. It is widely known that most extra-solar planets are found around metal-rich stars. While there’s no reason planets forming in a disk couldn’t be formed around high mass stars, having a metal-rich cloud from which to form stars and planets is a requirement for the coaccretion model because it tends to accelerate the collapse process, allowing giant planets to fully form before the cloud was dissipated as the star became active. Thus, the fact that the vast majority of extra-solar planets exist around metal-rich stars favors the coaccretion hypothesis.

Taken together, this provides four tests for formation models. In every case, current observations suggest that the majority of planets discovered thus far formed from coaccretion and not in a disc. However, Abt notes that this is most likely due to statistical biases imposed by the sensitivity limits of current instruments. As he notes, astronomers “do not yet have the radial velocity sensitivity to detect disk systems like the solar system, except for single large planets, like Jupiter at 5 AU.” As such, this view will likely change as new generations of instruments become available. Indeed, as instruments improve to the point that three dimensional mapping becomes available, and orbital inclinations can be directly observed, astronomers will be able to add another test to determine the modes of formation.

EDIT: Following some confusion and discussion in the comments, I wanted to add one further note. Keep in mind this is only the average of all systems currently known that looks like coaccreted systems. While there are undoubtedly some in there that did form from disks, their rarity in the current data makes them not stand out. Certainly, we know of at least one system that fits a strong test for the disk method. This recent discovery by Kepler, in which three planets have been observed transiting their host star demonstrates that all of these planets must lie in a disk which does not conform to expectations of independent condensation. As more systems like this are discovered, we expect that the distributions of the tests described above will become bimodal, having components that match each formation hypothesis.

Astronomy Without A Telescope – Space Towers

(Caption) The Seattle space needle pokes through the cloud tops (well, just fog really… it's only 184 meters high). Credit: Liem Bahneman, pixduas.com

[/caption]

Arthur C Clarke allegedly said that the space elevator would be built fifty years after people stopped laughing. The first space tower though… well, that might need a hundred years. The idea of raising a structure from the ground up to 100 kilometers in height seems more than a bit implausible by today’s engineering standards, given that we are yet to build anything that is more than one kilometer in height. The idea that we could build something up to geosynchronous orbit at 36,000 kilometers in height is just plain LOL… isn’t it?

Space tower proponents point to a key problem with the space elevator design. It may only be after we have spent years inventing a method to manufacture 36,000 kilometers of flawless carbon or boron nanotube fiber – which is light enough not to break under its own weight, but still strong enough to lift an elevator cabin – that we suddenly realize that we still have to get power to the cabin’s lifting engine. And doesn’t that just mean adding 36,000 kilometers of conventional (and heavy) electrical cable to the construction?

Mind you, building a space tower brings its own challenges. It’s estimated that a steel tower, containing an elevator and cabling, of 100 kilometers height needs a cross-sectional base that is a 100 times greater than its apex and a mass that is 135 times greater than its payload (which might be a viewing platform for tourists).

A solid construction capable of holding up a launch platform at 36,000 kilometers altitude might need a tower with ten million times the mass of its payload – with a cross-sectional base covering the area of, say, Spain. And the only construction material likely to withstand the stresses involved would be industrial diamond.

A more economical approach, though no less ambitious or LOL-inducing, are centrifugal and kinetic towers. These are structures that can potentially exceed a height of 100 kilometers, support an appreciable mass at their apex and still maintain structural stability – by virtue of a rapidly rotating loop of cable which not only supports its own weight, but generates lift through centrifugal force. The rotation of the cable loop is driven by a ground-based engine, which can also drive a separate elevator cable to lift courageous tourists. Gaining altitudes of 36,000 kilometers is suggested to be achievable by staged constructions and lighter materials. But, it might be sensible to first see if this grand design on paper can translate to a proposed four kilometer test tower – and then take it from there.

There are also inflatable space towers, proposed to be capable of achieving heights of 3 kilometers with hot air, 30 kilometers with helium or even 100 kilometers with hydrogen (oh, the humanity). Allegedly, a 36,000 kilometer tower might be achievable if filled with electron gas. This is a curious substance argued to be capable of exerting different inflationary pressures depending on the charge applied to the thin-film membrane which contains it. This would allow a structure to withstand differential stresses – where, in a highly charged state, the highly excited electron gas mimics a molecular gas under high pressure, but with a reduced charge it exerts less pressure and the structure containing it becomes more flexible – although, in either case, the overall mass of the gas remains unchanged and suitably low. Hmmm…

An inflatable 100 kilometer high, 300 kilometer long space pier, built to launch spacecraft horizontally. Humans might survive the G forces required to achieve orbit - which they certainly wouldn't do if the same trajectory was attempted from sea-level. Credit: Josh Hall, autogeny.org/tower/tower.html

If this all seems a bit implausible, there’s always the proposed 100 kilometer high space pier that would enable horizontal space launch without rocketry – perhaps via a giant rail gun, or some other similarly theoretical device that works just fine on paper.

Further reading: Krinker, M. (2010) Review of new concepts, ideas and innovations in space towers. (Have to say this review reads like a cut and paste job from a number of not-very-well-translated-from-Russian articles – but the diagrams are, if not plausible, at least comprehensible).

The Black Hole/Globular Cluster Correlation

[/caption]

Often in astronomy, one observable property traces another property which may be more difficult to observe directly; X-ray activity on stars can be used to trace turbulent heating of the photosphere. CO is used to trace cold H2. Sometimes these correlations make sense. Activities in stars produce the X-ray emissions. Other times, the tracer seems distantly related at best.

This is the case of a newly discovered correlation between the mass of the central black hole of galaxies and the number of globular clusters they contain. What can this relationship teach astronomers? Why does it hold for some types of galaxies better than others? And where does it come from in the first place.

The mass of a galaxy’s super massive black hole (SMBH) is known to have a strong relationship between many features of their host galaxies. It has identified to follow the range of velocities of stars in the galaxy, the mass and luminosity of the bulge of spiral galaxies, and the total amount of dark matter in galaxies. Because dark matter in the halo of galaxies and the luminosity have also been known to correspond to the number of globular clusters, Andreas Burkert of the Max-Planck-Institute for Extraterrestrial Physics in Germany, and Scott Tremaine at Princeton wondered if they could cut out the middlemen of dark matter and luminosity and still maintain a strong correlation between the central SMBH and the number of globular clusters.

Their initial investigation involved only 13 galaxies, but a follow-up study by Gretchen and William Harris and submitted to the Monthly Notices of the Royal Astronomical Society, increased the number of galaxies included in the survey to 33. The results of these studies indicated that for elliptical galaxies, the SMBH-GC relationship is evident. However, for lenticular galaxies there was no clear correlation. While there appeared to be a trend for classical spirals, the small number of data points (4) would not provide a strong statistical case independently, but did appear to follow the trend established by the elliptical galaxies.

Although the correlation appeared strong in most cases, about 10% of the galaxies included in the larger surveys were clear outliers. This included the Milky Way which has a SMBH mass that falls significantly short of the expectation from cluster number. One source of error the authors of the original study suspect is that it is possible that, in some cases, objects identified as globular clusters may have been misidentified and in actuality, be the cores of tidally stripped dwarf galaxies. Regardless, the relationship as it stands presently, seems to be quite strong and is even more tightly defined than that of the correlation between that of the SMBH mass and velocity dispersion that implied the potential relationship in the first place. The reason for the discordance in lenticular galaxies has not yet been explained and no reasons have yet been postulated.

But what of the cause of this unusual relation? Both sets of authors suggest the connection lies in the formation of the objects. While distinct in most respects, both are fed by major merger events; Black holes gain mass by accreting gas and globular clusters are often formed from the resulting shocks and interactions. Additionally, the majority of both types of objects formed at high redshifts.

Sources:

A correlation between central supermassive black holes and the globular cluster systems of early-type galaxies

The Globular Cluster/Central Black Hole Connection in Galaxies

Ars Electronica Festival – Don’t Miss September 6!

Ars Electronica made its debut on September 18, 1979. This festival of art, technology and society spotlighted the emerging Digital Revolution. In his preface to what was going on then, Mayor Franz Hillinger wrote (with specific reference to music): “Ars Electronica is giving rise to a new tonal coloration in which state-of-the-art technology is dovetailing with the intellectual spirit of the age to open up undreamt-of expressive possibilities. […] I am absolutely convinced that this new melodic parlance will ultimately be widely understood. After all, with the help of electronic music, it can even be made visible, be implemented in color, contour, line and rhythm that can be followed onscreen.” He would be proven correct.

Within a few years, Ars Electronica developed into one of the world’s foremost media art festivals. And its growing success was paralleled by the expansion of its annual lineup of events. The 1979 festival proudly presented 20 artists and scientists; in 2008, no fewer than 484 speakers and artists from 25 countries were in attendance. Don’t miss this year’s Live Stream on September 6 at 14:00 UT!

For more than three decades now, this world-renowned event has provided an annual setting for artistic and scientific encounters with social and cultural phenomena that are the upshot of technological change. Symposia, exhibitions, performances and interventions carry these inquiries beyond the confines of conventional conference spaces and cultural venues and take them out into the public sphere and throughout the cityscape. In this process of pervading public spaces and staging festival activities in interesting and appropriate physical settings, Ars Electronica has consistently displayed extraordinary imaginativeness. From the harbor to the mines, from factories to outlying monasteries, unusual locations have repeatedly served as sites of performances and interventions, and have, in turn, been reinterpreted by them.

But the attractiveness of Ars Electronica isn’t attributable solely to participation by renowned scientists and artists from all over the world. Or to remarkable venues. Above all, it’s the international audience that makes the biggest contribution to the festival spirit: the colorful mix of old friends and new faces who conjure up extraordinary circumstances – a “fruitful state of emergency” – every September in Linz.

Be sure to tune in on Monday, September 6th when the Ars Electronica Festival will be featuring Repair dealing with the issues of light pollution!

Orignal Source: ARS Electronica

Viking Experiment May Have Found Life’s Building Blocks on Mars After All

View of Mars from the Viking lander in 1976. Credit: NASA

[/caption]

A new look at data from the Mars Viking landers concludes that the two landers may have found the building blocks of life on the Red Planet after all way back in 1976. The surprise discovery of perchlorates by the Phoenix mission on Mars 32 years later could mean the way the Viking experiment was set up actually would have destroyed any carbon-based chemical building blocks of life – what the experiment set about to try and find.

“This doesn’t say anything about the question of whether or not life has existed on Mars, but it could make a big difference in how we look for evidence to answer that question,” said Chris McKay of NASA’s Ames Research Center. McKay coauthored a study published online by the Journal of Geophysical Research – Planets, reanalyzing results of Viking’s tests for organic chemicals in Martian soil.

The Viking lander scooped up some soil, put it in a tiny oven and heated the sample. The only organic chemicals identified in the Martian soil from that experiment chloromethane and dichloromethane — chlorine compounds interpreted at the time as likely contaminants from cleaning fluids used on the spacecraft before it left Earth. But those chemicals are exactly what the new study found when a little perchlorate — the surprise finding from Phoenix — was added to desert soil from Chile containing organics and analyzed in the manner of the Viking tests.

“Our results suggest that not only organics, but also perchlorate, may have been present in the soil at both Viking landing sites,” said the study’s lead author, Rafael Navarro-González of the National Autonomous University of Mexico, Mexico City.

The Viking experiment results have been rather controversial over the years. There are some scientists who say the experiment actually did find evidence for life, and others who say the results were inconclusive.

McKay said that organics can come from non-biological or biological sources. Many meteorites raining onto Mars and Earth for the past 5 billion years contain organics. Even if Mars has never had life, scientists before Viking anticipated that Martian soil would contain organics from meteorites.

“The lack of organics was a big surprise from the Vikings,” McKay said. “But for 30 years we were looking at a jigsaw puzzle with a piece missing. Phoenix has provided the missing piece: perchlorate. The perchlorate discovery by Phoenix was one of the most important results from Mars since Viking.” Perchlorate, an ion of chlorine and oxygen, becomes a strong oxidant when heated. “It could sit there in the Martian soil with organics around it for billions of years and not break them down, but when you heat the soil to check for organics, the perchlorate destroys them rapidly,” McKay said.

This interpretation proposed by Navarro-González and his four co-authors challenges the interpretation by Viking scientists that Martian organic compounds were not present in their samples at the detection limit of the Viking experiment. Instead, the Viking scientists interpreted the chlorine compounds as contaminants.

How will we know for sure? The Mars Science Lab mission, with the car-sized rover called Curiosity could help resolve this question.

The Mars Science Lab is going to the Red Planet in 2012, and on board will be the Sample Analysis at Mars (SAM) instrument SAM can check for organics in Martian soil and powdered rocks by baking samples to even higher temperatures than Viking did, and also by using an alternative liquid-extraction method at much lower heat. Combining these methods on a range of samples may enable further testing of the new report’s hypothesis that oxidation by heated perchlorates that might have been present in the Viking samples was destroying organics.

One reason the chlorinated organics found by Viking were interpreted as contaminants from Earth was that the ratio of two isotopes of chlorine in them matched the three-to-one ratio for those isotopes on Earth. The ratio for them on Mars has not been clearly determined yet. If it is found to be much different than Earth’s, that would support the 1970s interpretation.

If organic compounds can indeed persist in the surface soil of Mars, contrary to the predominant thinking for three decades, one way to search for evidence of life on Mars could be to check for types of large, complex organic molecules, such as DNA, that are indicators of biological activity. “If organics cannot persist at the surface, that approach would not be wise, but if they can, it’s a different story,” McKay said.

Journal of Geophysical Research – Planets. (paper not published online at the time of this writing)

Source: JPL

NASA Satellites and Spacecraft Look Into the Eye of Hurricane Earl

Hurricane Earl on Sept. 2, 2010 as seen by NASA's Terra Satellite. NASA image courtesy Jeff Schmaltz, MODIS Rapid Response Team

[/caption]

NASA scientists, instruments and spacecraft are busy studying Hurricane Earl from both the air and space, and an unmanned aircraft actually flew inside the giant storm. Above is a satellite image from NASA’s Terra satellite, and below is an image taken by one of the astronauts on board the International Space Station, Doug Wheelock. Three NASA aircraft carrying 15 instruments have been flying above, below and into Earl as part the new Genesis and Rapid Intensification Processes mission, or GRIP, which GRIP is designed to help improve our understanding of how hurricanes such as Earl form and intensify rapidly.

See below for a couple of NASA websites where you can see real-time data about Hurricane Earl.


Hurricane Earl as seen from the ISS, taken by astronaut Doug Wheelock. Credit: NASA

The Global Hawk is an unmanned aerial vehicle, and it made its first-ever flight over a hurricane on Sept. 2, and here’s the image of Earl as seen the morning of Sept. 2 from a high-definition camera aboard the aircraft.

NASA's Global Hawk in the Eye of Hurricane Earl on September 2, 2010. Credit: NASA

The photo show’s Hurricane Earl’s eye, and was taken from the HDVis camera on the underside of the Global Hawk aircraft at 13:05 UTC (9:05 a.m. EDT) on Sept. 2. The Global Hawk captured this photo from an altitude of 60,000 ft. (about 11.4 miles high). Here are some more hurricane photos.

Hurricane Earl's eye, as measured by NASA's HAMSR intrument on Sept. 2, 2010. credit: NASA-JPL/Data SIC/NOAA/U.S. Navy/NGA/GEBCO/Google

Among the instruments participating in GRIP is the High-Altitude Monolithic Microwave Integrated Circuit Sounding Radiometer, or HAMSR. The instrument is able to show the 3-D distribution of temperature, water vapor and cloud liquid water in the atmosphere.

Earl’s eye is visible as the blue-green circular area in the center of the image, surrounded by orange-red. The eye is colored blue-green because the instrument is seeing the ocean surface, which appears cool to the instrument. The surrounding clouds appear warm because they shield the cooler ocean surface from view. Just north of the ring of clouds is a deep blue arch, which represents a burst of convection (intense thunderstorms). The pink crosses in the image represent lightning in the area, as measured by a lightning network. Ice particles and heavy precipitation in the convective storm cell cause it to appear cold.

The early evolution of Hurricane Earl is shown in this pair of images from JPL's APR-2 instrument. Credit: NASA/JPL

A second GRIP instrument is the Airborne Precipitation Radar (APR-2), a dual-frequency weather radar that is taking 3-D images of precipitation aboard NASA’s DC-8 aircraft. APR-2 is being used to help scientists understand the processes at work in hurricanes by looking at the vertical structure of the storms.

The two APR-2 hurricane images above show the early evolution of Hurricane Earl from a rather disorganized storm (left) to a better developed hurricane with a more distinct and smaller eye and sharper eyewall (right). The data, taken during southbound passes over Earl’s eye on Aug. 29 and 30, respectively, are essentially vertical slices of the storm. They correspond to the intensity of precipitation seen by the radar along the DC-8’s flight track. Intense convective precipitation (shown in shades of red and pink) was observed on both sides of the hurricane’s eye. The eye is indicated by the dark region near the middle of the images. The yellow-green-colored regions indicate areas of lighter precipitation. The white lines near the bottom are the ocean surface.

Near-real-time images from HAMSR and APR-2 are being displayed on NASA’s TC-IDEAS website at . The website is a near-real-time tropical cyclone data resource and it integrates data from satellites, models and direct measurements from many sources, to help researchers quickly locate information about current and recent oceanic and atmospheric conditions. The composite images and data are updated every hour and are displayed using a Google Earth plug-in. With a few mouse clicks, users can manipulate data and overlay multiple data sets to provide insights on storms that aren’t possible by looking at single data sets alone.

The progress of NASA’s GRIP aircraft can be followed in near-real-time when they are flying at this website. “Click to start RTMM Classic” will download a KML file that displays in Google Earth.

Source: JPL

Here are some more hurricane pictures, and even more hurricanes pictures.

New Horizons Mission Practices Telescopic Imager on Pluto’s Twin

New Horizons image of Neptune and its largest moon, Triton. June 23, 2010. Credit: NASA

[/caption]

This summer, the New Horizons spacecraft was awoken for its annual systems checkout, and took the opportunity to exercise the long range camera by snapping pictures of Neptune, which at the time, was 3.5 billion km (2.15 billion miles) away. The Long Range Reconnaissance Imager (LORRI) snapped several photos of the gas giant, but Neptune was not alone! The moon Triton made a cameo appearance. And the New Horizons team said that since Triton is often called Pluto’s “twin” it was perfect target practice for imaging its ultimate target, Pluto.

This image gets us excited for 2015 when New Horizons will approach and make the closest flyby ever of Pluto.

“That we were able to see Triton so close to Neptune, which is approximately 100 times brighter, shows us that the camera is working exactly as designed,” said New Horizons Project Scientist Hal Weaver, of the Johns Hopkins Applied Physics Laboratory. “This was a good test for LORRI.”

Weaver pointed out that the solar phase angle (the spacecraft-planet-Sun angle) was 34 degrees and the solar elongation angle (planet-spacecraft-Sun angle) was 95 degrees. Only New Horizons can observe Neptune at such large solar phase angles, which he says is key to studying the light-scattering properties of Neptune’s and Triton’s atmospheres.

“As New Horizons has traveled outward across the solar system, we’ve been using our imagers to make just such special-purpose studies of the giant planets and their moons because this is a small but completely unique contribution that New Horizons can make — because of our position out among the giant planets,” said New Horizons Principal Investigator Alan Stern.

Triton is slightly larger than Pluto, 2,700 kilometers (1,700 miles) in diameter compared to Pluto’s 2,400 kilometers (1,500 miles). Both objects have atmospheres composed mostly of nitrogen gas with a surface pressure only 1/70,000th of Earth’s, and comparably cold surface temperatures approaching minus-400 degrees Fahrenheit. Triton is widely believed to have been a member of the Kuiper Belt (as Pluto still is) that was captured into orbit around Neptune, probably during a collision early in the solar system’s history.

Source: New Horizons

How to Crash Stars Together

Globular Cluster
A Hubble Space Telescope image of the typical globular cluster Messier 80, an object made up of hundreds of thousands of stars and located in the direction of the constellation of Scorpius. The Milky Way galaxy has an estimated 160 globular clusters of which one quarter are thought to be ‘alien’. Image: NASA / The Hubble Heritage Team / STScI / AURA. Click for hi-resolution version.

[/caption]

The math is simple: Star + Other star = Bigger star.

While conceptually this works well, it fails to take into account the extremely vast distances between stars. Even in clusters, where the density of stars is significantly higher than in the main disk, the number of stars per unit volume is so low that collisions are scarcely considered by astronomers. Of course, at some point the stellar density must reach a point at which the chance for a collision does become statistically significant. Where is that tipping point and are there any locations that might actually make the cut?

Early in the development of stellar formation models, the necessity of stellar collisions to produce massive stars was not well constrained. Early models of formation via accretion hinted that accretion may be insufficient, but as models became more complex and moved into three dimensional simulations, it became apparent that collisions simply weren’t needed to populate the upper mass regime. The notion fell out of favor.

However, there have been two recent papers that have explored the possibility that, while still certainly rare, there may be some environments in which collisions are likely to occur. The primary mechanism that assists in this is the notion that, as clusters sweep through the interstellar medium, they will inevitably pick up gas and dust, slowly increase in mass. This increase mass will cause the cluster to shrink, increasing the stellar density. The studies suggest that in order for the probability of collision to be statistically significant, a cluster would be required to reach a density of roughly 100 million stars per cubic parsec. (Keep in mind, a parsec is 3.26 light years and is roughly the distance between the sun, and our nearest neighboring star.)

Presently, such a high concentration has never been observed. While some of this is certainly due to the rarity of such densities, observational constraints likely play a crucial role in making such systems difficult to detect. If such high densities were to be achieved, it would require extraordinarily high spatial resolution to distinguish such systems. As such, numerical simulations of extremely dense systems will have to replace direct observations.

While the density necessary is straightforward, the more difficult topic is what sorts of clusters might be capable of meeting such criteria. To investigate this, the teams writing the recent papers conducted Monte Carlo simulations in which they could vary the numbers of stars. This type of simulation is essentially a model of a system that is allowed to play forward repeatedly with slightly different starting configurations (such as the initial positions of the stars) and by averaging the results of numerous simulations, an approximate understanding of the behavior of the system is reached. An initial investigation suggested that such densities could be reached in clusters with as little as a few thousand stars provided gas accumulation were sufficiently rapid (clusters tend to disperse slowly under tidal stripping which can counteract this effect on longer timescales). However, the model they used contained numerous simplifications since the investigation into the feasibility of such interactions was merely preliminary.

The more recent study, uploaded to arXiv yesterday, includes more realistic parameters and finds that the overall number of stars in the clusters would need to be closer to 30,000 before collisions became likely. This team also suggested that there were more conditions that would need to be satisfied including rates of gas expulsion (since not all gas would remain in the cluster as the first team had assumed for simplicity) and the degree of mass segregation (heavier stars sink to the center and lighter ones float to the outside and since heavier ones are larger, this actually decreases the number density while increasing the mass density).  While many globular clusters can easily meet the requirement of number of stars, these other conditions would likely not be met. Furthermore, globular clusters spend little time in regions of the galaxy in which they would be likely to encounter sufficiently high densities of gas to allow for accumulation of sufficient mass on the necessary timescales.

But are there any clusters which might achieve sufficient density? The most dense galactic cluster known is the Arches cluster. Sadly, this cluster only reaches a modest ~535 stars per cubic parsec, still far too low to make a large number of collisions likely. However, one run of the simulation code with conditions similar to those in the Arches cluster did predict one collision in ~2 million years.

Overall, these studies seem to confirm that the role of collisions in forming massive stars is small. As pointed out previously, accretion methods seem to account for the broad range of stellar masses. Yet in many young clusters, still forming stars, rarely do astronomers find stars much in excess of ~50 solar masses. The second study this year suggests that this observation may yet leave room for collisions to play some unexpected role.

(NOTE: While it may be suggested that collisions could also be considered to take place as the orbit of binary stars decays due to tidal interactions, such processes are generally referred to as “mergers”. The term “collision” as used in the source materials and this article is used to denote the merging of two stars that are not gravitationally bound.)

Sources:

Stellar collisions in accreting protoclusters: a Monte Carlo dynamical study

Collisional formation of very massive stars in dense clusters

Ultraluminous Gamma Ray Burst 080607 – A “Monster in the Dark”

Shedding Light on Dark Gamma Ray Bursts

[/caption]

Gamma Ray Bursts (GRBs) are among the most energetic phenomena astronomers regularly observe. These events are triggered by massive explosions and a large amount of the energy if focused into narrow beams that sweep across the universe. These beams are so tightly concentrated that they can be seen across the visible universe and allow astronomers to probe the universe’s history. If such an event happened in our galaxy and we stood in the path of the beam, the effects would be pronounced and may lead to large extinctions. Yet one of the most energetic GRBs on record (GRB 080607) was shrouded in cloud of gas and dust dimming the blast by a factor of 20 – 200, depending on the wavelength.  Despite this strong veil, the GRB was still bright enough to be detected by small optical telescopes for over an hour. So what can this hidden monster tell astronomers about ancient galaxies and GRBs in general?

GRB 080607 was discovered on June 6, 2008 by the Swift satellite. Since GRBs are short lived events, searches for them are automated and upon detection, the Swift satellite immediately oriented itself towards the source. Other GRB hunting satellites quickly joined in and ground based observatories, including ROTSE-III and Keck made observations as well. This large collection of instruments allowed astronomers, led by D. A. Perley of UC Berkley, to develop a strong understanding of not just the GRB, but also the obscuring gas. Given that the host galaxy lies at a distance of over 12 billion light years, this has provided a unique probe into the nature of the environment of such distant galaxies.

One of the most surprising features was unusually strong absorption near 2175 °A. Although such absorption has been noticed in other galaxies, it has been rare in galaxies at such large cosmological distances. In the local universe, this feature seems to be most common in dynamically stable galaxies but tends to be “absent in more disturbed locations such as the SMC, nearby starburst galaxies” as well as some regions of the Milky Way which more turbulence is present. The team uses this feature to imply that the host galaxy was stable as well. Although this feature is familiar in nearby galaxies, observing it in this case makes it the furthest known example of this phenomenon. The precise cause of this feature is not yet known, although other studies have indicated “polycyclic aromatic hydrocarbons and graphite” are possible suspects.

Earlier studies of this event have shown other novel spectral features. A paper by Sheffer et al. notes that the spectrum also revealed molecular hydrogen. Again, such a feature is common in the local universe and many other galaxies, but never before has such an observation been made linked to a galaxy in which a GRB has occurred. Molecular hydrogen (as well as other molecular compounds) become disassociated at high temperatures like the ones in galaxies containing large amounts of star formation that would produce regions with large stars capable of triggering GRBs. With observations of one molecule in hand, this lead Sheffer’s team to suspect that there might be large amounts of other molecules, such as carbon monoxide (CO). This too was detected making yet another first for the odd environment of a GRB host.

This unusual environment may help to explain a class of GRBs known as “subluminous optical bursts” or “dark bursts” in which the optical component of the burst (especially the afterglow) is less bright than would be predicted by comparison to more traditional GRBs.

Sources:

Monster in the Dark: The Ultra Luminous GRB 080706 and its Dusty Environment

The Discovery of Vibrationally-Excited H2 In the Molecular Cloud Near GRB 080706

disassociated

Near Earth Asteroids Vary Widely in Composition, Origin

Eros Asteroid
The asteroid Eros, as seen by the NEAR mission. Credit: NASA

[/caption]

From the Spitzer website:

New research from NASA’s Spitzer Space Telescope reveals that asteroids somewhat near Earth, termed near-Earth objects, are a mixed bunch, with a surprisingly wide array of compositions. Like a piñata filled with everything from chocolates to fruity candies, these asteroids come in assorted colors and compositions. Some are dark and dull; others are shiny and bright. The Spitzer observations of 100 known near-Earth asteroids demonstrate that the objects’ diversity is greater than previously thought.

The findings are helping astronomers better understand near-Earth objects as a whole — a population whose physical properties are not well known.

“These rocks are teaching us about the places they come from,” said David Trilling of Northern Arizona University, Flagstaff, lead author of a new paper on the research appearing in the September issue of Astronomical Journal. “It’s like studying pebbles in a streambed to learn about the mountains they tumbled down.”

After nearly six years of operation, in May 2009, Spitzer used up the liquid coolant needed to chill its infrared detectors. It is now operating in a so-called “warm” mode (the actual temperature is still quite cold at 30 Kelvin, or minus 406 degrees Fahrenheit). Two of Spitzer’s infrared channels, the shortest-wavelength detectors on the observatory, are working perfectly.

One of the mission’s new “warm” programs is to survey about 700 near-Earth objects, cataloging their individual traits. By observing in infrared, Spitzer is helping to gather more accurate estimates of asteroids’ compositions and sizes than what is possible with visible light alone. Visible-light observations of an asteroid won’t differentiate between an asteroid that is big and dark, or small and light. Both rocks would reflect the same amount of visible sunlight. Infrared data provide a read on the object’s temperature, which then tells an astronomer more about the actual size and composition. A big, dark rock has a higher temperature than a small, light one because it absorbs more sunlight.

Trilling and his team have analyzed preliminary data on 100 near-Earth asteroids so far. They plan to observe 600 more over the next year. There are roughly 7,000 known near-Earth objects out of a population expected to number in the tens to hundreds of thousands.

“Very little is known about the physical characteristics of the near-Earth population,” said Trilling. “Our data will tell us more about the population, and how it changes from one object to the next. This information could be used to help plan possible future space missions to study a near-Earth object.”

The data show that some of the smaller objects have surprisingly high albedos (an albedo is a measurement of how much sunlight an object reflects). Since asteroid surfaces become darker with time due to exposure to solar radiation, the presence of lighter, brighter surfaces for some asteroids may indicate that they are relatively young. This is evidence for the continuing evolution of the near-Earth object population.

In addition, the fact that the asteroids observed so far have a greater degree of diversity than expected indicates that they might have different origins. Some might come from the main belt between Mars and Jupiter, and others could come from farther out in the solar system. This diversity also suggests that the materials that went into making the asteroids — the same materials that make up our planets — were probably mixed together like a big solar-system soup very early in its history.

The research complements that of NASA’s Wide-field Infrared Survey Explorer, or WISE, an all-sky infrared survey mission also up in space now. WISE has already observed more than 430 near-Earth objects — of these, more than 110 are newly discovered.

In the future, both Spitzer and WISE will tell us even more about the “flavors” of near-Earth objects. This could reveal new clues about how the cosmic objects might have dotted our young planet with water and organics — ingredients needed to kick-start life.