[/caption]
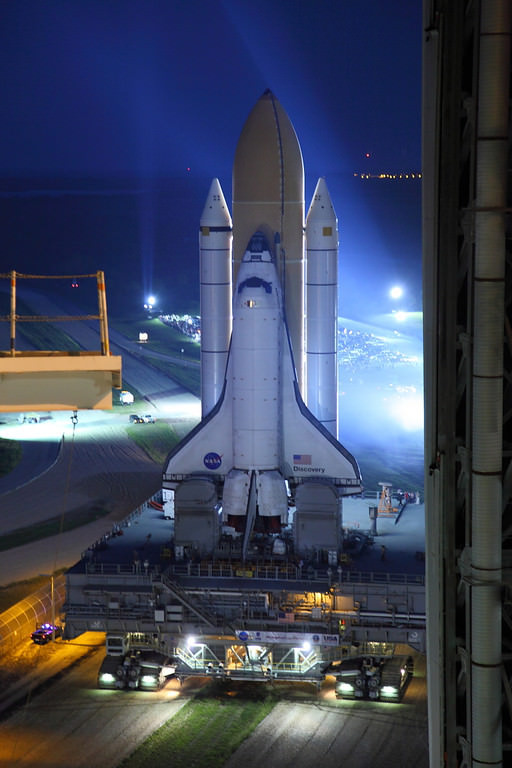
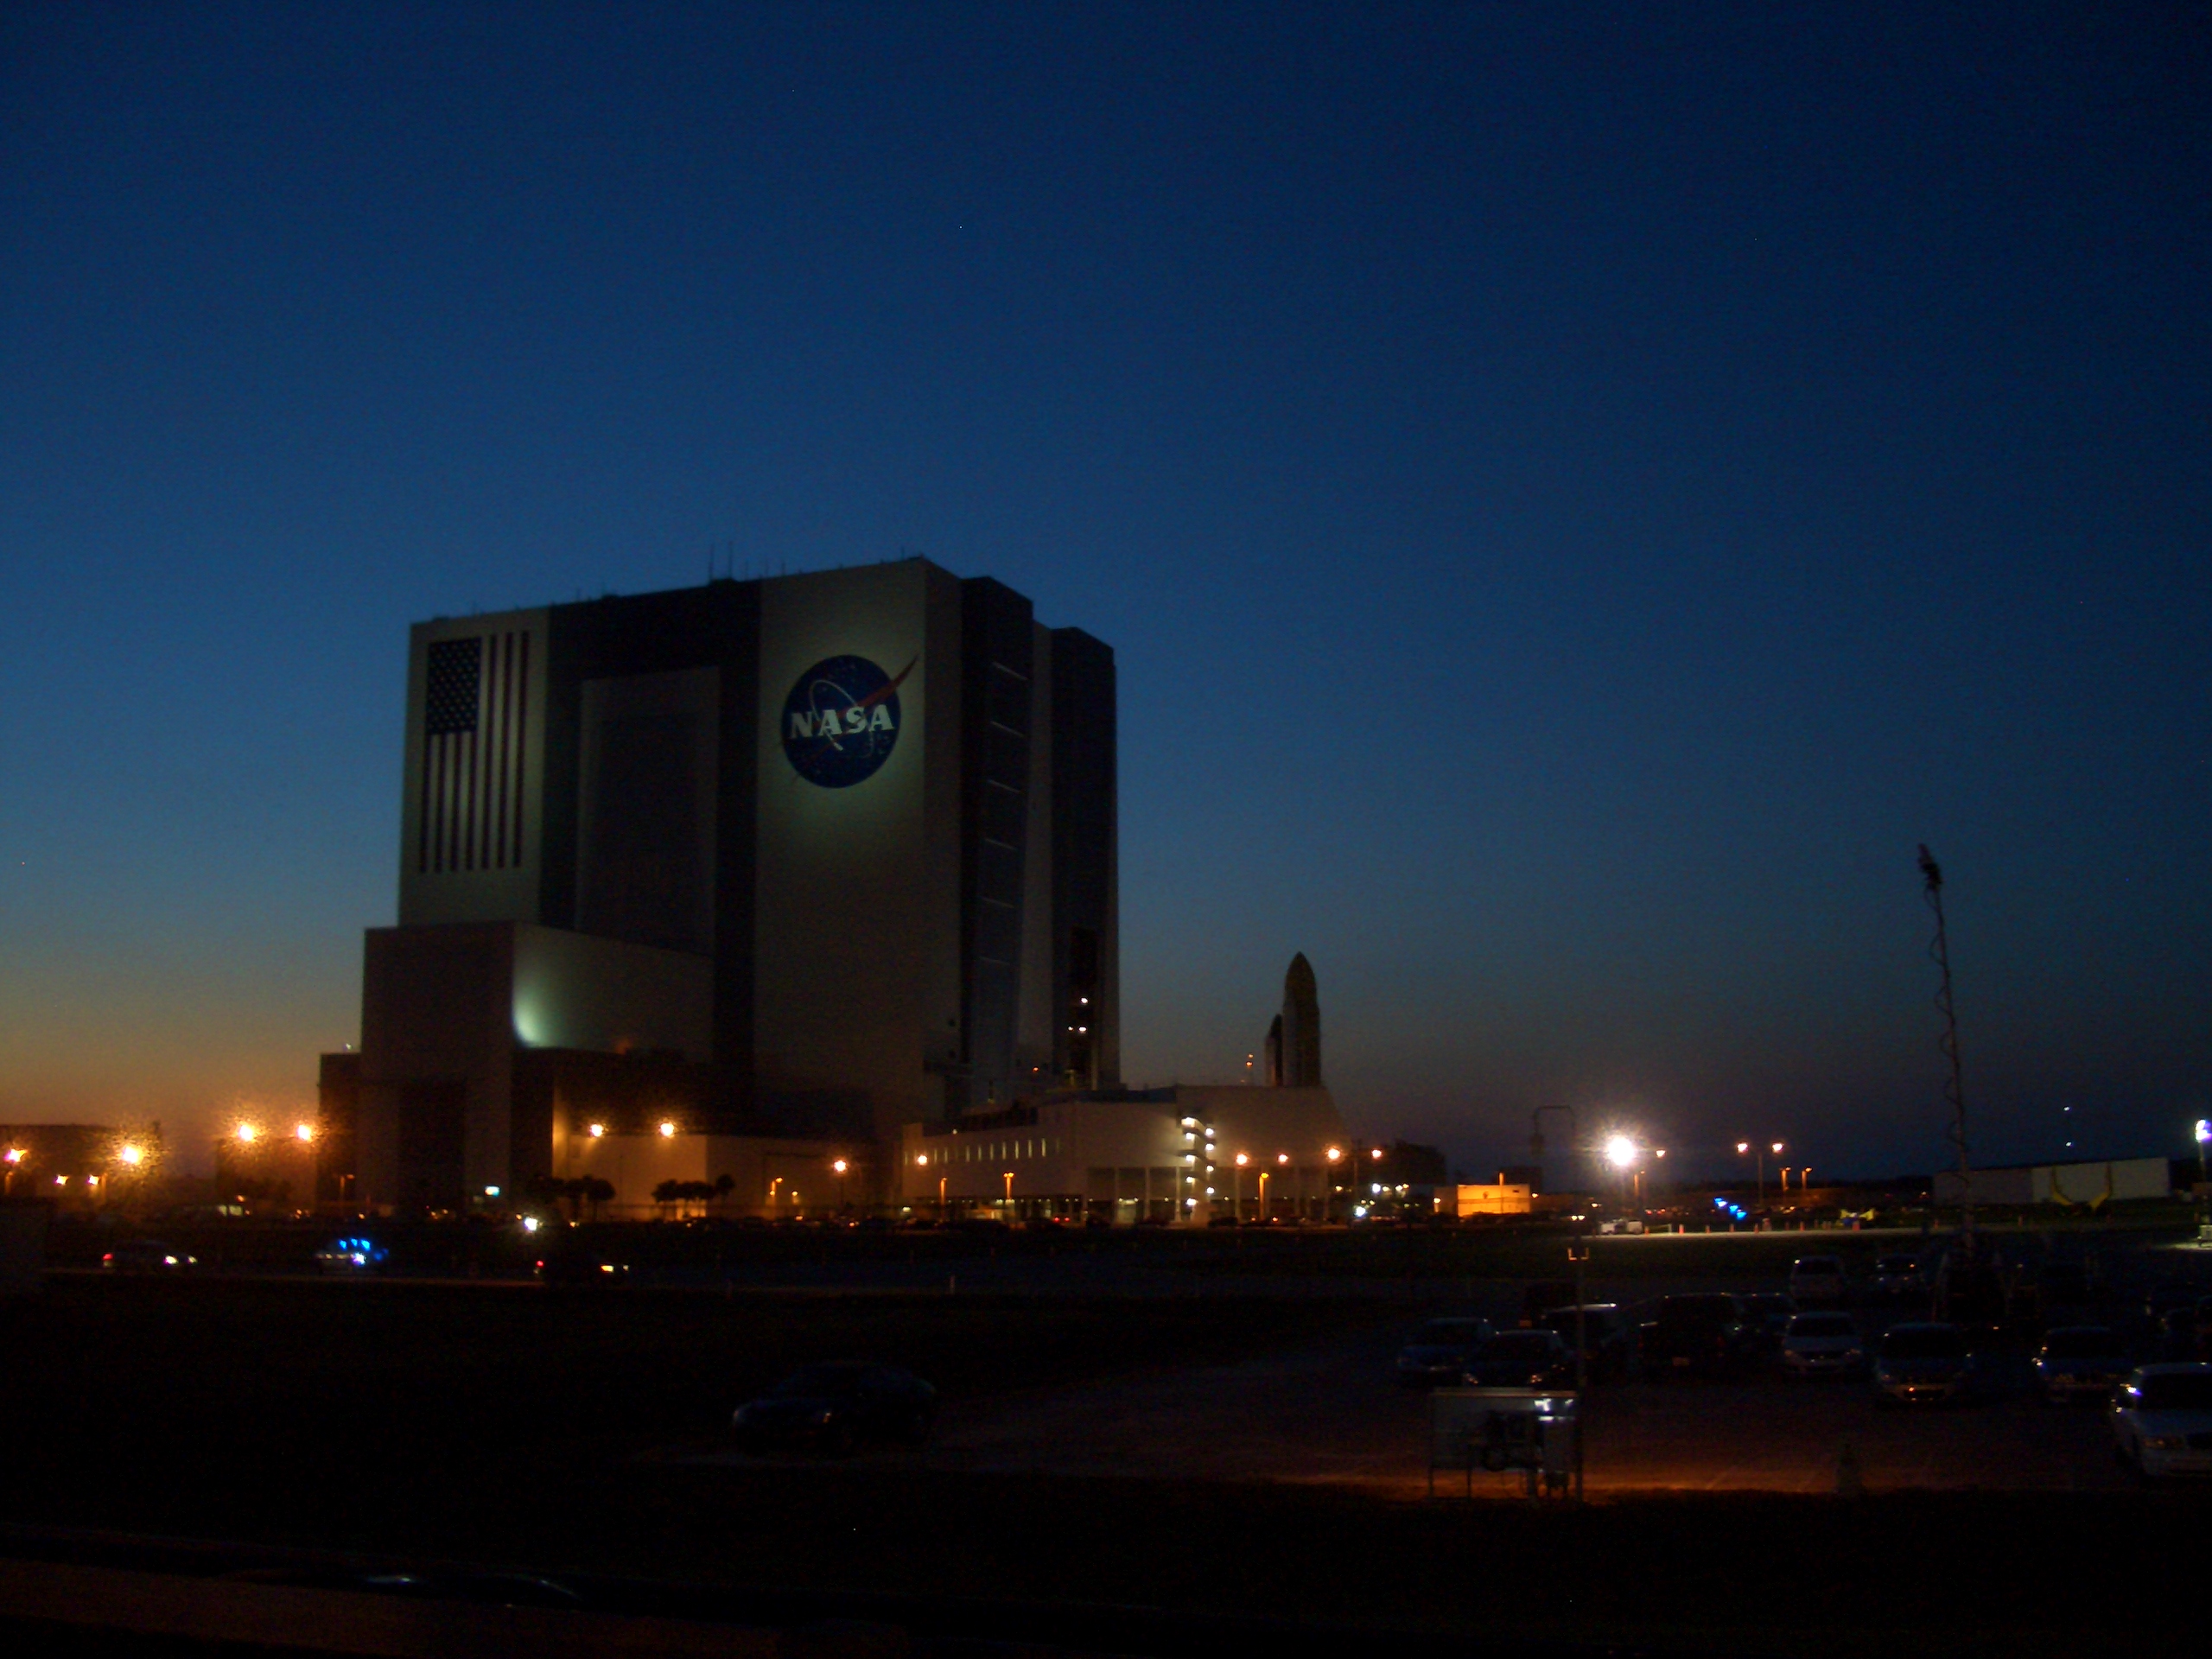
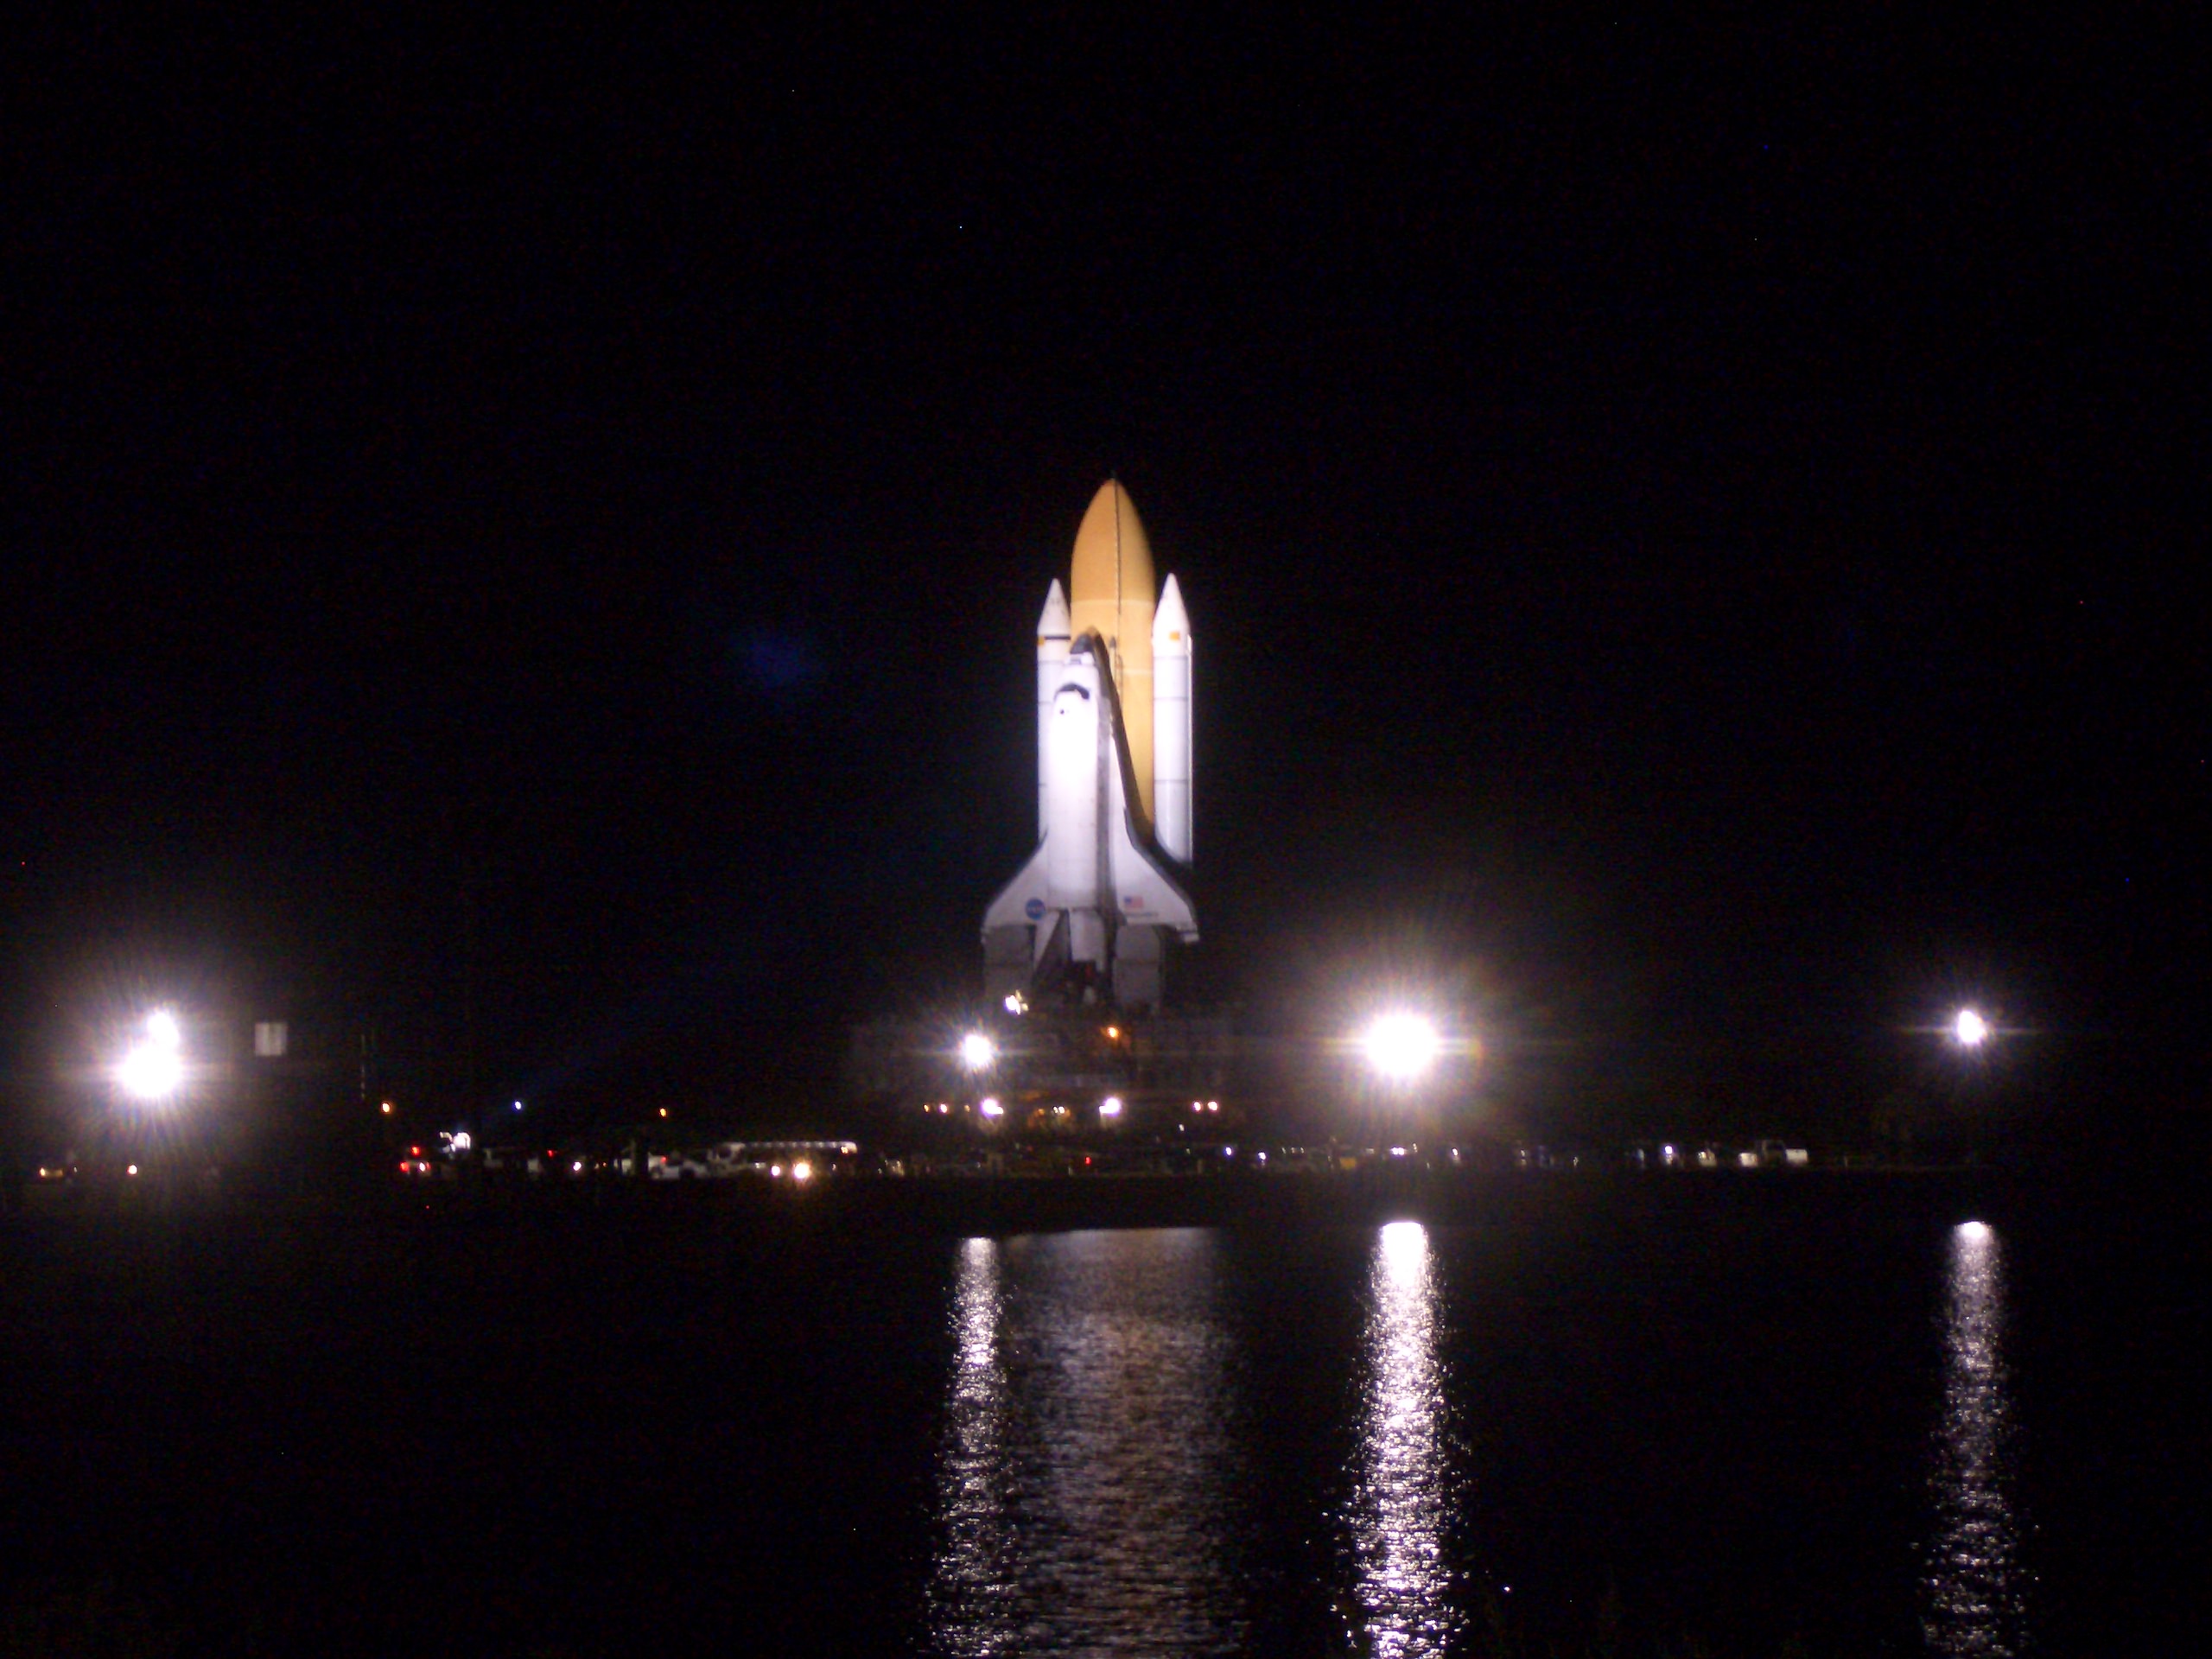
CAPE CANAVERAL – The space shuttle Discovery, its nosed pointed toward the sky, its belly attached to the massive, orange External Tank (ET) and twin Solid Rocket Boosters (SRB) slowly but surely emerged from the cavernous Vehicle Assembly Building at 7:24 p.m. EDT on Sept. 20. This marks the final time Discovery is scheduled to make the 3.4 – mile trip to Launch Complex 39A (LC39A) in preparation for her last planned mission – STS-133.
 for Universe Today.")
Bathed in spotlights Discovery’s last rollout was a bittersweet moment for workers that have cared for the orbiter. Discovery was rolled out four hours earlier than normal so that workers could take pictures. Rollout is conducted in the evening hours to prevent potential damage from possible lightning strikes. The crawler-transporter moves at a blistering mile-an-hour, but despite this slow speed, the vehicle and its precious cargo create an amazing spectacle.
Discovery is currently scheduled to lift off from LC39A on Nov. 1 at 4:40 p.m. EDT. Afterward Discovery will be maintained in flight ready condition in case the orbiter is needed to fly a possible rescue mission. After the end of the shuttle era, Discovery will go to the Smithsonian Air and Space Museum located in Washington D.C.
There are two crawler-transporters that NASA has used to transport spacecraft from the VAB to LC39A. They were originally used to transport the mighty Saturn family of rockets during the Apollo era. The crawler-transporters were designed by Bucyrus International and built by Marion Power Shovel. The vehicles cost $14 million a piece and are the largest self-powered track vehicles in the world.
STS-133 marks the 35th flight to the orbiting outpost and the 39th flight for Discovery and the 133rd flight in the space shuttle program. The crew members for this mission are Commander Steven Lindsey, Pilot Eric Boe and Mission Specialists Alvin Drew, Michael Barratt, Tim Kopra and Nicole Stott. Discovery will deliver and install the Leonardo Permanent Multipurpose Module (PMM), the Express Logistics Carrier 4 as well as deliver critical spare components to the ISS. Also onboard is the first humanoid robot to fly in space, Robonaut-2. For those that have cared for the orbiter however, this is just another day at the office.
 for Universe Today")
“For me seeing Discovery head to the pad brings to mind all the hard work done by the team that has brought us to this point, ” Discovery’s Flow Director, Stephanie Stilson said. “While every rollout is a major milestone for us, this happens to be the last but we are trying to look at it as just another rollout to the pad.”
 for Universe Today.")
 for Universe Today.")
")
UPDATE: And here are some shots of Discovery at the launchpad:
 for Universe Today")
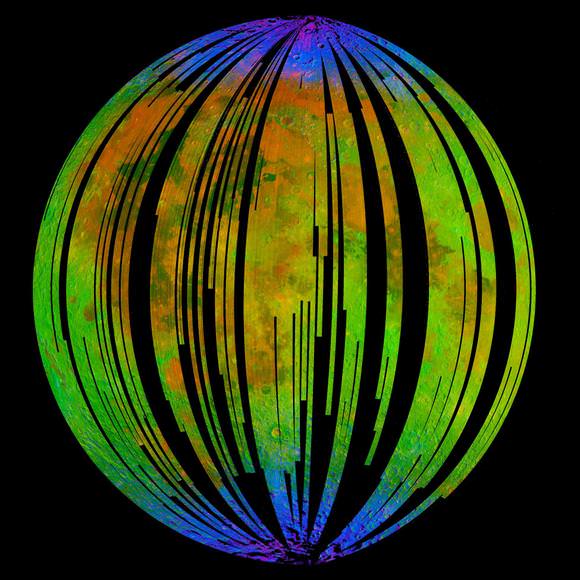

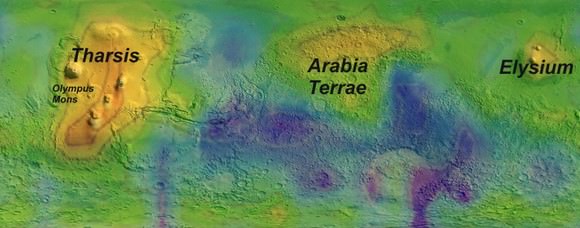
. Peak emissions fall over Tharsis (home to the Solar System's largest volcano, Olympus Mons), the Arabia Terrae plains and the Elysium region, also the site of volcanos. Bottom: True colour map of Mars. Credit: NASA/Università del Salento")
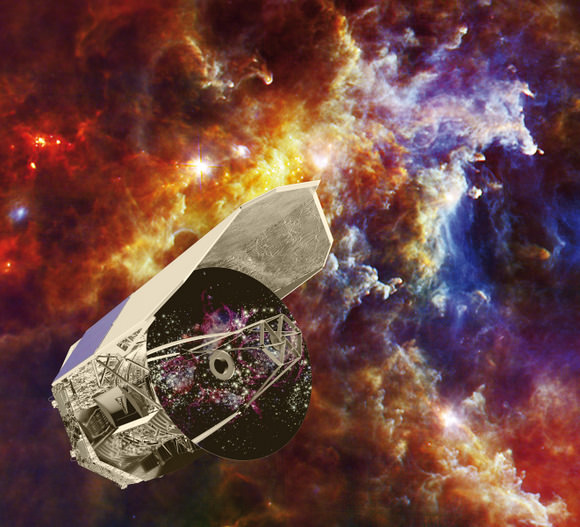
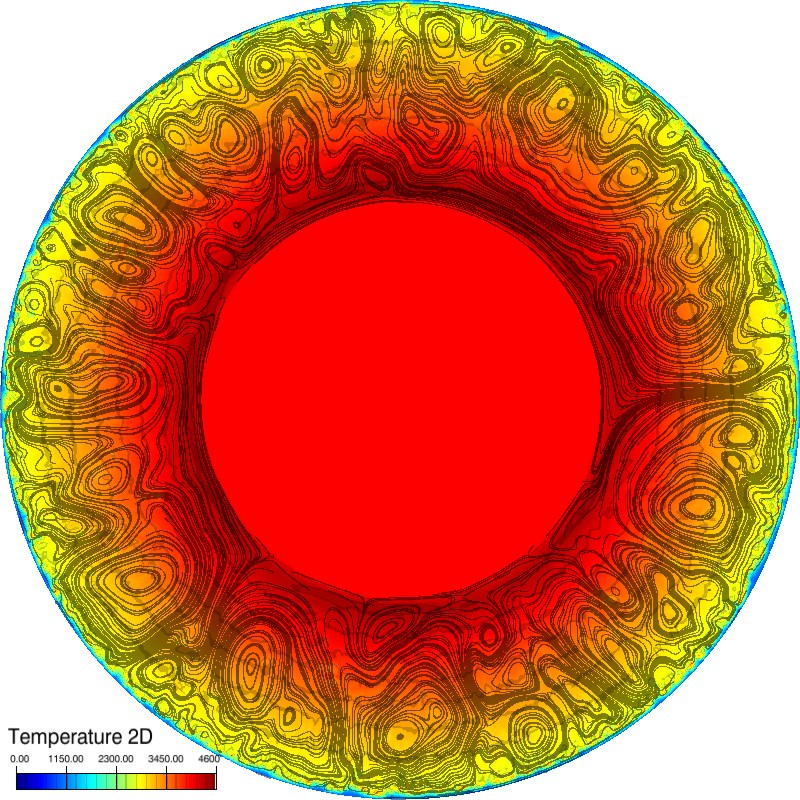
 and model (red) of molecular oxygen in the Martian atmosphere. Credit: ESA/Herschel team")